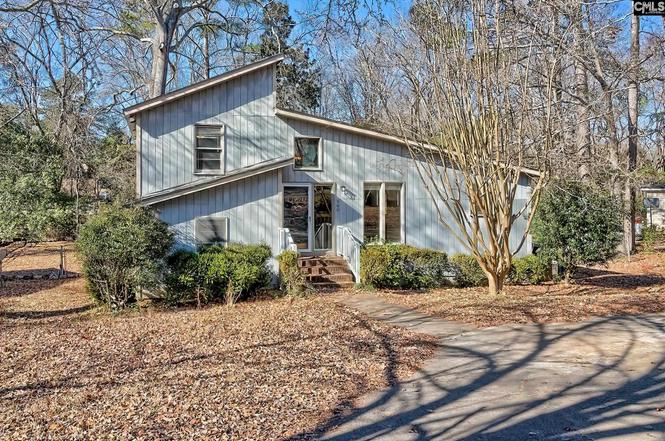
500 Cockspur Rd · Irmo, SC
Flood risk 6/10 · Moderate
- FEMA flood zone
- X
- Chance of flooding over 30 yrs
- 0.71%
- Est. flood insurance / yr
- $507 – $1,088
Fire risk 3/10 · Minor
- Est. fire insurance / yr
- $783 – $1,453
Heat risk 6/10 · Moderate
- Hot days now (above 108°F)
- 7 days/yr
- Hot days in 30 yrs
- 16 days/yr
Wind risk 6/10 · Moderate
- Chance of severe wind over 30 yrs
- 64.0%
Air-quality risk 3/10 · Minor
- Unhealthy air days now
- 3 days/yr
- Unhealthy air days in 30 yrs
- 3 days/yr
Risk factors via First Street. Map © Google.
Why this score? — see what drove the B- grade
The composite is a weighted blend of 9 inputs, each scored 0–100. Each bar is that input's sub-score; the figure is the points it added to the 100-point composite (weight × sub-score).
- Cash flow +29.0/30.0
- DSCR +10.0/10.0
- ARV discount +7.5/15.0
- 1% rule +7.3/10.0
- Schools +4.5/10.0
- Livability +3.7/5.0
- Rent growth +2.7/5.0
- Condition / age +2.5/5.0
- Appreciation +0.0/10.0
$155,000
🖨 Deal sheet (PDF) 📄 Offer letter ✓ Due diligence
Listing remarks
Contemporary 1970s home located in the heart of Irmo in the New Friarsgate neighborhood. This 3-bedroom, 2-bath home offers nearly 1,500 square feet of living space with a unique layout. The sunken family room features a high vaulted ceiling and cozy fireplace, creating a warm and inviting gathering space. The primary suite is privately tucked away upstairs and includes its own bathroom, offering a quiet retreat. Enjoy an abundance of storage throughout the home. Relax and entertain on a huge screened porch overlooking a spacious, fenced backyard. Convenient location close to schools, shopping, and dining. Disclaimer: CMLS has not reviewed and, therefore, does not endorse vendors who may a
Key facts
- Huge screened porch
- Sunken family room
- Primary suite
Tags
Property features AI
Exterior
- Utilities: Public water; Public sewer
- Home design: Two-story property
- Construction: Slab foundation
- Exterior features: Screened back porch; Wood exterior finish; Privacy wood fencing in rear
Interior
- Kitchen: Kitchen located on the main level
- Bedrooms: Master bedroom on the second floor with his-and-hers closets and private bath; Second bedroom on the main level; Third bedroom on the main level
- Flooring: Carpeted floors in bedrooms and great room
- Bathrooms: Two full bathrooms total (including one main-level full bath and one second-level full bath)
- Heating & cooling: Central heating; Central air conditioning
- Interior features: Vaulted ceilings in the great room; Exposed beams in the great room; Carpeted floors in great room and bedrooms; Wood-burning fireplace (1)
- Laundry & utility: Washer/dryer located on the main level
Neighborhood map
What this means for you Summary
Snapshot
- This is a 3-bed/2.0-bath single-family listed at $155k.
Deal economics
- At list price, monthly cash flow is $531 ($6k/yr) — positive.
- The deal already cash-flows at list — no discount required.
- Meets the 1% rule at list price ($2k rent vs $155k).
- Recommended offer: $136k (12.0% below list) — sets the bar for market timing.
Location & tenants
- Location reads 73/100 on livability (#38 in SC) — a middle-class / working-renter tenant base. Strengths: cost of living A+, housing A+, employment B; Watch: amenities F, commute F.
- Lexington 05 (suburban): math 47% / reading 55% proficiency, ranked #5 of 80 in SC (top 6%) — acceptable for families but not a draw, mixed tenant base, ~2y average lease.
- Zoned schools: H. E. Corley Elementary (math 42% / reading 52%, grade D-, #209 of 597 statewide, top 36%, 558 students, 74% FRL); Dutch Fork High (math 54% / reading 86%, grade B+, #58 of 196 statewide, top 30%, 1,726 students, 52% FRL) — zoned schools average 63% FRL vs 27% district-wide (36 pts higher); higher-poverty schools than district average — tighter screening recommended.
- Market conditions: Rents flat; 315 active listings in the ZIP; 9 comparable units currently listed for rent nearby; rentals at typical pace (median 15d on market — plan ~3-4 weeks tenant-placement turnaround); solid renter incomes; 3,472 units permitted in Richland County in 2024 (1,096 in 5+ unit buildings).
Forward outlook
- Local home prices are declining (-3.0%/yr); year-one equity from $1k of loan paydown is wiped out by about $5k of value loss. Plan a longer hold.
- Richland County population projected at +30% by 2050 — long-run rental-demand tailwind backs the buy-and-hold thesis.
Negotiation context
- It's been on market 127 days — a 12% lower offer ($136k) is reasonable based on typical stale-listing flexibility.
- 2 sale attempts; this cycle's ask has dropped $20k (11%) from the opening price — seller is motivated, your offer sets the floor, not the list.
Risks & watch-outs
- Climate carrying-cost: major flood risk; major wind risk, 64% chance of damaging wind over 30y; extreme-heat days projected 7→16/yr by 2055 (HVAC capex compounding) — expect insurance premiums to compound above CPI over the hold.
Questions for the listing agent
- It's been on market 127 days. Have you received any prior offers? Is the seller open to a 12% concession, seller financing, or rate buy-down credit?
- Built in 1977 — when were the roof, HVAC, electrical panel, plumbing, and water heater last replaced?
- Why hasn't it sold? Are there any deal-killer items the seller is aware of (foundation, flood, title, zoning, code violations)?
- Is there a deadline driving the sale (1031 exchange, divorce, estate, relocation)? That informs how much negotiation room exists.
- Schools are B-rated — typically a magnet for longer-tenancy family renters. What's the average tenant stay here, and is there a school-zone premium baked into asking?
- What's the average days-on-market for RENTAL listings here right now (not sales)? A rising rental-DOM trend means longer vacancies and softer asking-rent achievability than the comps imply.
- What's the recent tenant-quality profile in this submarket — average credit score on applications, eviction rate, late-payment / NSF rate, and stable-employment percentage? A property-management company in the area should have these aggregated.
- How much new for-sale + rental construction is in the pipeline within 1–3 miles? Heavy new supply typically softens prices + rents 12–24 months out; constrained supply supports both.
Investment metrics
- 1% rule
- 1.23% ✓
- Cap rate
- 10.41%
- Cash-on-cash
- 14.69%
- DSCR
- 1.65
- GRM
- 6.8
CMA / ARV
No comps found within radius.
Projected returns pro-forma
-3.0% appreciation · 0.78% rent growth · sell at horizon
- IRR
- 2.8%
- Equity multiple
- 1.10×
- Total profit
- $4,527
- Equity at exit
- $23,111
- IRR
- 10.2%
- Equity multiple
- 1.72×
- Total profit
- $31,038
- Equity at exit
- $13,402
Cash invested: $43,400 (down + closing). Projections, not guarantees.
Landlord ↔ Tenant lean methodology
- Overall (STATE)
- 90 Strongly Landlord-Friendly
- State South Carolina
- 90 Strongly Landlord-Friendly · R+6
- County
- — inherits STATE
- City
- — inherits STATE
ZIP-level market 29063
- Rents YoY
- 0.8%
- Active inventory
- 315
- Price-to-rent
- 6.8×
Monthly cashflow live
- Estimated rent
- $1,907 high interval (Pro) →
- Mortgage (P&I)
- −$813
- Tax from tax record
- −$98 /mo · $1,176/yr
- Insurance
- −$65
- HOA
- −$0
- Vacancy / Maint / Mgmt
- −$401
- Net cashflow
- $531
Break-even live
Sensitivity live
| Price | -10% $619 | -5% $575 | +0% $531 | +5% $487 | +10% $444 |
|---|---|---|---|---|---|
| Rent | -10% $381 | -5% $456 | +0% $531 | +5% $607 | +10% $682 |
| Rate | -1.0pp $609 | -0.5pp $571 | base $531 | +0.5pp $491 | +1.0pp $450 |
UW: 25.0% down · 7.5% · 30yr · 1.5% tax · 5.0% vac · 8.0% maint · 8.0% mgmt
Financing live
Cash to close
- Down payment
- $38,750
- Closing costs
- $4,650
- Reserves months
- —
- Total cash needed
- —
Loan-product check · same deal, 3 products live
Conventional
25% down · 7.5% · 30yr
- Down + closing
- —
- Monthly P&I
- —
- Monthly cashflow
- —
- DSCR
- —
- Eligible?
- —
Personal DTI + credit; lowest rate.
DSCR
20% down · 8.5% · 30yr
- Down + closing
- —
- Monthly P&I
- —
- Monthly cashflow
- —
- DSCR
- —
- Eligible?
- —
No personal income docs; deal must DSCR.
Hard money
10% down · 12.0% · 12mo
- Down + closing
- —
- Monthly P&I
- —
- Monthly cashflow
- —
- DSCR
- —
- Eligible?
- —
Short-term bridge; refi at stabilization.
Rent comps 9 comps
| Address | Beds | Baths | Sqft | Rent | $/sqft | DOM | Units | Dist |
|---|---|---|---|---|---|---|---|---|
| 530 Chadford Rd Irmo, SC | 3.0 | 2.0 | 1196 | $1,695 | $1.42 | 14d | 1 | 0.14mi |
| 312 Bow Church Rd Irmo, SC | 3.0 | 2.0 | 1505 | $1,861 | $1.24 | 11d | 1 | 0.34mi |
| 228 Chadford Rd Irmo, SC | 3.0 | 2.0 | 1318 | $1,861 | $1.41 | 14d | 1 | 0.41mi |
| 136 Weston Watch Rd Irmo, SC | 3.0 | 2.0 | 1200 | $1,695 | $1.41 | 3d | 1 | 0.46mi |
| 22 Dean Crest Ct Irmo, SC | 3.0 | 2.0 | 1301 | $1,695 | $1.30 | 3d | 1 | 0.47mi |
| 508 Cornerstone Cir Irmo, SC | 3.0 | 2.0 | 1867 | $2,200 | $1.18 | 24d | 1 | 0.53mi |
| 13 Dyers Hall Ct Irmo, SC | 3.0 | 2.0 | 1127 | $1,699 | $1.51 | 24d | 1 | 0.55mi |
| 1 Crescent Ln Columbia, SC | 2.0 | 1.5 | 1300 | $1,380 | $1.06 | 3d | 1 | 1.10mi |
| 108 Cranewater Dr Columbia, SC | 3.0 | 2.5 | 1600 | $1,795 | $1.12 | 24d | 1 | 1.21mi |
Listing history 26 events
-
2026-06-18days on market $155,000 Active 127 DOM
-
2026-06-17days on market $155,000 Active 126 DOM
-
2026-06-16days on market $155,000 Active 125 DOM
-
2026-06-15days on market $155,000 Active 124 DOM
-
2026-06-14days on market $155,000 Active 122 DOM
-
2026-06-13days on market $155,000 Active 121 DOM
-
2026-06-10days on market $155,000 Active 119 DOM
-
2026-06-09days on market $155,000 Active 118 DOM
-
2026-06-08days on market $155,000 Active 117 DOM
-
2026-06-07days on market $155,000 Active 116 DOM
-
2026-06-03days on market $155,000 Active 112 DOM
-
2026-06-03days on market $155,000 Active 111 DOM
-
2026-06-01days on market $155,000 Active 110 DOM
-
2026-05-31days on market $155,000 Active 109 DOM
-
2026-05-12status Pending
-
2026-04-27historical Active - Contingent
-
2026-04-07status Active
-
2026-03-15status Pending
-
2026-03-01historical Active - Contingent
-
2026-02-24price $155,000
-
2026-02-05price $169,000
-
2026-01-02$175,000 Active
-
2021-06-01soldstatus $145,000
-
1999-07-13soldstatus $79,000
-
1998-03-25soldstatus $74,900
-
1988-02-01soldstatus $58,000
ⓘ Source: listings_history table (triggers on properties + properties_extension) + one-shot
backfill from property_details.listing_events for pre-trigger history.
Tax reassessment forecast SC · Resets to sale price
- Current annual tax
- $1,176 · $98/mo
- Projected year-2 tax
- $1,176 · $98/mo
- Expected delta
- $0/yr ($0/mo · 0.0%)
ⓘ Screening estimate from a state-policy table — verify with the county assessor before closing.
Climate risk First Street
- Flood 6/10 Major FEMA zone X · 71% chance over 30 yrs
- Wildfire 3/10 Moderate
- Heat 6/10 Major 7 d/yr ≥108°F today · 16 d/yr by 30 yrs out
- Wind 6/10 Major 64% chance of damaging wind over 30 yrs
- Air quality 3/10 Moderate 3 unhealthy d/yr today · 3 by 30 yrs out
Nearby sold comps map
Loading sold comps map…
Walkable amenities ~0.75 mi
Loading nearby amenities…
Taxation est. · year 1
- Rental income
- $22,888
- − Mortgage interest
- −$8,682
- − Property taxes
- −$1,176
- − Insurance
- −$775
- − Repairs & maintenance
- −$1,831
- − Management
- −$1,831
- − Depreciation
- −$4,509
- Taxable income
- $4,083
- Est. tax owed @ 24.0%
- −$980
- After-tax cash flow
- $5,396/yr
For passive investors: Depreciation is non-cash, so a rental often shows a tax loss while cash-flowing — sheltering income. Rental losses are passive: they offset passive income freely, and up to $25,000/yr can offset ordinary (W-2) income if you actively participate and your MAGI is under $100k (phasing out to $0 by $150k); unused losses carry forward. On sale, claimed depreciation is recaptured at up to 25%, and gains may owe capital-gains tax (a 1031 exchange can defer both). Figures are a year-1 estimate at your 24.0% rate — not tax advice; consult a CPA.
Schools (NCES district)
- District
- Lexington 05
- NCES district ID
- 4502820
- Math proficiency
- 47% ▼ -7.00%
- Reading proficiency
- 55% ▼ -4.00%
- Median HH income
- $67,732
- Composite
- 45.28/100
- National rank
- #2656
- State rank
- #5 of 80 in SC
Livability — Irmo
- Score
- 73/100
- State rank
- #38
- US rank
- #5024
Category grades
Schools grade is shown separately in the Schools card above.
Census & demographics
- Census place
- Irmo, SC
- County
- Richland County · 389,530 people
- City population
- 38,201
- Metro
- Columbia, SC
- Population (ZIP)
- 38,201
- Household income
- $91,973
- Rent vs Own
- Severe rent burden
- 962.0
Population outlook (Richland County) Hauer SSP2
- Today (2025)
- 459,667 people
- By 2030
- 487,524 · +6.1%
- By 2040
- 542,035 · +17.9%
- By 2050
- 595,371 · +29.5%
- By 2075
- 732,998 · +59.5%
- By 2100
- 820,415 · +78.5%
Race, ethnicity, and origin ACS 2023
- Neighborhood character
- Majority White (65%)
- Race & ethnicity
- White 65% Black 26% Two or more races 5% Hispanic / Latino 3% Asian 2%
- Common ancestry
- Romanian 4% Slovak 4% Serbian 3%
- Foreign-born
- 4% · Canada
- Languages at home
- 95% English-only · Spanish 2% Russian/Polish/Slavic 1% Other Indo-European 1%
Political lean MEDSL · Richland
- 2024 margin
- Solid D (+34.6) · D 66.4% · R 31.8% · Other 1.8%
- 2008→2024 swing
- +5.7pp toward D · 2008: 28.9pp · 2024: 34.6pp
- All cycles
- 2024: D+34.6 2020: D+38.3 2016: D+32.9 2012: D+33.3 2008: D+28.9
Not yet ingested
- Civics
- —
Market trends
- HPI YoY
- ▼ -130.57%
- Current HPI
- 204.0147
- Rent YoY
- ▲ 0.78%
- Metro
- Columbia, SC
- State GDP YoY
- ▲ 4.51%
- F500 in state
- 2
Industry mix (Fortune 500 HQ in SC)
| Industry | F500 HQs | Revenue |
|---|---|---|
| Packaging | 1 | $7B |
|
||
Price history
+167.2% since first listed12 events — show timeline
- 2026-05-12 Pending — Consolidated MLS
- 2026-04-27 Contingent — Consolidated MLS
- 2026-04-07 Relisted — Consolidated MLS
- 2026-03-15 Pending — Consolidated MLS
- 2026-03-01 Contingent — Consolidated MLS
- 2026-02-24 Price Changed $155,000 Consolidated MLS
- 2026-02-05 Price Changed $169,000 Consolidated MLS
- 2026-01-02 Listed $175,000 Consolidated MLS
- 2021-06-01 Sold (Public Records) $145,000 Public Records
- 1999-07-13 Sold (Public Records) $79,000 Public Records
- 1998-03-25 Sold (Public Records) $74,900 Public Records
- 1988-02-01 Sold (Public Records) $58,000 Public Records
Property tax history
+4.4%/yrLatest (2025): $1,176 · +3.8% YoY. Source: county tax records.
Cash-flow waterfall
monthlySold comps — $/sqft
last 12 mo · ≤1 miLoading sold comps…