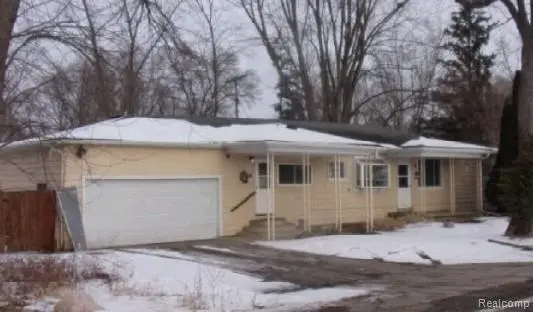
3302 Newton Rd · Commerce, MI
Flood risk 1/10 · Minimal
- FEMA flood zone
- X (unshaded)
- Chance of flooding over 30 yrs
- 0.0%
- Est. flood insurance / yr
- $473 – $860
Fire risk 1/10 · Minimal
- Est. fire insurance / yr
- $784 – $1,456
Heat risk 2/10 · Minimal
- Hot days now (above 96°F)
- 7 days/yr
- Hot days in 30 yrs
- 15 days/yr
Wind risk 2/10 · Minimal
- Chance of severe wind over 30 yrs
- —
Air-quality risk 3/10 · Minor
- Unhealthy air days now
- 2 days/yr
- Unhealthy air days in 30 yrs
- 4 days/yr
Risk factors via First Street. Map © Google.
Why this score? — see what drove the B+ grade
The composite is a weighted blend of 9 inputs, each scored 0–100. Each bar is that input's sub-score; the figure is the points it added to the 100-point composite (weight × sub-score).
- Cash flow +30.0/30.0
- ARV discount +15.0/15.0
- 1% rule +10.0/10.0
- DSCR +10.0/10.0
- Schools +5.0/10.0
- Rent growth +2.5/5.0
- Livability +2.5/5.0
- Condition / age +2.5/5.0
- Appreciation +0.0/10.0
$240,200
🖨 Deal sheet (PDF) 📄 Offer letter ✓ Due diligence
Listing remarks MLS
Great Opportunity to own this single-family home built in 1960 featuring 3 bedrooms and 2 bathrooms. * * * SPECIAL NOTES: (1) This is a CASH ONLY transaction. (2) Seller to pay Taxes, HOA, and Municipal/Utility Liens. (3) Please read the Auction disclaimers carefully before placing a bid or submitting an offer. * * * RESERVE AUCTION PROPERTY- Property sold “AS-IS†without contingencies, repairs, warranties, guarantees or representation as to listing accuracy, property information, photo or other depiction included or described herein. Inspect before bidding.
Key facts
- 0.24 acre lot
- 2 garage spots
- Built 1959
Neighborhood map
What this means for you Summary
Snapshot
- This is a 2-bed/1.5-bath single-family listed at $240k.
Deal economics
- At list price, monthly cash flow is $6k ($76k/yr) — positive.
- The deal already cash-flows at list — no discount required.
- Meets the 1% rule at list price ($10k rent vs $240k).
- Recommended offer: $211k (12.0% below list) — sets the bar for market timing.
Location & tenants
- Location reads: area grade B — affects rentability + tenant quality, not the cash-flow math above.
- Walled Lake Consolidated Schools (suburban): math 52% / reading 60% proficiency, ranked #58 of 540 in MI (top 11%) — acceptable for families but not a draw, mixed tenant base, ~2y average lease; only 20% free/reduced lunch — higher-income household profile.
- Market conditions: 176 active listings in the ZIP; 3 comparable units currently listed for rent nearby; rentals at typical pace (median 23d on market — plan ~3-4 weeks tenant-placement turnaround); 2,614 units permitted in Oakland County in 2024 (721 in 5+ unit buildings).
Forward outlook
- Local home prices are declining (-3.0%/yr); year-one equity from $2k of loan paydown is wiped out by about $7k of value loss. Plan a longer hold.
- Oakland County population projected at +10% by 2050 — modest demand growth; plan on rents tracking national, not racing it.
- At projected returns (-3.0% appreciation + 3.0% rent growth), your $67k cash investment doubles in ~1 year — after that, you're playing with house money.
Negotiation context
- It's been on market 294 days — a 12% lower offer ($211k) is reasonable based on typical stale-listing flexibility.
- 13 sale attempts since 16y ago with the ask held roughly flat each time — persistent listings suggest the price (not the market) is what's stuck; bring a comps-based counter.
- Current owner paid $155k; list at $240k implies a 55% gain — meaningful room to come down on a strong offer.
Risks & watch-outs
- Watch-outs: built in 1959 — expect roof / HVAC / electrical / plumbing capex.
Questions for the listing agent
- It's been on market 294 days. Have you received any prior offers? Is the seller open to a 12% concession, seller financing, or rate buy-down credit?
- Built in 1959 — when were the roof, HVAC, electrical panel, plumbing, and water heater last replaced?
- Why hasn't it sold? Are there any deal-killer items the seller is aware of (foundation, flood, title, zoning, code violations)?
- Is there a deadline driving the sale (1031 exchange, divorce, estate, relocation)? That informs how much negotiation room exists.
- What's the average days-on-market for RENTAL listings here right now (not sales)? A rising rental-DOM trend means longer vacancies and softer asking-rent achievability than the comps imply.
- What's the recent tenant-quality profile in this submarket — average credit score on applications, eviction rate, late-payment / NSF rate, and stable-employment percentage? A property-management company in the area should have these aggregated.
- How much new for-sale + rental construction is in the pipeline within 1–3 miles? Heavy new supply typically softens prices + rents 12–24 months out; constrained supply supports both.
Investment metrics
- 1% rule
- 4.16% ✓
- Cap rate
- 37.89%
- Cash-on-cash
- 112.85%
- DSCR
- 6.02
- GRM
- 2.0
CMA / ARV
- ARV (median comp)
- $325,120
- List price
- $240,200
- Delta
- -26.12%
- Verdict
- UNDERPRICED
- Comps
- 20 within 1.0 mi
Show comp detail 12 sales within ~0.75 mi
| Address | Dist | Beds/Ba | Sqft | Sold | Price | $/sf | Match |
|---|---|---|---|---|---|---|---|
| 3166 Arbutus St | 0.13mi | 3/2.0 (+1) | 1,708 (+0%) | 4mo | $280,000 | $164 | 83 |
| 3090 Twinleaf St | 0.20mi | 3/1.0 (+1) | 1,644 (-3%) | 3mo | $315,000 | $192 | 75 |
| 3220 Chenoa St | 0.11mi | 3/2.0 (+1) | 1,794 (+6%) | 8mo | $299,900 | $167 | 72 |
| 144 Bobolink Ave | 0.62mi | 3/1.0 (+1) | 1,700 (0%) | 8mo | $280,000 | $165 | 57 |
| 9100 Pittsfield St | 0.41mi | 3/2.5 (+1) | 1,843 (+8%) | 1mo | $365,000 | $198 | 57 |
| 9050 Marilyn Ter | 0.47mi | 3/2.0 (+1) | 1,788 (+5%) | 10mo | $610,000 | $341 | 54 |
| 3305 Fox Blvd | 0.22mi | 3/1.5 (+1) | 1,560 (-8%) | 20mo | $301,500 | $193 | 54 |
| 9220 Garden Ter | 0.35mi | 3/1.0 (+1) | 1,872 (+10%) | 12mo | $280,000 | $150 | 50 |
| 9681 Listeria St | 0.17mi | 3/2.0 (+1) | 1,480 (-13%) | 18mo | $300,000 | $203 | 48 |
| 3142 Mapledale St | 0.35mi | 3/2.0 (+1) | 1,454 (-14%) | 9mo | $312,000 | $215 | 45 |
| 157 Cardinal St | 0.59mi | 3/1.5 (+1) | 1,500 (-12%) | 11mo | $231,000 | $154 | 38 |
| 294 Oriole St | 0.70mi | 3/1.5 (+1) | 1,800 (+6%) | 21mo | $325,000 | $181 | 35 |
Match score weights: distance 35% · size 25% · config 20% · recency 20%. Top-matched comps best support the ARV.
Projected returns pro-forma
-3.0% appreciation · 3.0% rent growth · sell at horizon
- IRR
- —
- Equity multiple
- 6.41×
- Total profit
- $364,017
- Equity at exit
- $35,815
- IRR
- —
- Equity multiple
- 13.43×
- Total profit
- $836,088
- Equity at exit
- $20,768
Cash invested: $67,256 (down + closing). Projections, not guarantees.
Landlord ↔ Tenant lean methodology
- Overall (STATE)
- 62 Landlord-Friendly
- State Michigan
- 62 Landlord-Friendly · EVEN
- County
- — inherits STATE
- City
- — inherits STATE
ZIP-level market 48382
- Active inventory
- 176
- Price-to-rent
- 2.0×
Monthly cashflow live
- Estimated rent
- $9,990 medium interval (Pro) →
- Mortgage (P&I)
- −$1,260
- Tax from tax record
- −$207 /mo · $2,488/yr
- Insurance
- −$100
- HOA
- −$0
- Vacancy / Maint / Mgmt
- −$2,098
- Net cashflow
- $6,325
Break-even live
Sensitivity live
| Price | -10% $6,461 | -5% $6,393 | +0% $6,325 | +5% $6,257 | +10% $6,189 |
|---|---|---|---|---|---|
| Rent | -10% $5,536 | -5% $5,930 | +0% $6,325 | +5% $6,720 | +10% $7,114 |
| Rate | -1.0pp $6,446 | -0.5pp $6,386 | base $6,325 | +0.5pp $6,263 | +1.0pp $6,199 |
UW: 25.0% down · 7.5% · 30yr · 1.5% tax · 5.0% vac · 8.0% maint · 8.0% mgmt
Financing live
Cash to close
- Down payment
- $60,050
- Closing costs
- $7,206
- Reserves months
- —
- Total cash needed
- —
Loan-product check · same deal, 3 products live
Conventional
25% down · 7.5% · 30yr
- Down + closing
- —
- Monthly P&I
- —
- Monthly cashflow
- —
- DSCR
- —
- Eligible?
- —
Personal DTI + credit; lowest rate.
DSCR
20% down · 8.5% · 30yr
- Down + closing
- —
- Monthly P&I
- —
- Monthly cashflow
- —
- DSCR
- —
- Eligible?
- —
No personal income docs; deal must DSCR.
Hard money
10% down · 12.0% · 12mo
- Down + closing
- —
- Monthly P&I
- —
- Monthly cashflow
- —
- DSCR
- —
- Eligible?
- —
Short-term bridge; refi at stabilization.
Rent comps 3 comps
| Address | Beds | Baths | Sqft | Rent | $/sqft | DOM | Units | Dist |
|---|---|---|---|---|---|---|---|---|
| 4575 Oakestia St Unit 1032322P Commerce Township, MI | 3.0 | 2.0 | 1991 | $22,512 | $11.31 | 23d | 1 | 1.19mi |
| 3221 Union Lake Rd Commerce Charter Twp, MI | 3.0 | 1.5 | 1360 | $1,950 | $1.43 | 25d | 1 | 1.37mi |
| 486 Charlevoix St Commerce Township, MI | 3.0 | 2.0 | 1740 | $3,500 | $2.01 | 0d | 1 | 1.48mi |
Listing history 50 events
-
2026-06-18days on market $240,200 Active 294 DOM
-
2026-06-17days on market $240,200 Active 293 DOM
-
2026-06-16days on market $240,200 Active 292 DOM
-
2026-06-15days on market $240,200 Active 291 DOM
-
2026-06-13days on market $240,200 Active 289 DOM
-
2026-06-13days on market $240,200 Active 288 DOM
-
2026-06-09days on market $240,200 Active 285 DOM
-
2026-06-08days on market $240,200 Active 284 DOM
-
2026-06-07days on market $240,200 Active 283 DOM
-
2026-06-04days on market $240,200 Active 280 DOM
-
2026-06-03days on market $240,200 Active 279 DOM
-
2026-06-02days on market $240,200 Active 278 DOM
-
2026-06-01days on market $240,200 Active 277 DOM
-
2026-05-31days on market $240,200 Active 276 DOM
-
2025-08-28$240,200 Active 601-char remark
Show marketing remark (581 chars)
Great Opportunity to own this single-family home built in 1960 featuring 3 bedrooms and 2 bathrooms. * * * SPECIAL NOTES: (1) This is a CASH ONLY transaction. (2) Seller to pay Taxes, HOA, and Municipal/Utility Liens. (3) Please read the Auction disclaimers carefully before placing a bid or submitting an offer. * * * RESERVE AUCTION PROPERTY- Property sold “AS-IS” without contingencies, repairs, warranties, guarantees or representation as to listing accuracy, property information, photo or other depiction included or described herein. Inspect before bidding.
-
2025-08-28$240,200 Active 581-char remark
Show marketing remark (581 chars)
Great Opportunity to own this single-family home built in 1960 featuring 3 bedrooms and 2 bathrooms. * * * SPECIAL NOTES: (1) This is a CASH ONLY transaction. (2) Seller to pay Taxes, HOA, and Municipal/Utility Liens. (3) Please read the Auction disclaimers carefully before placing a bid or submitting an offer. * * * RESERVE AUCTION PROPERTY- Property sold “AS-IS” without contingencies, repairs, warranties, guarantees or representation as to listing accuracy, property information, photo or other depiction included or described herein. Inspect before bidding.
-
2025-08-27historical
-
2025-08-27historical
-
2025-07-15price $245,000
-
2025-07-14price $245,000
-
2025-07-02price $265,000
-
2025-07-01price $265,000
-
2025-06-09price $280,000
-
2025-06-09price $280,000
-
2025-05-30price $285,000
-
2025-05-29price $285,000
-
2025-05-01price $295,000
-
2025-05-01price $295,000
-
2025-03-03$305,000 Active
-
2025-03-03$305,000 Active
-
2025-02-25historical
-
2016-07-15soldstatus $155,000
-
2016-07-07historical
-
2016-07-07soldstatus $155,000 Sold
-
2016-07-07soldstatus $155,000 Closed
-
2016-05-13status Pending
-
2016-05-13status Pending
-
2016-05-10$153,000 Active
-
2016-05-10$153,000 Active
-
2016-05-06historical
-
2016-05-06historical
-
2016-04-27price $153,000
-
2016-04-27price $153,000
-
2016-04-19price $158,000
-
2016-04-19price $158,000
-
2016-04-08$163,000 Active
-
2016-04-07$163,000 Active
-
2016-03-05historical
-
2016-03-02historical
-
2016-03-01$149,000 Active
ⓘ Source: listings_history table (triggers on properties + properties_extension) + one-shot
backfill from property_details.listing_events for pre-trigger history.
Tax reassessment forecast MI · Partial reset (capped growth)
- Current annual tax
- $2,488 · $207/mo
- Projected year-2 tax
- $3,094 · $258/mo
- Expected delta
- +$606/yr (+$50/mo · 24.3%)
ⓘ Screening estimate from a state-policy table — verify with the county assessor before closing.
Climate risk First Street
- Flood 1/10 Low FEMA zone X (unshaded) · 0% chance over 30 yrs
- Wildfire 1/10 Low
- Heat 2/10 Low 7 d/yr ≥96°F today · 15 d/yr by 30 yrs out
- Wind 2/10 Low
- Air quality 3/10 Moderate 2 unhealthy d/yr today · 4 by 30 yrs out
Nearby sold comps map
Loading sold comps map…
Walkable amenities ~0.75 mi
Loading nearby amenities…
Taxation est. · year 1
- Rental income
- $119,880
- − Mortgage interest
- −$13,455
- − Property taxes
- −$2,488
- − Insurance
- −$1,201
- − Repairs & maintenance
- −$9,590
- − Management
- −$9,590
- − Depreciation
- −$6,988
- Taxable income
- $76,568
- Est. tax owed @ 24.0%
- −$18,376
- After-tax cash flow
- $57,524/yr
For passive investors: Depreciation is non-cash, so a rental often shows a tax loss while cash-flowing — sheltering income. Rental losses are passive: they offset passive income freely, and up to $25,000/yr can offset ordinary (W-2) income if you actively participate and your MAGI is under $100k (phasing out to $0 by $150k); unused losses carry forward. On sale, claimed depreciation is recaptured at up to 25%, and gains may owe capital-gains tax (a 1031 exchange can defer both). Figures are a year-1 estimate at your 24.0% rate — not tax advice; consult a CPA.
Schools (NCES district)
- District
- Walled Lake Consolidated Schools
- NCES district ID
- 2635160
- Math proficiency
- 52% ▼ -4.00%
- Reading proficiency
- 60% ▼ -1.00%
- Median HH income
- $69,184
- Composite
- 49.57/100
- National rank
- #1987
- State rank
- #58 of 540 in MI
Livability — Commerce
No livability data for this city. (Only ~50 U.S. cities are tracked.)
Census & demographics
- Population (ZIP)
- 23,550
Population outlook (Oakland County) Hauer SSP2
- Today (2025)
- 1,335,747 people
- By 2030
- 1,375,100 · +2.9%
- By 2040
- 1,435,385 · +7.5%
- By 2050
- 1,469,250 · +10.0%
- By 2075
- 1,531,946 · +14.7%
- By 2100
- 1,450,485 · +8.6%
Race, ethnicity, and origin ACS 2023
- Neighborhood character
- Predominantly White (86%)
- Race & ethnicity
- White 86% Two or more races 5% Hispanic / Latino 4% Asian 3% Black 3%
- Common ancestry
- Romanian 11% Lithuanian 3% Slovak 3%
- Foreign-born
- 9% · Canada, China, South Korea
- Languages at home
- 90% English-only · Other Indo-European 2% Russian/Polish/Slavic 2% Arabic 1%
Political lean MEDSL · Oakland
- 2024 margin
- D (+10.6) · D 54.4% · R 43.8% · Other 1.9%
- 2008→2024 swing
- -3.9pp toward R · 2008: 14.5pp · 2024: 10.6pp
- All cycles
- 2024: D+10.6 2020: D+14.1 2016: D+8.1 2012: D+8.1 2008: D+14.5
Not yet ingested
- Civics
- —
Market trends
- HPI YoY
- ▼ -265.18%
- Current HPI
- 202.3058
- Rent YoY
- —
- Metro
- —
- State GDP YoY
- ▲ 1.37%
- F500 in state
- 28
Industry mix (Fortune 500 HQ in MI)
| Industry | F500 HQs | Revenue |
|---|---|---|
| Automotive Parts | 3 | $48B |
|
||
| Automotive | 2 | $372B |
|
||
| Chemicals | 1 | $45B |
|
||
| Automotive Retail | 1 | $29B |
|
||
| Healthcare / Medical Devices | 1 | $23B |
|
||
| Automotive Technology | 1 | $20B |
|
||
Price history
+703.3% since first listed48 events — show timeline
- 2025-08-28 Listed $240,200 REALCOMP
- 2025-08-28 Listed $240,200 MiRealSource-MiMLS
- 2025-08-27 Listing Removed — REALCOMP
- 2025-08-27 Listing Removed — MiRealSource-MiMLS
- 2025-07-15 Price Changed $245,000 MiRealSource-MiMLS
- 2025-07-14 Price Changed $245,000 REALCOMP
- 2025-07-02 Price Changed $265,000 MiRealSource-MiMLS
- 2025-07-01 Price Changed $265,000 REALCOMP
- 2025-06-09 Price Changed $280,000 MiRealSource-MiMLS
- 2025-06-09 Price Changed $280,000 REALCOMP
- 2025-05-30 Price Changed $285,000 MiRealSource-MiMLS
- 2025-05-29 Price Changed $285,000 REALCOMP
- 2025-05-01 Price Changed $295,000 MiRealSource-MiMLS
- 2025-05-01 Price Changed $295,000 REALCOMP
- 2025-03-03 Listed $305,000 MiRealSource-MiMLS
- 2025-03-03 Listed $305,000 REALCOMP
- 2025-02-25 Coming Soon — MiRealSource-MiMLS
- 2016-07-15 Sold (Public Records) $155,000 Public Records
- 2016-07-07 Listing Removed — MiRealSource-MiMLS
- 2016-07-07 Sold (MLS) $155,000 MiRealSource-MiMLS
- 2016-07-07 Sold (MLS) $155,000 REALCOMP
- 2016-05-13 Pending — MiRealSource-MiMLS
- 2016-05-13 Pending — REALCOMP
- 2016-05-10 Listed $153,000 MiRealSource-MiMLS
- 2016-05-10 Listed $153,000 REALCOMP
- 2016-05-06 Listing Removed — REALCOMP
- 2016-05-06 Listing Removed — MiRealSource-MiMLS
- 2016-04-27 Price Changed $153,000 MiRealSource-MiMLS
- 2016-04-27 Price Changed $153,000 REALCOMP
- 2016-04-19 Price Changed $158,000 MiRealSource-MiMLS
- 2016-04-19 Price Changed $158,000 REALCOMP
- 2016-04-08 Listed $163,000 MiRealSource-MiMLS
- 2016-04-07 Listed $163,000 REALCOMP
- 2016-03-05 Listing Removed — REALCOMP
- 2016-03-02 Listing Removed — MiRealSource-MiMLS
- 2016-03-01 Listed $149,000 MiRealSource-MiMLS
- 2016-01-22 Price Changed $149,000 REALCOMP
- 2015-11-21 Price Changed $154,000 REALCOMP
- 2015-11-07 Price Changed $159,000 REALCOMP
- 2015-10-18 Listed $165,000 REALCOMP
- 2014-01-02 Sold (MLS) $1,075 MiRealSource-MiMLS
- 2013-12-21 Listing Removed — MiRealSource-MiMLS
- 2013-11-21 Listed $1,150 MiRealSource-MiMLS
- 2010-12-27 Sold (MLS) $25,000 MiRealSource-MiMLS
- 2010-12-27 Sold (MLS) $25,000 REALCOMP
- 2010-11-02 Listing Removed — MiRealSource-MiMLS
- 2010-05-24 Listed $29,900 REALCOMP
- 2010-05-21 Listed $29,900 MiRealSource-MiMLS
Property tax history
+0.3%/yrLatest (2025): $2,488 · -37.3% YoY. Source: county tax records.
Cash-flow waterfall
monthlySold comps — $/sqft
last 12 mo · ≤1 miLoading sold comps…