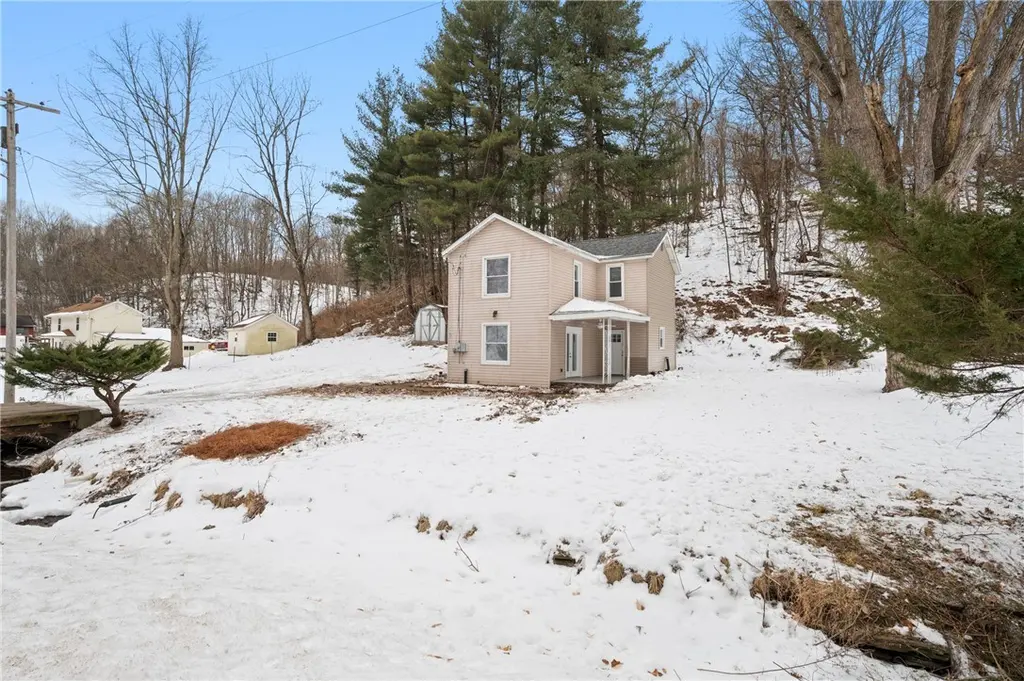
3005 Walton Rd · Jefferson Hills, PA
Flood risk 10/10 · Severe
- FEMA flood zone
- X (unshaded)
- Chance of flooding over 30 yrs
- 0.99%
- Est. flood insurance / yr
- $507 – $1,088
Fire risk 1/10 · Minimal
- Est. fire insurance / yr
- $511 – $949
Heat risk 3/10 · Minor
- Hot days now (above 97°F)
- 7 days/yr
- Hot days in 30 yrs
- 18 days/yr
Wind risk 2/10 · Minimal
- Chance of severe wind over 30 yrs
- —
Air-quality risk 5/10 · Moderate
- Unhealthy air days now
- 8 days/yr
- Unhealthy air days in 30 yrs
- 8 days/yr
Risk factors via First Street. Map © Google.
Why this score? — see what drove the C+ grade
The composite is a weighted blend of 9 inputs, each scored 0–100. Each bar is that input's sub-score; the figure is the points it added to the 100-point composite (weight × sub-score).
- Cash flow +20.2/30.0
- ARV discount +15.0/15.0
- DSCR +6.4/10.0
- Schools +5.3/10.0
- 1% rule +4.5/10.0
- Livability +3.8/5.0
- Rent growth +2.5/5.0
- Condition / age +2.5/5.0
- Appreciation +0.0/10.0
$190,000
🖨 Deal sheet (PDF) 📄 Offer letter ✓ Due diligence
Listing remarks MLS
Beautifully updated two story 3 bedroom, 1 bath home featuring a brand new full bath, new flooring, and thoughtful upgrades throughout. The renovated kitchen showcases brand new stainless steel appliances, creating a bright, refreshed space that’s truly move-in ready. Enjoy the perfect blend of rural charm and everyday convenience, just minutes from shopping, schools, and local hospitals.
Key facts
- Brand new full bath
- Renovated kitchen
- Updated two story
Tags
Neighborhood map
What this means for you Summary
Snapshot
- This is a 3-bed/1.0-bath single-family listed at $190k.
Deal economics
- At list price, monthly cash flow is $173 ($2k/yr) — positive.
- The deal already cash-flows at list — no discount required.
- To meet the 1% rule (rent ≥ 1% of price), the offer needs to be $181k (4.6% below list).
- Recommended offer: $173k (9.0% below list) — sets the bar for market timing.
- Cap rate 7.8% vs local median 2.3% in Jefferson Hills — top-decile yield for the area; either an underpriced asset or a hidden risk that comps aren't pricing in. Stress-test before assuming the spread holds.
Location & tenants
- Location reads 76/100 on livability (#397 in PA, #3,607 nationally) — a middle-class / working-renter tenant base. Strengths: crime A+, employment A+, housing A+; Watch: amenities F, commute F, health & safety F.
- West Jefferson Hills SD (suburban): math 48% / reading 73% proficiency, ranked #60 of 539 in PA (top 11%) — acceptable for families but not a draw, mixed tenant base, ~2y average lease; only 13% free/reduced lunch — higher-income household profile.
- Zoned schools: Gill Hall El Sch (403 students, 29% FRL); Pleasant Hills Ms (math 28% / reading 73%, grade C, #125 of 512 statewide, top 25%, 798 students, 27% FRL); Thomas Jefferson Hs (math 80%, 949 students, 19% FRL).
- Market conditions: 53 active listings in the ZIP; 2,996 units permitted in Allegheny County in 2024 (1,588 in 5+ unit buildings).
- This rent runs 33% of the median local income ($67k/yr) — at the standard rent-burdened threshold; future hikes will face affordability resistance.
Forward outlook
- Local home prices are declining (-3.0%/yr); year-one equity from $1k of loan paydown is wiped out by about $6k of value loss. Plan a longer hold.
Negotiation context
- It's been on market 118 days — a 9% lower offer ($173k) is reasonable based on typical stale-listing flexibility.
- 2 sale attempts since 17y ago; this cycle's ask has dropped $10k (5%) from the opening price — seller is motivated, your offer sets the floor, not the list.
- Current owner paid $54k; list at $190k implies a 251% gain — meaningful room to come down on a strong offer.
Risks & watch-outs
- Watch-outs: flood insurance adds $66/mo; built in 1900 — expect roof / HVAC / electrical / plumbing capex.
- Climate carrying-cost: severe flood risk — expect insurance premiums to compound above CPI over the hold.
Questions for the listing agent
- It's been on market 118 days. Have you received any prior offers? Is the seller open to a 9% concession, seller financing, or rate buy-down credit?
- Built in 1900 — when were the roof, HVAC, electrical panel, plumbing, and water heater last replaced?
- What's the actual annual flood-insurance premium (NFIP or private), and is the property in a SFHA with mandatory coverage?
- Why hasn't it sold? Are there any deal-killer items the seller is aware of (foundation, flood, title, zoning, code violations)?
- Is there a deadline driving the sale (1031 exchange, divorce, estate, relocation)? That informs how much negotiation room exists.
- Schools are A-rated — typically a magnet for longer-tenancy family renters. What's the average tenant stay here, and is there a school-zone premium baked into asking?
- What's the average days-on-market for RENTAL listings here right now (not sales)? A rising rental-DOM trend means longer vacancies and softer asking-rent achievability than the comps imply.
- What's the recent tenant-quality profile in this submarket — average credit score on applications, eviction rate, late-payment / NSF rate, and stable-employment percentage? A property-management company in the area should have these aggregated.
- How much new for-sale + rental construction is in the pipeline within 1–3 miles? Heavy new supply typically softens prices + rents 12–24 months out; constrained supply supports both.
Investment metrics
- 1% rule
- 0.95% ✗
- Cap rate
- 7.81%
- Cash-on-cash
- 5.40%
- DSCR
- 1.24
- GRM
- 8.7
CMA / ARV
- ARV (median comp)
- $304,303
- List price
- $190,000
- Delta
- -37.56%
- Verdict
- UNDERPRICED
- Comps
- 15 within 1.0 mi
Show comp detail 4 sales within ~0.75 mi
| Address | Dist | Beds/Ba | Sqft | Sold | Price | $/sf | Match |
|---|---|---|---|---|---|---|---|
| 2063 Knight Rd | 0.04mi | 2/1.0 (-1) | 1,460 (-5%) | 4mo | $220,000 | $151 | 82 |
| 2045 Walton Rd | 0.20mi | 3/1.0 | 1,306 (-15%) | 7mo | $155,000 | $119 | 60 |
| 1026 Dale Rd | 0.36mi | 4/1.5 (+1) | 1,700 (+11%) | 8mo | $311,000 | $183 | 52 |
| 2011 Riverview Dr | 0.57mi | 4/2.0 (+1) | 1,685 (+10%) | 3mo | $282,000 | $167 | 45 |
Match score weights: distance 35% · size 25% · config 20% · recency 20%. Top-matched comps best support the ARV.
Projected returns pro-forma
-3.0% appreciation · 3.0% rent growth · sell at horizon
- IRR
- -10.2%
- Equity multiple
- 0.63×
- Total profit
- $-19,777
- Equity at exit
- $28,330
- IRR
- -0.8%
- Equity multiple
- 0.94×
- Total profit
- $-3,059
- Equity at exit
- $16,428
Cash invested: $53,200 (down + closing). Projections, not guarantees.
Landlord ↔ Tenant lean methodology
- Overall (STATE)
- 62 Landlord-Friendly
- State Pennsylvania
- 62 Landlord-Friendly · EVEN
- County
- — inherits STATE
- City
- — inherits STATE
ZIP-level market 15332
- Home prices YoY
- -10.7%
- Active inventory
- 53
- Price-to-rent
- 8.7×
Monthly cashflow live
- Estimated rent
- $1,813 medium interval (Pro) →
- Mortgage (P&I)
- −$996
- Tax from tax record
- −$117 /mo · $1,407/yr
- Insurance
- −$79
- Flood insurance flood zone
- −$66 /mo · $798/yr
- HOA
- −$0
- Vacancy / Maint / Mgmt
- −$381
- Net cashflow
- $173
Break-even live
Sensitivity live
| Price | -10% $281 | -5% $227 | +0% $173 | +5% $119 | +10% $65 |
|---|---|---|---|---|---|
| Rent | -10% $30 | -5% $101 | +0% $173 | +5% $245 | +10% $316 |
| Rate | -1.0pp $269 | -0.5pp $221 | base $173 | +0.5pp $124 | +1.0pp $74 |
UW: 25.0% down · 7.5% · 30yr · 1.5% tax · 5.0% vac · 8.0% maint · 8.0% mgmt
Financing live
Cash to close
- Down payment
- $47,500
- Closing costs
- $5,700
- Reserves months
- —
- Total cash needed
- —
Loan-product check · same deal, 3 products live
Conventional
25% down · 7.5% · 30yr
- Down + closing
- —
- Monthly P&I
- —
- Monthly cashflow
- —
- DSCR
- —
- Eligible?
- —
Personal DTI + credit; lowest rate.
DSCR
20% down · 8.5% · 30yr
- Down + closing
- —
- Monthly P&I
- —
- Monthly cashflow
- —
- DSCR
- —
- Eligible?
- —
No personal income docs; deal must DSCR.
Hard money
10% down · 12.0% · 12mo
- Down + closing
- —
- Monthly P&I
- —
- Monthly cashflow
- —
- DSCR
- —
- Eligible?
- —
Short-term bridge; refi at stabilization.
Listing history 22 events
-
2026-06-21days on market $190,000 Active 118 DOM
-
2026-06-18price $190,000 Active 115 DOM
-
2026-06-18days on market $200,000 Active 115 DOM
-
2026-06-17days on market $200,000 Active 114 DOM
-
2026-06-16days on market $200,000 Active 113 DOM
-
2026-06-15days on market $200,000 Active 112 DOM
-
2026-06-13days on market $200,000 Active 110 DOM
-
2026-06-13days on market $200,000 Active 109 DOM
-
2026-06-09days on market $200,000 Active 106 DOM
-
2026-06-08days on market $200,000 Active 105 DOM
-
2026-06-07days on market $200,000 Active 104 DOM
-
2026-06-05days on market $200,000 Active 101 DOM
-
2026-06-03days on market $200,000 Active 100 DOM
-
2026-06-02days on market $200,000 Active 99 DOM
-
2026-06-01days on market $200,000 Active 98 DOM
-
2026-05-31days on market $200,000 Active 97 DOM
-
2026-02-23$200,000 Active 397-char remark
Show marketing remark (397 chars)
Beautifully updated two story 3 bedroom, 1 bath home featuring a brand new full bath, new flooring, and thoughtful upgrades throughout. The renovated kitchen showcases brand new stainless steel appliances, creating a bright, refreshed space that’s truly move-in ready. Enjoy the perfect blend of rural charm and everyday convenience, just minutes from shopping, schools, and local hospitals.
-
2025-12-31soldstatus $54,161
-
2010-01-28price $9,900 232-char remark
Show marketing remark (232 chars)
Corporate owned, sold as is. Please visit www. PriorityRealty.net for offer instructions and addendums. Listing office holds hand money. Hand money must be certified funds. Taxes and lot size are estimated. No utilities- take light.
-
2010-01-13soldstatus $14,000 232-char remark
Show marketing remark (232 chars)
Corporate owned, sold as is. Please visit www. PriorityRealty.net for offer instructions and addendums. Listing office holds hand money. Hand money must be certified funds. Taxes and lot size are estimated. No utilities- take light.
-
2009-11-20$14,000 232-char remark
Show marketing remark (232 chars)
Corporate owned, sold as is. Please visit www. PriorityRealty.net for offer instructions and addendums. Listing office holds hand money. Hand money must be certified funds. Taxes and lot size are estimated. No utilities- take light.
-
1993-09-07soldstatus $28,000
ⓘ Source: listings_history table (triggers on properties + properties_extension) + one-shot
backfill from property_details.listing_events for pre-trigger history.
Tax reassessment forecast PA · Partial reset (capped growth)
- Current annual tax
- $1,407 · $117/mo
- Projected year-2 tax
- $2,205 · $184/mo
- Expected delta
- +$797/yr (+$66/mo · 56.6%)
ⓘ Screening estimate from a state-policy table — verify with the county assessor before closing.
Climate risk First Street
- Flood 10/10 Extreme FEMA zone X (unshaded) · 99% chance over 30 yrs
- Wildfire 1/10 Low
- Heat 3/10 Moderate 7 d/yr ≥97°F today · 18 d/yr by 30 yrs out
- Wind 2/10 Low
- Air quality 5/10 Major 8 unhealthy d/yr today · 8 by 30 yrs out
Nearby sold comps map
Loading sold comps map…
Walkable amenities ~0.75 mi
Loading nearby amenities…
Taxation est. · year 1
- Rental income
- $21,756
- − Mortgage interest
- −$10,643
- − Property taxes
- −$1,407
- − Insurance
- −$1,748
- − Repairs & maintenance
- −$1,740
- − Management
- −$1,740
- − Depreciation
- −$5,527
- Taxable loss
- −$1,050
- Est. tax savings @ 24.0%
- +$252
- After-tax cash flow
- $2,328/yr
For passive investors: Depreciation is non-cash, so a rental often shows a tax loss while cash-flowing — sheltering income. Rental losses are passive: they offset passive income freely, and up to $25,000/yr can offset ordinary (W-2) income if you actively participate and your MAGI is under $100k (phasing out to $0 by $150k); unused losses carry forward. On sale, claimed depreciation is recaptured at up to 25%, and gains may owe capital-gains tax (a 1031 exchange can defer both). Figures are a year-1 estimate at your 24.0% rate — not tax advice; consult a CPA.
Schools (NCES district)
- District
- West Jefferson Hills SD
- NCES district ID
- 4225590
- Math proficiency
- 48% ▼ -13.00%
- Reading proficiency
- 73% ▼ -10.00%
- Median HH income
- $68,796
- Composite
- 53.19/100
- National rank
- #1503
- State rank
- #60 of 539 in PA
Livability — Jefferson Hills
- Score
- 76/100
- State rank
- #397
- US rank
- #3607
Category grades
Schools grade is shown separately in the Schools card above.
Census & demographics
- Census place
- Jefferson Hills, PA
- County
- Washington County · 106,469 people
- City population
- 16,659
- Metro
- Pittsburgh, PA
- Population (ZIP)
- 7,678
- Household income
- $66,578
- Rent vs Own
- Severe rent burden
- 145.0
Population outlook (Allegheny County) Hauer SSP2
- Today (2025)
- 1,250,282 people
- By 2030
- 1,256,482 · +0.5%
- By 2040
- 1,256,318 · +0.5%
- By 2050
- 1,244,169 · -0.5%
- By 2075
- 1,197,693 · -4.2%
- By 2100
- 1,093,187 · -12.6%
Race, ethnicity, and origin ACS 2023
- Neighborhood character
- Predominantly White (94%)
- Race & ethnicity
- White 94% Two or more races 3% Hispanic / Latino 3%
- Common ancestry
- Romanian 11% Serbian 2% Iranian 1%
- Foreign-born
- 2% · Canada
- Languages at home
- 98% English-only · Spanish 2%
Political lean MEDSL · Allegheny
- 2024 margin
- Strong D (+20.3) · D 59.7% · R 39.4%
- 2008→2024 swing
- +4.8pp toward D · 2008: 15.5pp · 2024: 20.3pp
- All cycles
- 2024: D+20.3 2020: D+20.4 2016: D+16.4 2012: D+14.4 2008: D+15.5
Not yet ingested
- Civics
- —
Market trends
- HPI YoY
- ▼ -28.78%
- Current HPI
- 239.7401
- Rent YoY
- —
- Metro
- Pittsburgh, PA
- State GDP YoY
- ▲ 1.68%
- F500 in state
- 34
Industry mix (Fortune 500 HQ in PA)
| Industry | F500 HQs | Revenue |
|---|---|---|
| Healthcare | 2 | $309B |
|
||
| Insurance | 2 | $27B |
|
||
| Telecommunications / Media | 1 | $124B |
|
||
| Industrial Distribution | 1 | $22B |
|
||
| Financial Services | 1 | $20B |
|
||
| Chemicals / Materials | 1 | $18B |
|
||
Price history
+614.3% since first listed6 events — show timeline
- 2026-02-23 Listed $200,000 West Penn MLS
- 2025-12-31 Sold (Public Records) $54,161 Public Records
- 2010-01-28 Price Changed $9,900 West Penn MLS
- 2010-01-13 Sold (MLS) $14,000 West Penn MLS
- 2009-11-20 Listed $14,000 West Penn MLS
- 1993-09-07 Sold (Public Records) $28,000 Public Records
Property tax history
+2.3%/yrLatest (2026): $1,407 · +3.5% YoY. Source: county tax records.
Cash-flow waterfall
monthlySold comps — $/sqft
last 12 mo · ≤1 miLoading sold comps…