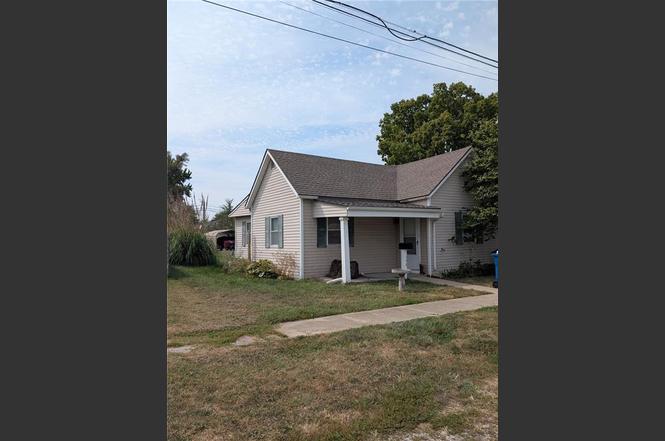
308 W Dryden St · Odessa, MO
Flood risk 1/10 · Minimal
- FEMA flood zone
- X (unshaded)
- Chance of flooding over 30 yrs
- 0.0%
- Est. flood insurance / yr
- $507 – $1,088
Fire risk 3/10 · Minor
- Est. fire insurance / yr
- $1,054 – $1,958
Heat risk 4/10 · Minor
- Hot days now (above 107°F)
- 7 days/yr
- Hot days in 30 yrs
- 16 days/yr
Wind risk 2/10 · Minimal
- Chance of severe wind over 30 yrs
- —
Air-quality risk 2/10 · Minimal
- Unhealthy air days now
- 0 days/yr
- Unhealthy air days in 30 yrs
- 1 days/yr
Risk factors via First Street. Map © Google.
Why this score? — see what drove the B grade
The composite is a weighted blend of 9 inputs, each scored 0–100. Each bar is that input's sub-score; the figure is the points it added to the 100-point composite (weight × sub-score).
- Cash flow +27.3/30.0
- ARV discount +15.0/15.0
- DSCR +9.5/10.0
- 1% rule +6.4/10.0
- Schools +3.5/10.0
- Livability +3.5/5.0
- Rent growth +2.5/5.0
- Condition / age +2.5/5.0
- Appreciation +0.0/10.0
$130,000
🖨 Deal sheet 📄 Offer letter ✓ Due diligence
Listing remarks MLS
Stop by and see this beautiful and meticulously maintained ranch home. Enjoy your coffee on the secluded back patio or in your oversized eat-in kitchen. This 2 bedroom, 1 bath home features one-level living with laundry and bedrooms located on the same level. With an open concept, the unique design of this home will be sure to meet the needs of many potential home buyers.
Key facts
- 8,015 sq ft lot
- Built 1910
- Listed 277 days
Property features AI
Finance
- Financial info: Annual tax amount reported as $604
Exterior
- Parking: Other parking
- Utilities: Public water
- Home design: Single-family residence; One-story; Residential property
- Construction: Frame construction with vinyl siding; Composition roof; Approximately 101+ years old
- Exterior features: Lot approximately 8,015 square feet; Located in an unknown flood plain status
Interior
- Bedrooms: 2 bedrooms
- Bathrooms: 1 full bathroom
- Heating & cooling: Forced air heating; Electric cooling
- Interior features: Crawl space basement; Ranch floor plan
Neighborhood map
What this means for you Summary
Snapshot
- This is a 2-bed/1.0-bath single-family listed at $130k.
Deal economics
- At list price, monthly cash flow is $378 ($5k/yr) — positive.
- The deal already cash-flows at list — no discount required.
- Meets the 1% rule at list price ($1k rent vs $130k).
- Recommended offer: $114k (12.0% below list) — sets the bar for market timing.
- Cap rate 9.8% vs local median 3.8% in Odessa — top-decile yield for the area; either an underpriced asset or a hidden risk that comps aren't pricing in. Stress-test before assuming the spread holds.
Location & tenants
- Location reads 69/100 on livability (#144 in MO) — a middle-class / working-renter tenant base. Strengths: crime A+, cost of living A+, housing A+; Watch: amenities F, commute F, health & safety F.
- Odessa R-VII (town): math 34% / reading 48% proficiency, ranked #123 of 324 in MO (top 38%) — families likely to look elsewhere, expect single-tenant / working-renter base with shorter leases.
- Zoned schools: Mcquerry Elementary (461 students, 39% FRL); Odessa High (math 8% / reading 62%, grade F, #318 of 521 statewide, top 61%, 664 students, 25% FRL) — zoned schools at 32% FRL track the district average.
- Market conditions: 146 active listings in the ZIP; 13 comparable units currently listed for rent nearby; rentals at typical pace (median 24d on market — plan ~3-4 weeks tenant-placement turnaround); 112 units permitted in Lafayette County in 2024 (0 in 5+ unit buildings).
Forward outlook
- Local home prices are declining (-3.0%/yr); year-one equity from $899 of loan paydown is wiped out by about $4k of value loss. Plan a longer hold.
- Lafayette County population projected at -21% by 2050 — secular population decline; favor cash flow + early exit over multi-decade hold.
- At projected returns (-3.0% appreciation + 3.0% rent growth), your $36k cash investment doubles in ~10 years — after that, you're playing with house money.
Negotiation context
- It's been on market 278 days — a 12% lower offer ($114k) is reasonable based on typical stale-listing flexibility.
- 7 sale attempts since 19y ago; this cycle's ask has dropped $10k (7%) from the opening price — seller is motivated, your offer sets the floor, not the list.
Risks & watch-outs
- Watch-outs: built in 1910 — expect roof / HVAC / electrical / plumbing capex.
Questions for the listing agent
- It's been on market 278 days. Have you received any prior offers? Is the seller open to a 12% concession, seller financing, or rate buy-down credit?
- Built in 1910 — when were the roof, HVAC, electrical panel, plumbing, and water heater last replaced?
- Why hasn't it sold? Are there any deal-killer items the seller is aware of (foundation, flood, title, zoning, code violations)?
- Is there a deadline driving the sale (1031 exchange, divorce, estate, relocation)? That informs how much negotiation room exists.
- Schools are D-rated, which usually means shorter tenancies and higher turnover. Who's the typical renter profile here, and what's been the actual vacancy rate?
- What's the average days-on-market for RENTAL listings here right now (not sales)? A rising rental-DOM trend means longer vacancies and softer asking-rent achievability than the comps imply.
- What's the recent tenant-quality profile in this submarket — average credit score on applications, eviction rate, late-payment / NSF rate, and stable-employment percentage? A property-management company in the area should have these aggregated.
- How much new for-sale + rental construction is in the pipeline within 1–3 miles? Heavy new supply typically softens prices + rents 12–24 months out; constrained supply supports both.
Investment metrics
- 1% rule
- 1.14% ✓
- Cap rate
- 9.78%
- Cash-on-cash
- 12.45%
- DSCR
- 1.55
- GRM
- 7.3
CMA / ARV
- ARV (on-the-fly)
- $229,270
- Comps found
- 12
Show comp detail 12 sales within ~0.75 mi
| Address | Dist | Beds/Ba | Sqft | Sold | Price | $/sf | Match |
|---|---|---|---|---|---|---|---|
| 307 E Orchard St | 0.44mi | 2/1.0 | 1,036 (-9%) | 0mo | $230,000 | $222 | 64 |
| 203 E Main St | 0.40mi | 3/1.0 (+1) | 1,216 (+7%) | 4mo | $145,000 | $119 | 61 |
| 203 N Connor St | 0.46mi | 3/1.0 (+1) | 1,100 (-3%) | 10mo | $170,000 | $155 | 60 |
| 335 E Mason Street St | 0.59mi | 3/1.0 (+1) | 1,064 (-6%) | 5mo | $174,900 | $164 | 53 |
| 603 S 2nd St | 0.48mi | 3/2.0 (+1) | 1,200 (+6%) | 9mo | $274,000 | $228 | 52 |
| 309 S Johnson Dr | 0.72mi | 2/1.0 | 1,086 (-4%) | 11mo | $219,500 | $202 | 50 |
| 604 S Crews Ave | 0.68mi | 3/2.0 (+1) | 1,132 (-0%) | 10mo | $260,000 | $230 | 50 |
| 210 W Crestview Dr | 0.71mi | 2/1.0 | 1,224 (+8%) | 7mo | $219,900 | $180 | 48 |
| 204 E Chestnut St | 0.45mi | 3/1.0 (+1) | 1,284 (+13%) | 10mo | $259,900 | $202 | 44 |
| 320 E Dryden St | 0.52mi | 3/2.0 (+1) | 1,030 (-9%) | 10mo | $184,900 | $180 | 43 |
| 807 W Pleasant St | 0.44mi | 3/2.0 (+1) | 1,292 (+14%) | 8mo | $295,000 | $228 | 41 |
| 325 E Mason St | 0.51mi | 3/2.0 (+1) | 1,280 (+13%) | 12mo | $215,000 | $168 | 36 |
Match score weights: distance 35% · size 25% · config 20% · recency 20%. Top-matched comps best support the ARV.
Projected returns pro-forma
-3.0% appreciation · 3.0% rent growth · sell at horizon
- IRR
- 2.1%
- Equity multiple
- 1.08×
- Total profit
- $2,943
- Equity at exit
- $19,383
- IRR
- 11.7%
- Equity multiple
- 1.92×
- Total profit
- $33,359
- Equity at exit
- $11,240
Cash invested: $36,400 (down + closing). Projections, not guarantees.
Landlord ↔ Tenant lean methodology
- Overall (STATE)
- 81 Strongly Landlord-Friendly
- State Missouri
- 81 Strongly Landlord-Friendly · R+10
- County
- — inherits STATE
- City
- — inherits STATE
ZIP-level market 64076
- Home prices YoY
- -18.0%
- Active inventory
- 146
- Price-to-rent
- 7.3×
Monthly cashflow live
- Estimated rent
- $1,481 high interval (Pro) →
- Mortgage (P&I)
- −$682
- Tax from tax record
- −$56 /mo · $674/yr
- Insurance
- −$54
- HOA
- −$0
- Vacancy / Maint / Mgmt
- −$311
- Net cashflow
- $378
Break-even live
UW: 25.0% down · 7.5% · 30yr · 1.5% tax · 5.0% vac · 8.0% maint · 8.0% mgmt
Financing live
Cash to close
- Down payment
- $32,500
- Closing costs
- $3,900
- Reserves months
- —
- Total cash needed
- —
Loan-product check · same deal, 3 products live
Conventional
25% down · 7.5% · 30yr
- Down + closing
- —
- Monthly P&I
- —
- Monthly cashflow
- —
- DSCR
- —
- Eligible?
- —
Personal DTI + credit; lowest rate.
DSCR
20% down · 8.5% · 30yr
- Down + closing
- —
- Monthly P&I
- —
- Monthly cashflow
- —
- DSCR
- —
- Eligible?
- —
No personal income docs; deal must DSCR.
Hard money
10% down · 12.0% · 12mo
- Down + closing
- —
- Monthly P&I
- —
- Monthly cashflow
- —
- DSCR
- —
- Eligible?
- —
Short-term bridge; refi at stabilization.
Rent comps 13 comps
| Address | Beds | Baths | Sqft | Rent | $/sqft | DOM | Units | Dist |
|---|---|---|---|---|---|---|---|---|
| 214 W Orchard St Unit 2 Odessa, MO | 2.0 | 1.0 | 916 | $800 | $0.87 | 20d | 1 | 0.18mi |
| 604 W Mason St Odessa, MO | 3.0 | 2.5 | 1435 | $1,595 | $1.11 | 23d | 1 | 0.18mi |
| 601 W Mason St Odessa, MO | 3.0 | 2.5 | 1435 | $1,595 | $1.11 | 23d | 1 | 0.20mi |
| 603 W Mason St Odessa, MO | 3.0 | 2.5 | 1435 | $1,595 | $1.11 | 2d | 1 | 0.20mi |
| 603 W Mason St Odessa, MO | 3.0 | 2.5 | 1435 | $1,595 | $1.11 | 19d | 1 | 0.20mi |
| 605 W Mason St Odessa, MO | 3.0 | 2.5 | 1435 | $1,595 | $1.11 | 23d | 1 | 0.20mi |
| 501 S Johnson Dr Odessa, MO | 3.0 | 2.5 | 1435 | $1,595 | $1.11 | 1d | 1 | 0.72mi |
| 411 E Benning St Odessa, MO | 3.0 | 2.5 | 1435 | $1,595 | $1.11 | 43d | 1 | 0.79mi |
| 511 Pine Dr Clay Township, MO | 3.0 | 2.5 | 1435 | $1,595 | $1.11 | 14d | 1 | 0.83mi |
| 511 Pine Dr Clay Township, MO | 3.0 | 2.5 | 1435 | $1,595 | $1.11 | 23d | 1 | 0.83mi |
| 511 Pine Dr Clay Township, MO | 3.0 | 2.5 | 1435 | $1,595 | $1.11 | 4d | 1 | 0.83mi |
| 510 Pine Dr Clay Township, MO | 3.0 | 2.5 | 1435 | $1,595 | $1.11 | 23d | 1 | 0.83mi |
| 508 Pine Dr Clay Township, MO | 3.0 | 2.5 | 1435 | $1,595 | $1.11 | 43d | 1 | 0.83mi |
Listing history 40 events
-
2026-06-19days on market $130,000 Active 278 DOM
-
2026-06-18days on market $130,000 Active 277 DOM
-
2026-06-17days on market $130,000 Active 276 DOM
-
2026-06-16days on market $130,000 Active 275 DOM
-
2026-06-15days on market $130,000 Active 274 DOM
-
2026-06-14days on market $130,000 Active 272 DOM
-
2026-06-12days on market $130,000 Active 271 DOM
-
2026-06-09days on market $130,000 Active 268 DOM
-
2026-06-09status $130,000 Active 267 DOM
-
2026-06-08days on market $130,000 Active Under Contract 267 DOM
-
2026-06-07days on market $130,000 Active Under Contract 266 DOM
-
2026-06-05days on market $130,000 Active Under Contract 263 DOM
-
2026-06-03days on market $130,000 Active Under Contract 262 DOM
-
2026-06-02days on market $130,000 Active Under Contract 261 DOM
-
2026-06-01days on market $130,000 Active Under Contract 260 DOM
-
2026-05-31days on market $130,000 Active Under Contract 259 DOM
-
2026-05-30days on market $130,000 Active Under Contract 258 DOM
-
2026-01-13historical Active Under Contract
-
2025-11-14price $130,000
-
2025-09-15$140,000 Active
-
2025-09-12historical $140,000
-
2022-12-08soldstatus
-
2022-12-06soldstatus Closed 374-char remark
Show marketing remark (374 chars)
Stop by and see this beautiful and meticulously maintained ranch home. Enjoy your coffee on the secluded back patio or in your oversized eat-in kitchen. This 2 bedroom, 1 bath home features one-level living with laundry and bedrooms located on the same level. With an open concept, the unique design of this home will be sure to meet the needs of many potential home buyers.
-
2022-11-06status Pending 374-char remark
Show marketing remark (374 chars)
Stop by and see this beautiful and meticulously maintained ranch home. Enjoy your coffee on the secluded back patio or in your oversized eat-in kitchen. This 2 bedroom, 1 bath home features one-level living with laundry and bedrooms located on the same level. With an open concept, the unique design of this home will be sure to meet the needs of many potential home buyers.
-
2022-11-04status Active 374-char remark
Show marketing remark (374 chars)
Stop by and see this beautiful and meticulously maintained ranch home. Enjoy your coffee on the secluded back patio or in your oversized eat-in kitchen. This 2 bedroom, 1 bath home features one-level living with laundry and bedrooms located on the same level. With an open concept, the unique design of this home will be sure to meet the needs of many potential home buyers.
-
2022-11-02status Pending 374-char remark
Show marketing remark (374 chars)
Stop by and see this beautiful and meticulously maintained ranch home. Enjoy your coffee on the secluded back patio or in your oversized eat-in kitchen. This 2 bedroom, 1 bath home features one-level living with laundry and bedrooms located on the same level. With an open concept, the unique design of this home will be sure to meet the needs of many potential home buyers.
-
2022-10-27$140,000 Active 374-char remark
Show marketing remark (374 chars)
Stop by and see this beautiful and meticulously maintained ranch home. Enjoy your coffee on the secluded back patio or in your oversized eat-in kitchen. This 2 bedroom, 1 bath home features one-level living with laundry and bedrooms located on the same level. With an open concept, the unique design of this home will be sure to meet the needs of many potential home buyers.
-
2019-05-09soldstatus
-
2013-04-15soldstatus 498-char remark
Show marketing remark (498 chars)
This charming home with updated kitchen and bath is just waiting to be loved. See it today and make it your own. With two bedrooms and one bath situated on a nice lot. Bank of America Prequalification required on all offers. Please allow 2-3 business days for seller response. Property is being Sold AS-IS Bank of America, N. A. employees and employees’ household members and HTS business partners of the Bank, are prohibited from purchasing this property, whether directly or indirectly.
-
2013-02-06$24,900 498-char remark
Show marketing remark (498 chars)
This charming home with updated kitchen and bath is just waiting to be loved. See it today and make it your own. With two bedrooms and one bath situated on a nice lot. Bank of America Prequalification required on all offers. Please allow 2-3 business days for seller response. Property is being Sold AS-IS Bank of America, N. A. employees and employees’ household members and HTS business partners of the Bank, are prohibited from purchasing this property, whether directly or indirectly.
-
2010-02-28historical
-
2009-12-07$79,500
-
2009-11-12historical
-
2009-05-12$84,900
-
2007-11-21soldstatus
-
2007-11-20soldstatus
-
2007-10-01$79,900
-
2004-07-30soldstatus
-
2004-06-01soldstatus
-
2001-01-23soldstatus
ⓘ Source: listings_history table (triggers on properties + properties_extension) + one-shot
backfill from property_details.listing_events for pre-trigger history.
Tax reassessment forecast MO · Resets to sale price
- Current annual tax
- $674 · $56/mo
- Projected year-2 tax
- $1,261 · $105/mo
- Expected delta
- +$587/yr (+$49/mo · 87.1%)
ⓘ Screening estimate from a state-policy table — verify with the county assessor before closing.
Climate risk First Street
- Flood 1/10 Low FEMA zone X (unshaded) · 0% chance over 30 yrs
- Wildfire 3/10 Moderate
- Heat 4/10 Moderate 7 d/yr ≥107°F today · 16 d/yr by 30 yrs out
- Wind 2/10 Low
- Air quality 2/10 Low 0 unhealthy d/yr today · 1 by 30 yrs out
Nearby sold comps map
Loading sold comps map…
Walkable amenities ~0.75 mi
Loading nearby amenities…
Taxation est. · year 1
- Rental income
- $17,768
- − Mortgage interest
- −$7,282
- − Property taxes
- −$674
- − Insurance
- −$650
- − Repairs & maintenance
- −$1,421
- − Management
- −$1,421
- − Depreciation
- −$3,782
- Taxable income
- $2,537
- Est. tax owed @ 24.0%
- −$609
- After-tax cash flow
- $3,923/yr
For passive investors: Depreciation is non-cash, so a rental often shows a tax loss while cash-flowing — sheltering income. Rental losses are passive: they offset passive income freely, and up to $25,000/yr can offset ordinary (W-2) income if you actively participate and your MAGI is under $100k (phasing out to $0 by $150k); unused losses carry forward. On sale, claimed depreciation is recaptured at up to 25%, and gains may owe capital-gains tax (a 1031 exchange can defer both). Figures are a year-1 estimate at your 24.0% rate — not tax advice; consult a CPA.
Schools (NCES district)
- District
- Odessa R-VII
- NCES district ID
- 2923100
- Math proficiency
- 34% ▼ -9.00%
- Reading proficiency
- 48% ▼ -1.00%
- Median HH income
- $51,736
- Composite
- 35.44/100
- National rank
- #4932
- State rank
- #123 of 324 in MO
Livability — Odessa
- Score
- 69/100
- State rank
- #144
- US rank
- #8250
Category grades
Schools grade is shown separately in the Schools card above.
Census & demographics
- Census place
- Odessa, MO
- Population (ZIP)
- 9,236
Population outlook (Lafayette County) Hauer SSP2
- Today (2025)
- 31,118 people
- By 2030
- 29,993 · -3.6%
- By 2040
- 27,436 · -11.8%
- By 2050
- 24,585 · -21.0%
- By 2075
- 18,426 · -40.8%
- By 2100
- 12,897 · -58.6%
Race, ethnicity, and origin ACS 2023
- Neighborhood character
- Predominantly White (95%)
- Race & ethnicity
- White 95% Two or more races 4%
- Common ancestry
- Slovak 4% Danish 2% Italian 1%
- Foreign-born
- 1% · Canada
- Languages at home
- 97% English-only · German/W. Germanic 1% Spanish 1%
Political lean MEDSL · Lafayette
- 2024 margin
- Solid R (+48.9) · D 24.9% · R 73.8% · Other 1.3%
- 2008→2024 swing
- -33.6pp toward R · 2008: -15.3pp · 2024: -48.9pp
- All cycles
- 2024: R+48.9 2020: R+45.7 2016: R+43.8 2012: R+26.3 2008: R+15.3
Not yet ingested
- Civics
- —
Market trends
- HPI YoY
- ▼ -56.23%
- Current HPI
- 255.8581
- Rent YoY
- —
- Metro
- —
- State GDP YoY
- ▲ 1.84%
- F500 in state
- 20
Industry mix (Fortune 500 HQ in MO)
| Industry | F500 HQs | Revenue |
|---|---|---|
| Healthcare | 1 | $163B |
|
||
| Insurance | 1 | $21B |
|
||
| Industrial Technology | 1 | $17B |
|
||
| Retail | 1 | $16B |
|
||
| Industrial Distribution | 1 | $10B |
|
||
| Utilities | 1 | $9B |
|
||
Price history
+62.7% since first listed23 events — show timeline
- 2026-01-13 Contingent — Heartland MLS as Distributed by MLS Grid
- 2025-11-14 Price Changed $130,000 Heartland MLS as Distributed by MLS Grid
- 2025-09-15 Listed $140,000 Heartland MLS as Distributed by MLS Grid
- 2025-09-12 Coming Soon $140,000 Heartland MLS as Distributed by MLS Grid
- 2022-12-08 Sold (Public Records) — Public Records
- 2022-12-06 Sold (MLS) — Heartland MLS as Distributed by MLS Grid
- 2022-11-06 Pending — Heartland MLS as Distributed by MLS Grid
- 2022-11-04 Relisted — Heartland MLS as Distributed by MLS Grid
- 2022-11-02 Pending — Heartland MLS as Distributed by MLS Grid
- 2022-10-27 Listed $140,000 Heartland MLS as Distributed by MLS Grid
- 2019-05-09 Sold (Public Records) — Public Records
- 2013-04-15 Sold (MLS) — Heartland MLS as Distributed by MLS Grid
- 2013-02-06 Listed $24,900 Heartland MLS as Distributed by MLS Grid
- 2010-02-28 Listing Removed — Heartland MLS as Distributed by MLS Grid
- 2009-12-07 Listed $79,500 Heartland MLS as Distributed by MLS Grid
- 2009-11-12 Listing Removed — Heartland MLS as Distributed by MLS Grid
- 2009-05-12 Listed $84,900 Heartland MLS as Distributed by MLS Grid
- 2007-11-21 Sold (MLS) — Heartland MLS as Distributed by MLS Grid
- 2007-11-20 Sold (Public Records) — Public Records
- 2007-10-01 Listed $79,900 Heartland MLS as Distributed by MLS Grid
- 2004-07-30 Sold (Public Records) — Public Records
- 2004-06-01 Sold (Public Records) — Public Records
- 2001-01-23 Sold (Public Records) — Public Records
Property tax history
+2.5%/yrLatest (2025): $674 · +11.5% YoY. Source: county tax records.
Cash-flow waterfall
monthlySold comps — $/sqft
last 12 mo · ≤1 miLoading sold comps…