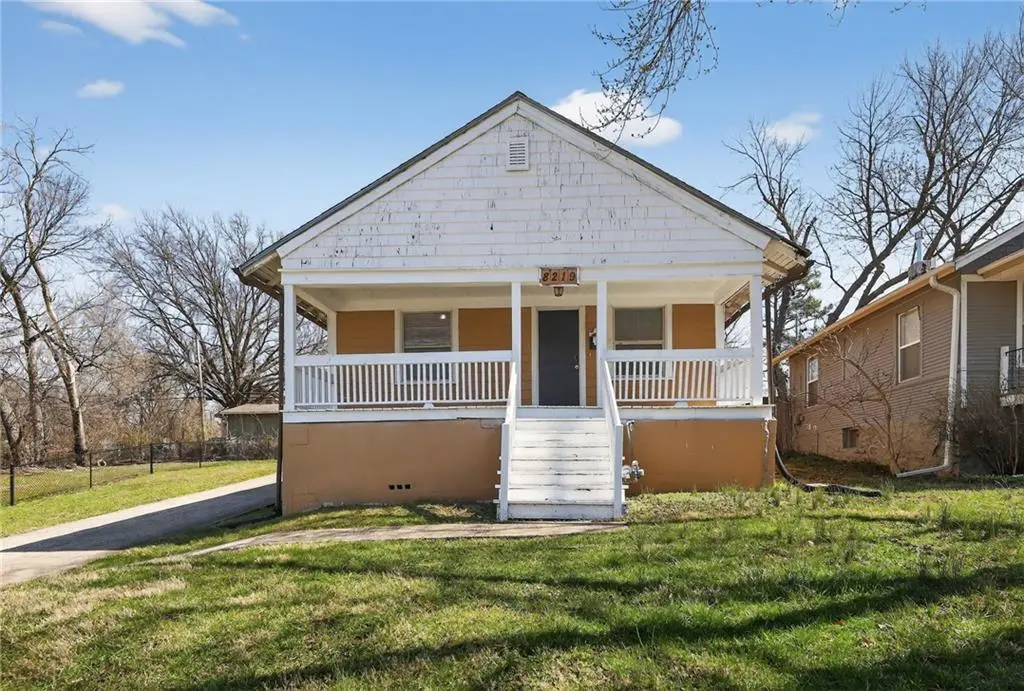
8219 Wayne Ave · Kansas City, MO
Flood risk 1/10 · Minimal
- FEMA flood zone
- X (unshaded)
- Chance of flooding over 30 yrs
- 0.0%
- Est. flood insurance / yr
- $473 – $860
Fire risk 1/10 · Minimal
- Est. fire insurance / yr
- $1,054 – $1,958
Heat risk 4/10 · Minor
- Hot days now (above 107°F)
- 7 days/yr
- Hot days in 30 yrs
- 17 days/yr
Wind risk 2/10 · Minimal
- Chance of severe wind over 30 yrs
- —
Air-quality risk 3/10 · Minor
- Unhealthy air days now
- 2 days/yr
- Unhealthy air days in 30 yrs
- 4 days/yr
Risk factors via First Street. Map © Google.
Why this score? — see what drove the C grade
The composite is a weighted blend of 9 inputs, each scored 0–100. Each bar is that input's sub-score; the figure is the points it added to the 100-point composite (weight × sub-score).
- Cash flow +25.6/30.0
- DSCR +8.5/10.0
- ARV discount +8.0/15.0
- 1% rule +5.7/10.0
- Livability +3.9/5.0
- Rent growth +3.5/5.0
- Condition / age +2.5/5.0
- Schools +1.8/10.0
- Appreciation +0.0/10.0
$124,900
🖨 Deal sheet (PDF) 📄 Offer letter ✓ Due diligence
Listing remarks MLS
Instant Equity Opportunity in Marlborough Highlands! Calling all investors and DIY enthusiasts this charming 3-bedroom, 2-bathroom bungalow is the project you’ve been waiting for. Perfectly situated on an expansive 0.31-acre level lot, this property offers rare outdoor space and significant upside in a rapidly developing area of South Kansas City.
Key facts
- Expansive level lot
- Rare outdoor space
- 0.31 acre lot
Tags
Neighborhood map
What this means for you Summary
Snapshot
- This is a 3-bed/1.0-bath single-family listed at $125k.
Deal economics
- At list price, monthly cash flow is $296 ($4k/yr) — positive.
- The deal already cash-flows at list — no discount required.
- Meets the 1% rule at list price ($1k rent vs $125k).
- Recommended offer: $121k (3.0% below list) — sets the bar for market timing.
- Cap rate 9.1% vs local median 3.9% in Kansas City — top-decile yield for the area; either an underpriced asset or a hidden risk that comps aren't pricing in. Stress-test before assuming the spread holds.
Location & tenants
- Location reads 78/100 on livability (#28 in MO, #2,671 nationally) — a middle-class / working-renter tenant base. Strengths: amenities A+, commute A+, cost of living A+; Watch: crime F.
- Center 58 (urban): math 12% / reading 29% proficiency, ranked #301 of 324 in MO (top 93%) — low school quality limits family demand, transient renter base, plan for 1-2y turnover; 63% free/reduced lunch — lower-income household profile, screen leases tightly.
- Zoned schools: Center Elem. (math 8% / reading 22%, grade F, #982 of 1,115 statewide, top 89%, 347 students, 99% FRL); Center Middle (math 7% / reading 28%, grade F, #350 of 391 statewide, top 90%, 560 students, 66% FRL); Center Sr. High (math 5% / reading 37%, grade F, #468 of 521 statewide, top 90%, 742 students, 62% FRL).
- Market conditions: Rents rising (+4.0%/yr); 133 active listings in the ZIP; 24 comparable units currently listed for rent nearby; rentals at typical pace (median 18d on market — plan ~3-4 weeks tenant-placement turnaround); 4,002 units permitted in Jackson County in 2024 (2,271 in 5+ unit buildings).
Forward outlook
- Local home prices are declining (-3.0%/yr); year-one equity from $864 of loan paydown is wiped out by about $4k of value loss. Plan a longer hold.
- Jackson County population projected at +4% by 2050 — modest demand growth; plan on rents tracking national, not racing it.
- At projected returns (-3.0% appreciation + 4.0% rent growth), your $35k cash investment doubles in ~10 years — after that, you're playing with house money.
Negotiation context
- It's been on market 57 days — a 3% lower offer ($121k) is reasonable based on typical stale-listing flexibility.
- 3 sale attempts since 15y ago with the ask held roughly flat each time — persistent listings suggest the price (not the market) is what's stuck; bring a comps-based counter.
Risks & watch-outs
- Watch-outs: built in 1930 — expect roof / HVAC / electrical / plumbing capex.
Questions for the listing agent
- It's been on market 57 days. Have you received any prior offers? Is the seller open to a 3% concession, seller financing, or rate buy-down credit?
- Built in 1930 — when were the roof, HVAC, electrical panel, plumbing, and water heater last replaced?
- Is there a deadline driving the sale (1031 exchange, divorce, estate, relocation)? That informs how much negotiation room exists.
- Crime grade is F in this area — have there been break-ins, vandalism, or insurance claims at this property in the last 3 years? What carrier currently insures it and at what premium?
- What's the average days-on-market for RENTAL listings here right now (not sales)? A rising rental-DOM trend means longer vacancies and softer asking-rent achievability than the comps imply.
- What's the recent tenant-quality profile in this submarket — average credit score on applications, eviction rate, late-payment / NSF rate, and stable-employment percentage? A property-management company in the area should have these aggregated.
- How much new for-sale + rental construction is in the pipeline within 1–3 miles? Heavy new supply typically softens prices + rents 12–24 months out; constrained supply supports both.
Investment metrics
- 1% rule
- 1.07% ✓
- Cap rate
- 9.14%
- Cash-on-cash
- 10.16%
- DSCR
- 1.45
- GRM
- 7.8
CMA / ARV
- ARV (median comp)
- $126,336
- List price
- $124,900
- Delta
- -1.14%
- Verdict
- FAIR
- Comps
- 20 within 1.0 mi
Show comp detail 12 sales within ~0.75 mi
| Address | Dist | Beds/Ba | Sqft | Sold | Price | $/sf | Match |
|---|---|---|---|---|---|---|---|
| 8116 Wayne Ave | 0.11mi | 3/1.0 | 996 (-1%) | 1mo | $112,500 | $113 | 92 |
| 8241 Highland Ave | 0.08mi | 3/1.0 | 1,126 (+12%) | 0mo | $99,000 | $88 | 77 |
| 1429 E 79th St | 0.38mi | 3/1.5 | 986 (-2%) | 3mo | $139,000 | $141 | 75 |
| 8444 Wayne St | 0.32mi | 2/1.5 (-1) | 987 (-2%) | 1mo | $94,000 | $95 | 74 |
| 8236 Flora Ave | 0.10mi | 3/2.0 | 864 (-14%) | 1mo | $195,000 | $226 | 67 |
| 8028 Flora Ave | 0.24mi | 2/1.0 (-1) | 906 (-10%) | 1mo | $130,000 | $143 | 66 |
| 8303 Wabash Ave | 0.58mi | 3/2.5 | 1,015 (+1%) | 2mo | $150,000 | $148 | 65 |
| 7909 Brooklyn Ave | 0.52mi | 4/1.0 (+1) | 1,035 (+3%) | 3mo | $134,900 | $130 | 64 |
| 1421 E 77th St | 0.59mi | 3/1.5 | 1,087 (+8%) | 2mo | $205,000 | $189 | 56 |
| 8405 Wabash Ave | 0.62mi | 2/1.0 (-1) | 936 (-7%) | 2mo | $74,889 | $80 | 53 |
| 8111 Park Ave | 0.44mi | 3/2.0 | 882 (-12%) | 3mo | $129,900 | $147 | 52 |
| 2205 E 77th Ter | 0.62mi | 3/2.0 | 1,154 (+14%) | 2mo | $120,000 | $104 | 41 |
Match score weights: distance 35% · size 25% · config 20% · recency 20%. Top-matched comps best support the ARV.
Projected returns pro-forma
-3.0% appreciation · 3.97% rent growth · sell at horizon
- IRR
- -0.1%
- Equity multiple
- 1.00×
- Total profit
- $-101
- Equity at exit
- $18,623
- IRR
- 10.5%
- Equity multiple
- 1.85×
- Total profit
- $29,561
- Equity at exit
- $10,799
Cash invested: $34,972 (down + closing). Projections, not guarantees.
Landlord ↔ Tenant lean methodology
- Overall (STATE)
- 81 Strongly Landlord-Friendly
- State Missouri
- 81 Strongly Landlord-Friendly · R+10
- County
- — inherits STATE
- City
- — inherits STATE
ZIP-level market 64131
- Rents YoY
- 4.0%
- Active inventory
- 133
- Price-to-rent
- 7.8×
Monthly cashflow live
- Estimated rent
- $1,342 high interval (Pro) →
- Mortgage (P&I)
- −$655
- Tax from tax record
- −$57 /mo · $680/yr
- Insurance
- −$52
- HOA
- −$0
- Vacancy / Maint / Mgmt
- −$282
- Net cashflow
- $296
Break-even live
Sensitivity live
| Price | -10% $367 | -5% $331 | +0% $296 | +5% $261 | +10% $225 |
|---|---|---|---|---|---|
| Rent | -10% $190 | -5% $243 | +0% $296 | +5% $349 | +10% $402 |
| Rate | -1.0pp $359 | -0.5pp $328 | base $296 | +0.5pp $264 | +1.0pp $231 |
UW: 25.0% down · 7.5% · 30yr · 1.5% tax · 5.0% vac · 8.0% maint · 8.0% mgmt
Financing live
Cash to close
- Down payment
- $31,225
- Closing costs
- $3,747
- Reserves months
- —
- Total cash needed
- —
Loan-product check · same deal, 3 products live
Conventional
25% down · 7.5% · 30yr
- Down + closing
- —
- Monthly P&I
- —
- Monthly cashflow
- —
- DSCR
- —
- Eligible?
- —
Personal DTI + credit; lowest rate.
DSCR
20% down · 8.5% · 30yr
- Down + closing
- —
- Monthly P&I
- —
- Monthly cashflow
- —
- DSCR
- —
- Eligible?
- —
No personal income docs; deal must DSCR.
Hard money
10% down · 12.0% · 12mo
- Down + closing
- —
- Monthly P&I
- —
- Monthly cashflow
- —
- DSCR
- —
- Eligible?
- —
Short-term bridge; refi at stabilization.
Rent comps 24 comps
| Address | Beds | Baths | Sqft | Rent | $/sqft | DOM | Units | Dist |
|---|---|---|---|---|---|---|---|---|
| 8226 Flora Ave Kansas City, MO | 2.0 | 1.0 | 862 | $1,200 | $1.39 | 4d | 1 | 0.10mi |
| 8222 Troost Ave Unit 8222-1 Kansas City, MO | 2.0 | 1.0 | 825 | $1,400 | $1.70 | 16d | 1 | 0.42mi |
| 8208 Troost Ave Unit 8218-3 Kansas City, MO | 2.0 | 1.0 | 750 | $1,345 | $1.79 | 45d | 1 | 0.46mi |
| 8208 Troost Ave Kansas City, MO | 1.0–2.0 | 1.0 | 761 | $1,395 | $1.83 | 9d | 2 | 0.46mi |
| 8150 Troost Ave Unit 53 Kansas City, MO | 2.0 | 1.0 | 900 | $1,200 | $1.33 | 45d | 1 | 0.48mi |
| 1830 E 78th St Kansas City, MO | 3.0 | 1.0 | 1000 | $1,350 | $1.35 | 14d | 1 | 0.53mi |
| 1861 E 78th St Kansas City, MO | 3.0 | 1.0 | 864 | $1,095 | $1.27 | 18d | 1 | 0.53mi |
| 8101 Campbell St Kansas City, MO | 2.0 | 1.0 | 820 | $888 | $1.08 | 3d | 1 | 0.55mi |
| 1836 E 77th St Kansas City, MO | 2.0 | 1.0 | 1200 | $1,150 | $0.96 | 23d | 1 | 0.68mi |
| 320 E 79th Ter Kansas City, MO | 3.0 | 1.0 | 1100 | $1,700 | $1.55 | 45d | 1 | 0.98mi |
| 8701 Chestnut Cir Kansas City, MO | 1.0–2.0 | 1.0–2.0 | 925 | $1,115 | $1.21 | 3d | 15 | 0.99mi |
| 8104 McGee St Kansas City, MO | 2.0 | 1.0 | 1100 | $1,350 | $1.23 | 25d | 1 | 0.99mi |
| 7427 Arleta Blvd Kansas City, MO | 2.0 | 1.0 | 805 | $1,150 | $1.43 | 45d | 1 | 1.01mi |
| 7605 Locust St Kansas City, MO | 2.0 | 1.0 | 744 | $1,325 | $1.78 | 9d | 1 | 1.12mi |
| 7411 Montgall Ave Kansas City, MO | 3.0 | 1.0 | 840 | $1,200 | $1.43 | 45d | 1 | 1.19mi |
| 11 W 80th St Kansas City, MO | 4.0 | 3.5 | 1369 | $2,600 | $1.90 | 3d | 1 | 1.21mi |
| 2607 E 73rd St Kansas City, MO | 2.0 | 1.0 | 1212 | $1,050 | $0.87 | 25d | 1 | 1.30mi |
| 119 W 79th Ter Kansas City, MO | 3.0 | 2.0 | 1312 | $2,205 | $1.68 | 3d | 1 | 1.31mi |
| 3106 E 75th St Kansas City, MO | 3.0 | 1.5 | 985 | $1,225 | $1.24 | 23d | 1 | 1.31mi |
| 7412 Bellefontaine Ave Unit A Kansas City, MO | 2.0 | 1.0 | 780 | $1,200 | $1.54 | 4d | 1 | 1.34mi |
| 7317 Agnes Ave Kansas City, MO | 2.0 | 1.0 | 767 | $895 | $1.17 | 25d | 1 | 1.39mi |
| 7240 Agnes Ave Kansas City, MO | 3.0 | 1.0 | 1140 | $1,350 | $1.18 | 3d | 1 | 1.44mi |
| 408 E 92nd St Kansas City, MO | 3.0 | 1.0 | 1274 | $1,595 | $1.25 | 6d | 1 | 1.44mi |
| 7426 Indiana Ave Kansas City, MO | 3.0 | 1.0 | 1100 | $1,400 | $1.27 | 45d | 1 | 1.45mi |
Listing history 10 events
-
2026-04-01$124,900 Active 355-char remark
Show marketing remark (355 chars)
Instant Equity Opportunity in Marlborough Highlands! Calling all investors and DIY enthusiasts this charming 3-bedroom, 2-bathroom bungalow is the project you’ve been waiting for. Perfectly situated on an expansive 0.31-acre level lot, this property offers rare outdoor space and significant upside in a rapidly developing area of South Kansas City.
-
2013-05-03soldstatus 244-char remark
Show marketing remark (244 chars)
Beautiful Home with an Open Floor Plan that is 3/4 of the Way Finished from Being Remodeled. Now is Your Chance to Come in and Earn Instant Equity and Finish the Project. The Big Stuff is Done! Come See this Charming Home with the Massive Yard.
-
2013-05-03soldstatus
Show marketing remark (244 chars)
Beautiful Home with an Open Floor Plan that is 3/4 of the Way Finished from Being Remodeled. Now is Your Chance to Come in and Earn Instant Equity and Finish the Project. The Big Stuff is Done! Come See this Charming Home with the Massive Yard.
-
2011-11-30$37,000 244-char remark
Show marketing remark (244 chars)
Beautiful Home with an Open Floor Plan that is 3/4 of the Way Finished from Being Remodeled. Now is Your Chance to Come in and Earn Instant Equity and Finish the Project. The Big Stuff is Done! Come See this Charming Home with the Massive Yard.
-
2011-11-30historical
Show marketing remark (244 chars)
Beautiful Home with an Open Floor Plan that is 3/4 of the Way Finished from Being Remodeled. Now is Your Chance to Come in and Earn Instant Equity and Finish the Project. The Big Stuff is Done! Come See this Charming Home with the Massive Yard.
-
2011-02-16$40,000
-
2008-06-25soldstatus
-
2006-10-31soldstatus
-
2002-10-09soldstatus
-
2002-08-28soldstatus
ⓘ Source: listings_history table (triggers on properties + properties_extension) + one-shot
backfill from property_details.listing_events for pre-trigger history.
Tax reassessment forecast MO · Resets to sale price
- Current annual tax
- $680 · $57/mo
- Projected year-2 tax
- $1,212 · $101/mo
- Expected delta
- +$531/yr (+$44/mo · 78.1%)
ⓘ Screening estimate from a state-policy table — verify with the county assessor before closing.
Climate risk First Street
- Flood 1/10 Low FEMA zone X (unshaded) · 0% chance over 30 yrs
- Wildfire 1/10 Low
- Heat 4/10 Moderate 7 d/yr ≥107°F today · 17 d/yr by 30 yrs out
- Wind 2/10 Low
- Air quality 3/10 Moderate 2 unhealthy d/yr today · 4 by 30 yrs out
Nearby sold comps map
Loading sold comps map…
Walkable amenities ~0.75 mi
Loading nearby amenities…
Taxation est. · year 1
- Rental income
- $16,098
- − Mortgage interest
- −$6,996
- − Property taxes
- −$680
- − Insurance
- −$624
- − Repairs & maintenance
- −$1,288
- − Management
- −$1,288
- − Depreciation
- −$3,633
- Taxable income
- $1,588
- Est. tax owed @ 24.0%
- −$381
- After-tax cash flow
- $3,172/yr
For passive investors: Depreciation is non-cash, so a rental often shows a tax loss while cash-flowing — sheltering income. Rental losses are passive: they offset passive income freely, and up to $25,000/yr can offset ordinary (W-2) income if you actively participate and your MAGI is under $100k (phasing out to $0 by $150k); unused losses carry forward. On sale, claimed depreciation is recaptured at up to 25%, and gains may owe capital-gains tax (a 1031 exchange can defer both). Figures are a year-1 estimate at your 24.0% rate — not tax advice; consult a CPA.
Schools (NCES district)
- District
- Center 58
- NCES district ID
- 2908250
- Math proficiency
- 12% ▼ -15.00%
- Reading proficiency
- 29% ▼ -6.00%
- Median HH income
- $43,544
- Composite
- 17.64/100
- National rank
- #9031
- State rank
- #301 of 324 in MO
Livability — Kansas City
- Score
- 78/100
- State rank
- #28
- US rank
- #2671
Category grades
Schools grade is shown separately in the Schools card above.
Census & demographics
- Census place
- Kansas City, MO
- County
- Jackson County · 687,798 people
- City population
- 439,467
- Metro
- Kansas City, MO-KS
- Population (ZIP)
- 21,942
- Household income
- $64,201
- Rent vs Own
- Severe rent burden
- 1249.0
Population outlook (Jackson County) Hauer SSP2
- Today (2025)
- 719,589 people
- By 2030
- 731,456 · +1.6%
- By 2040
- 746,689 · +3.8%
- By 2050
- 749,289 · +4.1%
- By 2075
- 736,227 · +2.3%
- By 2100
- 668,210 · -7.1%
Race, ethnicity, and origin ACS 2023
- Neighborhood character
- Diverse neighborhood (Simpson 0.61)
- Race & ethnicity
- White 48% Black 39% Hispanic / Latino 7% Two or more races 7% Asian 1%
- Hispanic origin (detail)
- Mexican 3%
- Common ancestry
- Italian 5% Slovak 1% Lithuanian 1%
- Foreign-born
- 5% · Canada, Vietnam
- Languages at home
- 93% English-only · Spanish 3% French/Haitian/Cajun 1%
Political lean MEDSL · Jackson
- 2024 margin
- D (+19.3) · D 58.9% · R 39.5% · Other 1.6%
- 2008→2024 swing
- -6.1pp toward R · 2008: 25.4pp · 2024: 19.3pp
- All cycles
- 2024: D+19.3 2020: D+22.0 2016: D+16.6 2012: D+19.0 2008: D+25.4
Not yet ingested
- Civics
- —
Market trends
- HPI YoY
- ▼ -253.25%
- Current HPI
- 340.8202
- Rent YoY
- ▲ 3.97%
- Metro
- Kansas City, MO-KS
- State GDP YoY
- ▲ 1.84%
- F500 in state
- 20
Industry mix (Fortune 500 HQ in MO)
| Industry | F500 HQs | Revenue |
|---|---|---|
| Healthcare | 1 | $163B |
|
||
| Insurance | 1 | $21B |
|
||
| Industrial Technology | 1 | $17B |
|
||
| Retail | 1 | $16B |
|
||
| Industrial Distribution | 1 | $10B |
|
||
| Utilities | 1 | $9B |
|
||
Price history
+212.2% since first listed10 events — show timeline
- 2026-04-01 Listed $124,900 Heartland MLS as Distributed by MLS Grid
- 2013-05-03 Sold (Public Records) — Public Records
- 2013-05-03 Sold (MLS) — Heartland MLS as Distributed by MLS Grid
- 2011-11-30 Listing Removed — Heartland MLS as Distributed by MLS Grid
- 2011-11-30 Listed $37,000 Heartland MLS as Distributed by MLS Grid
- 2011-02-16 Listed $40,000 Heartland MLS as Distributed by MLS Grid
- 2008-06-25 Sold (Public Records) — Public Records
- 2006-10-31 Sold (Public Records) — Public Records
- 2002-10-09 Sold (Public Records) — Public Records
- 2002-08-28 Sold (Public Records) — Public Records
Property tax history
+4.1%/yrLatest (2025): $680 · -28.8% YoY. Source: county tax records.
Cash-flow waterfall
monthlySold comps — $/sqft
last 12 mo · ≤1 miLoading sold comps…