 🏷️ Likely Rental
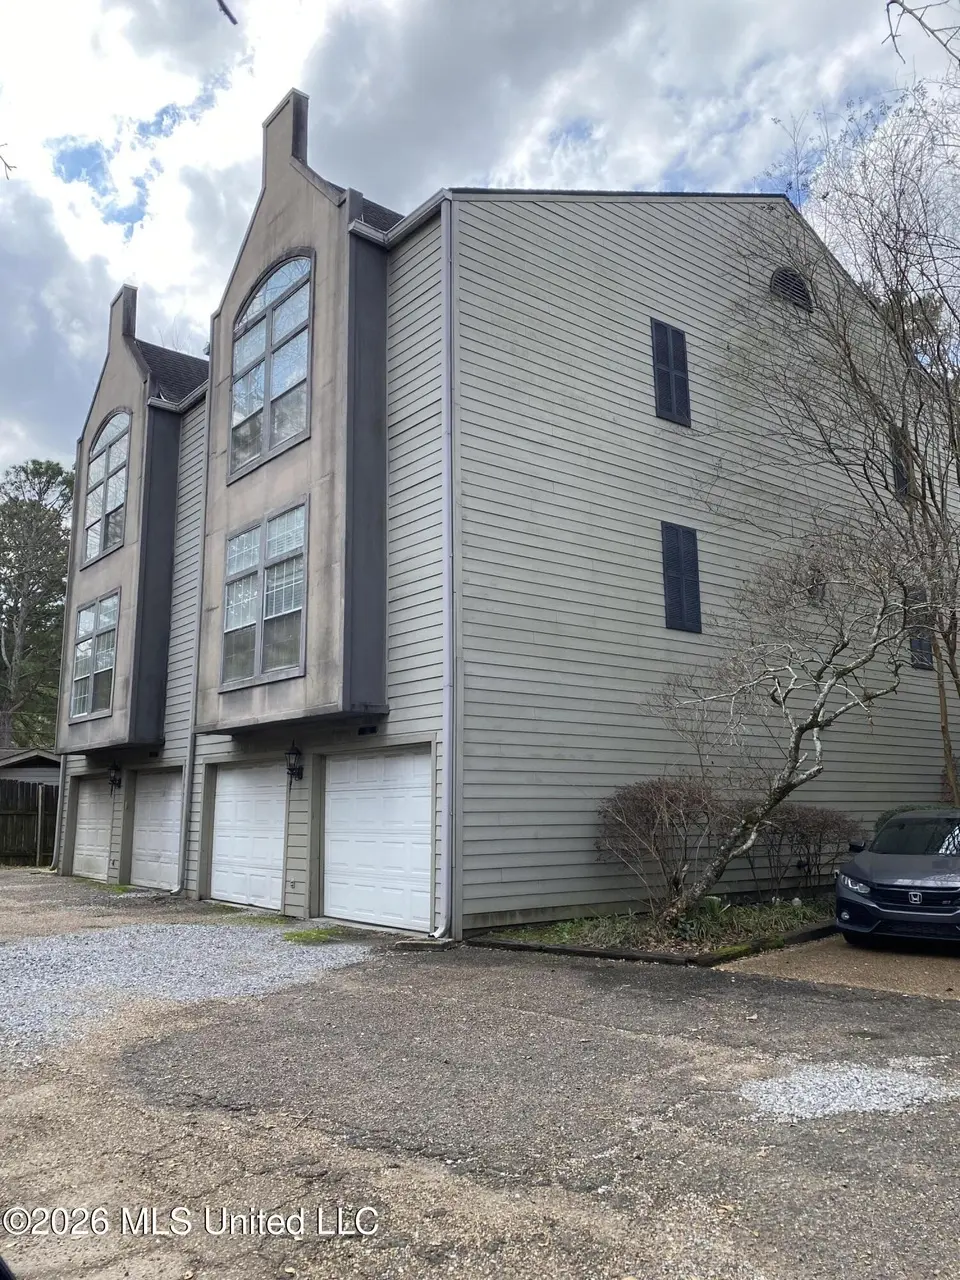
1313 Roxbury Ct · Jackson, MS
Flood risk 1/10 · Minimal
- FEMA flood zone
- X (unshaded)
- Chance of flooding over 30 yrs
- 0.0%
- Est. flood insurance / yr
- $507 – $1,088
Fire risk 1/10 · Minimal
- Est. fire insurance / yr
- $1,241 – $2,305
Heat risk 7/10 · Major
- Hot days now (above 108°F)
- 7 days/yr
- Hot days in 30 yrs
- 20 days/yr
Wind risk 8/10 · Major
- Chance of severe wind over 30 yrs
- 80.0%
Air-quality risk 1/10 · Minimal
- Unhealthy air days now
- 0 days/yr
- Unhealthy air days in 30 yrs
- 0 days/yr
Risk factors via First Street. Map © Google.
Why this score? — see what drove the D- grade
The composite is a weighted blend of 9 inputs, each scored 0–100. Each bar is that input's sub-score; the figure is the points it added to the 100-point composite (weight × sub-score).
- ARV discount +15.0/15.0
- Cash flow +7.3/30.0
- Rent growth +4.5/5.0
- Livability +3.4/5.0
- 1% rule +3.1/10.0
- Condition / age +2.5/5.0
- DSCR +1.5/10.0
- Schools +1.1/10.0
- Appreciation +0.0/10.0
$249,000
🖨 Deal sheet 📄 Offer letter ✓ Due diligence
Listing remarks MLS
Rare Multi-Level Condo Investment Opportunity in Northeast Jackson! Discover a unique opportunity in the heart of Northeast Jackson's desirable Roxbury Court--just minutes from Highland Village and The District at Eastover. This 3-bedroom, 3-bath condo spans multiple levels and includes an elevator for easy access between floors, offering exceptional flexibility for both homeowners and investors. Currently, each level is occupied by a tenant, providing a rare chance to own a fully leased property with strong income potential. The middle floor and upper floor are currently each configured as a one bed/one bath apartment. They have rare tall ceilings and amazing light filled windows as well as their own garage space as well as a washer/dryer in their unit. On the lower level, a separately accessed studio/efficiency unit includes a full bathroom and kitchenette--ideal for a tenant, guest suite, or home office setup. This level also includes access to the garage. Whether you're looking to live in one unit and rent the other two units, or add a solid income-producing property to your portfolio, this condo offers the space, layout, and location to meet a variety of needs. Don't miss this outstanding investment opportunity in one of North Jackson's most convenient and established neighborhoods.
Key facts
- $150 HOA
- 2 garage spots
- Built 1985
Neighborhood map
What this means for you Summary
Snapshot
- This is a 2-bed/2.0-bath single-family listed at $249k.
Deal economics
- At list price, monthly cash flow is $-332 ($-4k/yr) — negative.
- To cash-flow at today's rent, offer at most $190k (23.6% below list).
- To meet the 1% rule (rent ≥ 1% of price), the offer needs to be $202k (18.7% below list).
- Recommended offer: $190k (23.6% below list) — sets the bar for cash-flow.
- Cap rate 4.7% vs local median 9.9% in Jackson — below-typical yield; the buyer is paying a premium for something (appreciation thesis, condition, location) that the cap rate doesn't capture.
Location & tenants
- Location reads 68/100 on livability (#66 in MS) — a middle-class / working-renter tenant base. Strengths: commute A+, cost of living A+, housing A+; Watch: schools F, amenities F, employment F.
- Jackson Public School District (urban): math 9% / reading 18% proficiency, ranked #112 of 130 in MS (top 86%) — low school quality limits family demand, transient renter base, plan for 1-2y turnover; 88% free/reduced lunch — lower-income household profile, screen leases tightly.
- Market conditions: Rents rising fast (+7.9%/yr); 221 active listings in the ZIP; 2 comparable units currently listed for rent nearby; 167 units permitted in Hinds County in 2024 (0 in 5+ unit buildings).
- This rent runs 35% of the median local income ($69k/yr) — at the standard rent-burdened threshold; future hikes will face affordability resistance.
Forward outlook
- Local home prices are declining (-3.0%/yr); year-one equity from $2k of loan paydown is wiped out by about $7k of value loss. Plan a longer hold.
- Hinds County population projected to shrink 6% by 2050 — rents likely to lag national; underwrite the cash flow, not the appreciation.
Negotiation context
- It's been on market 84 days — a 6% lower offer ($234k) is reasonable based on typical stale-listing flexibility.
- 3 sale attempts since 26y ago with the ask held roughly flat each time — persistent listings suggest the price (not the market) is what's stuck; bring a comps-based counter.
Risks & watch-outs
- Climate carrying-cost: severe wind risk, 80% chance of damaging wind over 30y; extreme-heat days projected 7→20/yr by 2055 (HVAC capex compounding) — expect insurance premiums to compound above CPI over the hold.
Questions for the listing agent
- What do current leases actually rent for vs. the listed asking? Can we see a recent rent roll and the last 12 months of T-12 income?
- It's been on market 84 days. Have you received any prior offers? Is the seller open to a 24% concession, seller financing, or rate buy-down credit?
- What does the HOA fee cover, when was the last increase, and are there any pending special assessments or reserve-fund shortfalls?
- Why hasn't it sold? Are there any deal-killer items the seller is aware of (foundation, flood, title, zoning, code violations)?
- Is there a deadline driving the sale (1031 exchange, divorce, estate, relocation)? That informs how much negotiation room exists.
- Schools are F-rated, which usually means shorter tenancies and higher turnover. Who's the typical renter profile here, and what's been the actual vacancy rate?
- The area grade is low — what's the realistic commute time and amenity access for the typical tenant pool here? Any planned neighborhood developments (good or bad) we should know about?
- What's the average days-on-market for RENTAL listings here right now (not sales)? A rising rental-DOM trend means longer vacancies and softer asking-rent achievability than the comps imply.
- What's the recent tenant-quality profile in this submarket — average credit score on applications, eviction rate, late-payment / NSF rate, and stable-employment percentage? A property-management company in the area should have these aggregated.
- How much new for-sale + rental construction is in the pipeline within 1–3 miles? Heavy new supply typically softens prices + rents 12–24 months out; constrained supply supports both.
Investment metrics
- 1% rule
- 0.81% ✗
- Cap rate
- 4.69%
- Cash-on-cash
- -5.72%
- DSCR
- 0.75
- GRM
- 10.3
CMA / ARV
- ARV (median comp)
- $321,870
- List price
- $249,000
- Delta
- -22.64%
- Verdict
- UNDERPRICED
- Comps
- 20 within 1.0 mi
Show comp detail 12 sales within ~0.75 mi
| Address | Dist | Beds/Ba | Sqft | Sold | Price | $/sf | Match |
|---|---|---|---|---|---|---|---|
| 1436 Robert Dr | 0.25mi | 3/2.5 (+1) | 2,373 (-9%) | 2mo | $349,000 | $147 | 64 |
| 1510 Douglass Dr | 0.27mi | 3/3.0 (+1) | 2,807 (+7%) | 9mo | $349,500 | $125 | 59 |
| 4011 Northeast Dr | 0.31mi | 3/3.0 (+1) | 2,729 (+4%) | 15mo | $357,000 | $131 | 57 |
| 3809 Montrose Cir | 0.71mi | 3/2.5 (+1) | 2,600 (-1%) | 4mo | $274,900 | $106 | 55 |
| 3726 Greenwich St | 0.55mi | 3/3.0 (+1) | 2,398 (-8%) | 1mo | $290,000 | $121 | 50 |
| 4150 Crane Blvd | 0.62mi | 3/2.5 (+1) | 2,687 (+3%) | 14mo | $472,600 | $176 | 48 |
| 1038 Whitsett Walk | 0.52mi | 3/2.0 (+1) | 2,281 (-13%) | 7mo | $269,000 | $118 | 43 |
| 1436 Kimwood Dr | 0.72mi | 3/2.0 (+1) | 2,450 (-6%) | 10mo | $240,000 | $98 | 42 |
| 1048 Meadow Heights Dr | 0.62mi | 3/3.0 (+1) | 2,336 (-11%) | 9mo | $115,000 | $49 | 37 |
| 4325 Ridgewood Rd | 0.70mi | 3/2.0 (+1) | 2,368 (-10%) | 14mo | $227,900 | $96 | 35 |
| 3806 Montrose Cir | 0.70mi | 3/2.0 (+1) | 2,410 (-8%) | 22mo | $254,400 | $106 | 31 |
| 1838 Aztec Dr | 0.74mi | 3/3.0 (+1) | 2,246 (-14%) | 20mo | $260,000 | $116 | 16 |
Match score weights: distance 35% · size 25% · config 20% · recency 20%. Top-matched comps best support the ARV.
Projected returns pro-forma
-3.0% appreciation · 7.9% rent growth · sell at horizon
- IRR
- -20.0%
- Equity multiple
- 0.27×
- Total profit
- $-50,865
- Equity at exit
- $37,127
- IRR
- -4.1%
- Equity multiple
- 0.67×
- Total profit
- $-23,312
- Equity at exit
- $21,529
Cash invested: $69,720 (down + closing). Projections, not guarantees.
Landlord ↔ Tenant lean methodology
- Overall (STATE)
- 90 Strongly Landlord-Friendly
- State Mississippi
- 90 Strongly Landlord-Friendly · R+11
- County
- — inherits STATE
- City
- — inherits STATE
ZIP-level market 39211
- Rents YoY
- 7.9%
- Active inventory
- 221
- Price-to-rent
- 10.3×
Monthly cashflow live
- Estimated rent
- $2,024 medium interval (Pro) →
- Mortgage (P&I)
- −$1,306
- Tax from tax record
- −$372 /mo · $4,458/yr
- Insurance
- −$104
- HOA
- −$150
- Vacancy / Maint / Mgmt
- −$425
- Net cashflow
- $-332
Break-even live
UW: 25.0% down · 7.5% · 30yr · 1.5% tax · 5.0% vac · 8.0% maint · 8.0% mgmt
Financing live
Cash to close
- Down payment
- $62,250
- Closing costs
- $7,470
- Reserves months
- —
- Total cash needed
- —
Loan-product check · same deal, 3 products live
Conventional
25% down · 7.5% · 30yr
- Down + closing
- —
- Monthly P&I
- —
- Monthly cashflow
- —
- DSCR
- —
- Eligible?
- —
Personal DTI + credit; lowest rate.
DSCR
20% down · 8.5% · 30yr
- Down + closing
- —
- Monthly P&I
- —
- Monthly cashflow
- —
- DSCR
- —
- Eligible?
- —
No personal income docs; deal must DSCR.
Hard money
10% down · 12.0% · 12mo
- Down + closing
- —
- Monthly P&I
- —
- Monthly cashflow
- —
- DSCR
- —
- Eligible?
- —
Short-term bridge; refi at stabilization.
Rent comps 2 comps
| Address | Beds | Baths | Sqft | Rent | $/sqft | DOM | Units | Dist |
|---|---|---|---|---|---|---|---|---|
| 246 Eastbrooke St Jackson, MS | 2.0 | 2.0 | 1777 | $2,750 | $1.55 | 43d | 1 | 0.74mi |
| 4220 Council Cir Jackson, MS | 3.0 | 2.5 | 1780 | $1,850 | $1.04 | 23d | 1 | 1.18mi |
HOA detail
- Monthly dues
- $150 · $1,800/yr
Listing history 26 events
-
2026-06-18days on market $249,000 Active 84 DOM
-
2026-06-17days on market $249,000 Active 83 DOM
-
2026-06-16days on market $249,000 Active 82 DOM
-
2026-06-15days on market $249,000 Active 81 DOM
-
2026-06-14days on market $249,000 Active 79 DOM
-
2026-06-13days on market $249,000 Active 78 DOM
-
2026-06-10days on market $249,000 Active 76 DOM
-
2026-06-09days on market $249,000 Active 75 DOM
-
2026-06-08days on market $249,000 Active 74 DOM
-
2026-06-07days on market $249,000 Active 73 DOM
-
2026-06-05days on market $249,000 Active 70 DOM
-
2026-06-03days on market $249,000 Active 69 DOM
-
2026-06-02days on market $249,000 Active 68 DOM
-
2026-06-01days on market $249,000 Active 67 DOM
-
2026-05-31days on market $249,000 Active 66 DOM
-
2026-05-30days on market $249,000 Active 65 DOM
-
2026-03-26$249,000 Active 1317-char remark
Show marketing remark (1317 chars)
Rare Multi-Level Condo Investment Opportunity in Northeast Jackson! Discover a unique opportunity in the heart of Northeast Jackson's desirable Roxbury Court--just minutes from Highland Village and The District at Eastover. This 3-bedroom, 3-bath condo spans multiple levels and includes an elevator for easy access between floors, offering exceptional flexibility for both homeowners and investors. Currently, each level is occupied by a tenant, providing a rare chance to own a fully leased property with strong income potential. The middle floor and upper floor are currently each configured as a one bed/one bath apartment. They have rare tall ceilings and amazing light filled windows as well as their own garage space as well as a washer/dryer in their unit. On the lower level, a separately accessed studio/efficiency unit includes a full bathroom and kitchenette--ideal for a tenant, guest suite, or home office setup. This level also includes access to the garage. Whether you're looking to live in one unit and rent the other two units, or add a solid income-producing property to your portfolio, this condo offers the space, layout, and location to meet a variety of needs. Don't miss this outstanding investment opportunity in one of North Jackson's most convenient and established neighborhoods.
-
2025-12-15historical
-
2025-07-13$249,000 Active
-
2012-12-28soldstatus
-
2012-03-13soldstatus
-
2007-04-04soldstatus
-
2006-05-02historical
-
2001-08-28soldstatus
-
2000-06-24$135,000
-
1989-12-29soldstatus
ⓘ Source: listings_history table (triggers on properties + properties_extension) + one-shot
backfill from property_details.listing_events for pre-trigger history.
Tax reassessment forecast MS · Resets to sale price
- Current annual tax
- $4,458 · $372/mo
- Projected year-2 tax
- $4,458 · $372/mo
- Expected delta
- $0/yr ($0/mo · 0.0%)
ⓘ Screening estimate from a state-policy table — verify with the county assessor before closing.
Climate risk First Street
- Flood 1/10 Low FEMA zone X (unshaded) · 0% chance over 30 yrs
- Wildfire 1/10 Low
- Heat 7/10 Severe 7 d/yr ≥108°F today · 20 d/yr by 30 yrs out
- Wind 8/10 Severe 80% chance of damaging wind over 30 yrs
- Air quality 1/10 Low 0 unhealthy d/yr today · 0 by 30 yrs out
Nearby sold comps map
Loading sold comps map…
Walkable amenities ~0.75 mi
Loading nearby amenities…
Taxation est. · year 1
- Rental income
- $24,288
- − Mortgage interest
- −$13,948
- − Property taxes
- −$4,458
- − Insurance
- −$1,245
- − Repairs & maintenance
- −$1,943
- − Management
- −$1,943
- − HOA
- −$1,800
- − Depreciation
- −$7,244
- Taxable loss
- −$8,292
- Est. tax savings @ 24.0%
- +$1,990
- After-tax cash flow
- $-1,994/yr
For passive investors: Depreciation is non-cash, so a rental often shows a tax loss while cash-flowing — sheltering income. Rental losses are passive: they offset passive income freely, and up to $25,000/yr can offset ordinary (W-2) income if you actively participate and your MAGI is under $100k (phasing out to $0 by $150k); unused losses carry forward. On sale, claimed depreciation is recaptured at up to 25%, and gains may owe capital-gains tax (a 1031 exchange can defer both). Figures are a year-1 estimate at your 24.0% rate — not tax advice; consult a CPA.
Schools (NCES district)
- District
- Jackson Public School District
- NCES district ID
- 2802190
- Math proficiency
- 9% ▼ -14.00%
- Reading proficiency
- 18% ▼ -7.00%
- Median HH income
- $33,234
- Composite
- 10.89/100
- National rank
- #9755
- State rank
- #112 of 130 in MS
Livability — Jackson
- Score
- 68/100
- State rank
- #66
- US rank
- #9695
Category grades
Schools grade is shown separately in the Schools card above.
Census & demographics
- Census place
- Jackson, MS
- County
- Hinds County · 167,040 people
- City population
- 140,204
- Metro
- Jackson, MS
- Population (ZIP)
- 23,838
- Household income
- $69,426
- Rent vs Own
- Severe rent burden
- 736.0
Population outlook (Hinds County) Hauer SSP2
- Today (2025)
- 242,528 people
- By 2030
- 241,113 · -0.6%
- By 2040
- 235,557 · -2.9%
- By 2050
- 226,946 · -6.4%
- By 2075
- 199,995 · -17.5%
- By 2100
- 164,165 · -32.3%
Race, ethnicity, and origin ACS 2023
- Neighborhood character
- Majority Black (59%)
- Race & ethnicity
- Black 59% White 36% Hispanic / Latino 3% Two or more races 2%
- Common ancestry
- Serbian 2% Italian 2% Slovak 1%
- Foreign-born
- 2% · Canada, China
- Languages at home
- 96% English-only · Spanish 3% Chinese 1%
Political lean MEDSL · Hinds
- 2024 margin
- Solid D (+46.1) · D 72.4% · R 26.3% · Other 1.4%
- 2008→2024 swing
- +7.1pp toward D · 2008: 39.0pp · 2024: 46.1pp
- All cycles
- 2024: D+46.1 2020: D+48.3 2016: D+43.7 2012: D+45.1 2008: D+39.0
Not yet ingested
- Civics
- —
Market trends
- HPI YoY
- ▼ -135.99%
- Current HPI
- 145.5192
- Rent YoY
- ▲ 7.90%
- Metro
- Jackson, MS
- State GDP YoY
- —
- F500 in state
- 0
Price history
+84.4% since first listed10 events — show timeline
- 2026-03-26 Listed $249,000 MLSU
- 2025-12-15 Listing Removed — MLSU
- 2025-07-13 Listed $249,000 MLSU
- 2012-12-28 Sold (Public Records) — Public Records
- 2012-03-13 Sold (Public Records) — Public Records
- 2007-04-04 Sold (Public Records) — Public Records
- 2006-05-02 Listing Removed — MLSU
- 2001-08-28 Sold (Public Records) — Public Records
- 2000-06-24 Listed $135,000 MLSU
- 1989-12-29 Sold (Public Records) — Public Records
Property tax history
+1.0%/yrLatest (2025): $4,458 · +3.3% YoY. Source: county tax records.
Cash-flow waterfall
monthlySold comps — $/sqft
last 12 mo · ≤1 miLoading sold comps…