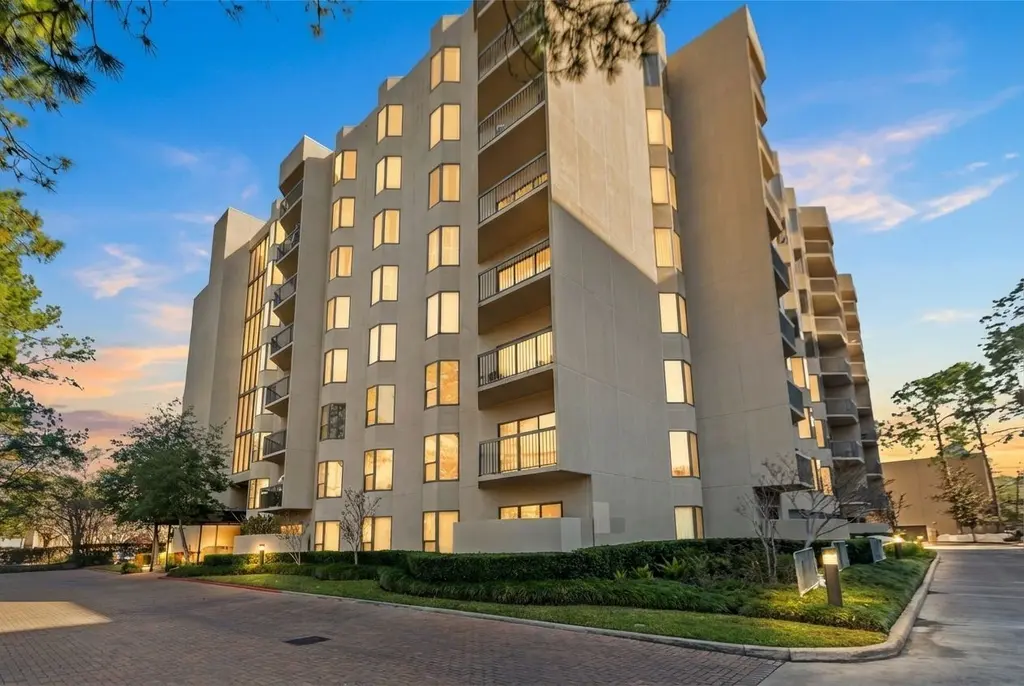
661 Bering Dr #504 · Houston, TX
Flood risk 7/10 · Major
- FEMA flood zone
- X (unshaded)
- Chance of flooding over 30 yrs
- 0.99%
- Est. flood insurance / yr
- $507 – $1,088
Fire risk 1/10 · Minimal
- Est. fire insurance / yr
- $1,222 – $2,270
Heat risk 9/10 · Severe
- Hot days now (above 109°F)
- 7 days/yr
- Hot days in 30 yrs
- 23 days/yr
Wind risk 9/10 · Severe
- Chance of severe wind over 30 yrs
- 99.0%
Air-quality risk 3/10 · Minor
- Unhealthy air days now
- 3 days/yr
- Unhealthy air days in 30 yrs
- 3 days/yr
Risk factors via First Street. Map © Google.
Why this score? — see what drove the D grade
The composite is a weighted blend of 9 inputs, each scored 0–100. Each bar is that input's sub-score; the figure is the points it added to the 100-point composite (weight × sub-score).
- ARV discount +15.0/15.0
- 1% rule +10.0/10.0
- Appreciation +4.4/10.0
- Livability +3.7/5.0
- Schools +2.7/10.0
- Condition / age +2.5/5.0
- Rent growth +2.0/5.0
- Cash flow +0.0/30.0
- DSCR +0.0/10.0
$120,000
🖨 Deal sheet (PDF) 📄 Offer letter ✓ Due diligence
Listing remarks MLS
Step into refined urban living in one of Houston’s most sought-after neighborhoods. This beautifully appointed 2-bedroom, 2-bath condominium showcases tranquil atrium views and a thoughtfully designed layout that blends comfort with sophistication. Expansive living and dining areas are enhanced by modern finishes creating an inviting setting for both everyday living and entertaining guests. The well-equipped kitchen and generous bedrooms provide a peaceful retreat at the end of the day. Beyond your front door, enjoy a resort-style lifestyle with an impressive collection of amenities, including a heated pool and spa, fully equipped cardio and fitness room, private tennis and pickleball courts, outdoor kitchen, and dedicated dog park. 24-hour concierge adds an extra level of ease and security. Ideally positioned near Buffalo Bayou’s scenic trails, Galleria’s upscale shopping and dining, and the renowned Houstonian, this residence delivers luxury, convenience, and an unbeatable location.
Key facts
- Pickleball courts
- Tennis courts
- Modern finishes
Tags
Neighborhood map
What this means for you Summary
Snapshot
- This is a 2-bed/2.0-bath condo listed at $120k.
Deal economics
- At list price, monthly cash flow is $-829 ($-10k/yr) — negative.
- To cash-flow at today's rent, offer at most $22k (81.3% below list).
- Meets the 1% rule at list price ($2k rent vs $120k).
- Recommended offer: $22k (81.3% below list) — sets the bar for cash-flow.
- Cap rate -1.3% vs local median 3.2% in Houston — below-typical yield; the buyer is paying a premium for something (appreciation thesis, condition, location) that the cap rate doesn't capture.
Location & tenants
- Location reads 74/100 on livability (#184 in TX, #4,771 nationally) — a middle-class / working-renter tenant base. Strengths: amenities A+, cost of living A+, housing A+; Watch: schools D, crime F.
- Houston ISD (urban): math 27% / reading 35% proficiency, ranked #593 of 826 in TX (top 72%) — families likely to look elsewhere, expect single-tenant / working-renter base with shorter leases; 71% free/reduced lunch — lower-income household profile, screen leases tightly.
- Market conditions: Rents soft (-1.8%/yr); 389 active listings in the ZIP; 40 comparable units currently listed for rent nearby; rentals at typical pace (median 25d on market — plan ~3-4 weeks tenant-placement turnaround); 45% of comp listings sitting > 30 days — soft ceiling on asking rent; 29,883 units permitted in Harris County in 2024 (8,621 in 5+ unit buildings).
- This rent runs 35% of the median local income ($67k/yr) — at the standard rent-burdened threshold; future hikes will face affordability resistance.
Forward outlook
- Local home prices are declining (-1.2%/yr); year-one equity from $830 of loan paydown is wiped out by about $1k of value loss. Plan a longer hold.
- Harris County population projected at +47% by 2050 — long-run rental-demand tailwind backs the buy-and-hold thesis.
Negotiation context
- It's been on market 139 days — a 12% lower offer ($106k) is reasonable based on typical stale-listing flexibility.
- 16 sale attempts since 22y ago with the ask held roughly flat each time — persistent listings suggest the price (not the market) is what's stuck; bring a comps-based counter.
- Current owner paid $63k; list at $120k implies a 90% gain — meaningful room to come down on a strong offer.
Risks & watch-outs
- Watch-outs: property tax is 3.0% of price; flood insurance adds $66/mo; HOA is 68% of rent.
- Climate carrying-cost: major flood risk; severe wind risk, 99% chance of damaging wind over 30y; extreme-heat days projected 7→23/yr by 2055 (HVAC capex compounding) — expect insurance premiums to compound above CPI over the hold.
Questions for the listing agent
- What do current leases actually rent for vs. the listed asking? Can we see a recent rent roll and the last 12 months of T-12 income?
- It's been on market 139 days. Have you received any prior offers? Is the seller open to a 81% concession, seller financing, or rate buy-down credit?
- Property tax is high relative to price — has the assessment been appealed recently, and will the sale trigger a re-assessment?
- What's the actual annual flood-insurance premium (NFIP or private), and is the property in a SFHA with mandatory coverage?
- What does the HOA fee cover, when was the last increase, and are there any pending special assessments or reserve-fund shortfalls?
- Any open or pending special assessments — roof, HVAC, plumbing, elevator, façade? What's the per-unit balance and payoff schedule, and is the seller paying it off at close or rolling it to the buyer?
- Why hasn't it sold? Are there any deal-killer items the seller is aware of (foundation, flood, title, zoning, code violations)?
- Is there a deadline driving the sale (1031 exchange, divorce, estate, relocation)? That informs how much negotiation room exists.
- Schools are D-rated, which usually means shorter tenancies and higher turnover. Who's the typical renter profile here, and what's been the actual vacancy rate?
- Crime grade is F in this area — have there been break-ins, vandalism, or insurance claims at this property in the last 3 years? What carrier currently insures it and at what premium?
- The area grade is low — what's the realistic commute time and amenity access for the typical tenant pool here? Any planned neighborhood developments (good or bad) we should know about?
- What's the average days-on-market for RENTAL listings here right now (not sales)? A rising rental-DOM trend means longer vacancies and softer asking-rent achievability than the comps imply.
- What's the recent tenant-quality profile in this submarket — average credit score on applications, eviction rate, late-payment / NSF rate, and stable-employment percentage? A property-management company in the area should have these aggregated.
- How much new apartment / multifamily construction is in the pipeline within 1–3 miles? Heavy new supply (>2% of stock underway) typically softens rents 12–24 months out; light construction supports rent growth.
Investment metrics
- 1% rule
- 1.61% ✓
- Cap rate
- -1.33%
- Cash-on-cash
- -27.23%
- DSCR
- -0.21
- GRM
- 5.2
CMA / ARV
- ARV (median comp)
- $162,498
- List price
- $120,000
- Delta
- -26.15%
- Verdict
- UNDERPRICED
- Comps
- 20 within 1.0 mi
Projected returns pro-forma
-1.23% appreciation · 0.0% rent growth · sell at horizon
- IRR
- -56.7%
- Equity multiple
- -1.02×
- Total profit
- $-67,773
- Equity at exit
- $27,637
- IRR
- -68.8%
- Equity multiple
- -3.06×
- Total profit
- $-136,451
- Equity at exit
- $27,902
Cash invested: $33,600 (down + closing). Projections, not guarantees.
Landlord ↔ Tenant lean methodology
- Overall (STATE)
- 87 Strongly Landlord-Friendly
- State Texas
- 87 Strongly Landlord-Friendly · R+5
- County
- — inherits STATE
- City
- — inherits STATE
ZIP-level market 77057
- Home prices YoY
- -0.7%
- Rents YoY
- -1.8%
- Active inventory
- 389
- Price-to-rent
- 5.2×
Monthly cashflow live
- Estimated rent
- $1,932 high interval (Pro) →
- Mortgage (P&I)
- −$629
- Tax from tax record
- −$305 /mo · $3,657/yr
- Insurance
- −$50
- Flood insurance flood zone
- −$66 /mo · $798/yr
- HOA
- −$1,305
- Vacancy / Maint / Mgmt
- −$406
- Net cashflow
- $-829
Break-even live
Sensitivity live
| Price | -10% $-761 | -5% $-795 | +0% $-829 | +5% $-863 | +10% $-897 |
|---|---|---|---|---|---|
| Rent | -10% $-982 | -5% $-905 | +0% $-829 | +5% $-753 | +10% $-676 |
| Rate | -1.0pp $-768 | -0.5pp $-798 | base $-829 | +0.5pp $-860 | +1.0pp $-892 |
UW: 25.0% down · 7.5% · 30yr · 1.5% tax · 5.0% vac · 8.0% maint · 8.0% mgmt
Financing live
Cash to close
- Down payment
- $30,000
- Closing costs
- $3,600
- Reserves months
- —
- Total cash needed
- —
Loan-product check · same deal, 3 products live
Conventional
25% down · 7.5% · 30yr
- Down + closing
- —
- Monthly P&I
- —
- Monthly cashflow
- —
- DSCR
- —
- Eligible?
- —
Personal DTI + credit; lowest rate.
DSCR
20% down · 8.5% · 30yr
- Down + closing
- —
- Monthly P&I
- —
- Monthly cashflow
- —
- DSCR
- —
- Eligible?
- —
No personal income docs; deal must DSCR.
Hard money
10% down · 12.0% · 12mo
- Down + closing
- —
- Monthly P&I
- —
- Monthly cashflow
- —
- DSCR
- —
- Eligible?
- —
Short-term bridge; refi at stabilization.
Rent comps 40 comps
| Address | Beds | Baths | Sqft | Rent | $/sqft | DOM | Units | Dist |
|---|---|---|---|---|---|---|---|---|
| 661 Bering Dr Houston, TX | 3.0 | 2.0 | 1698 | $3,500 | $2.06 | 44d | 1 | 0.01mi |
| 651 Bering Dr Unit 2668 Houston, TX | 2.0 | 2.0 | 1328 | $1,753 | $1.32 | 44d | 1 | 0.04mi |
| 651 Bering Dr Unit 1984 Houston, TX | 2.0 | 2.0 | 1302 | $1,777 | $1.36 | 44d | 1 | 0.04mi |
| 5800 Woodway Dr Houston, TX | 1.0–2.0 | 1.0–2.0 | 1153 | $1,772 | $1.54 | 11d | 14 | 0.12mi |
| 5700 Green Tree Rd Houston, TX | 2.0 | 2.0 | 1168 | $1,700 | $1.46 | 44d | 1 | 0.24mi |
| 824 Bering Dr Unit 2162 Houston, TX | 2.0 | 2.0 | 1724 | $2,415 | $1.40 | 8d | 1 | 0.35mi |
| 824 Bering Dr Unit 2187 Houston, TX | 2.0 | 2.0 | 1724 | $2,407 | $1.40 | 3d | 1 | 0.35mi |
| 824 Bering Dr Unit 861 Houston, TX | 2.0 | 2.0 | 1724 | $2,439 | $1.41 | 11d | 1 | 0.35mi |
| 1100 Augusta Dr Houston, TX | 1.0–2.0 | 1.0 | 909 | $1,550 | $1.71 | 44d | 3 | 0.49mi |
| 1100 Bering Dr Houston, TX | 1.0–2.0 | 1.0–2.0 | 828 | $1,505 | $1.82 | 2d | 9 | 0.50mi |
| 1111 Bering Dr Unit 28 Houston, TX | 2.0 | 2.0 | 1328 | $1,788 | $1.35 | 44d | 1 | 0.51mi |
| 1111 Bering Dr Unit 125 Houston, TX | 1.0 | 1.0 | 898 | $1,145 | $1.28 | 44d | 1 | 0.51mi |
| 1111 Bering Dr Unit 1086 Houston, TX | 2.0 | 2.0 | 1482 | $1,725 | $1.16 | 44d | 1 | 0.51mi |
| 1111 Bering Dr Unit 6252 Houston, TX | 2.0 | 2.0 | 1447 | $2,239 | $1.55 | 44d | 1 | 0.51mi |
| 1111 Bering Dr Unit 1902 Houston, TX | 2.0 | 2.0 | 1318 | $2,100 | $1.59 | 44d | 1 | 0.51mi |
| 1112 Bering Dr #67 Houston, TX | 2.0 | 2.5 | 1610 | $2,200 | $1.37 | 24d | 1 | 0.55mi |
| 1300 Augusta Dr Unit 2-9985 Houston, TX | 1.0 | 1.0 | 898 | $1,225 | $1.36 | 44d | 1 | 0.61mi |
| 1300 Augusta Dr Unit 2958 Houston, TX | 2.0 | 2.0 | 1285 | $1,785 | $1.39 | 44d | 1 | 0.61mi |
| 1300 Augusta Dr Unit 7258 Houston, TX | 2.0 | 2.0 | 1358 | $1,702 | $1.25 | 44d | 1 | 0.61mi |
| 1441 Bering Dr Houston, TX | 2.0 | 2.5 | 1767 | $2,312 | $1.31 | 2d | 3 | 0.68mi |
| 500 Sage Rd Houston, TX | 2.0 | 2.0 | 1265 | $2,775 | $2.19 | 24d | 1 | 0.71mi |
| 5740 San Felipe St Houston, TX | 2.0 | 1.0–2.0 | 933 | $2,848 | $3.05 | 2d | 25 | 0.78mi |
| 1300 Bering Dr Houston, TX | 2.0 | 2.0 | 973 | $1,520 | $1.56 | 24d | 1 | 0.83mi |
| 5665 San Felipe St Houston, TX | 1.0 | 1.0 | 1088 | $2,653 | $2.44 | 24d | 1 | 0.84mi |
| 1617 Fountain View Dr Unit 1674 Houston, TX | 2.0 | 2.0 | 893 | $1,292 | $1.45 | 3d | 1 | 0.84mi |
| 1617 Fountain View Dr Unit 2047 Houston, TX | 2.0 | 2.0 | 893 | $1,335 | $1.49 | 11d | 1 | 0.84mi |
| 1617 Fountain View Dr Unit 2047 Houston, TX | 2.0 | 2.0 | 893 | $1,292 | $1.45 | 19d | 1 | 0.84mi |
| 1000 Yorktown St Houston, TX | 2.0 | 2.0 | 1285 | $1,800 | $1.40 | 44d | 1 | 0.85mi |
| 1801 Bering Dr Houston, TX | 1.0–2.0 | 1.0–2.0 | 819 | $1,535 | $1.87 | 1d | 8 | 0.88mi |
| 5010 Woodway Dr Houston, TX | 1.0–2.0 | 1.0–2.0 | 736 | $1,585 | $2.15 | 44d | 1 | 0.93mi |
| 502 S Post Oak Ln Houston, TX | 1.0–2.0 | 1.0–2.0 | 963 | $1,650 | $1.71 | 3d | 8 | 0.94mi |
| 813 S Post Oak Ln Houston, TX | 3.0 | 2.0 | 1580 | $3,145 | $1.99 | 44d | 1 | 0.97mi |
| 1819 Augusta Dr Houston, TX | 2.0 | 2.0–2.5 | 1167 | $1,487 | $1.27 | 15d | 5 | 0.99mi |
| 1818 Augusta Dr Houston, TX | 2.0 | 1.0 | 995 | $1,575 | $1.58 | 44d | 1 | 1.00mi |
| 807 S Post Oak Ln Houston, TX | 1.0–2.0 | 1.0–2.0 | 970 | $2,460 | $2.54 | 3d | 18 | 1.01mi |
| 1885 Augusta Dr Houston, TX | 2.0 | 2.0 | 1350 | $1,650 | $1.22 | 44d | 1 | 1.05mi |
| 1697 Sage Rd Houston, TX | 2.0 | 2.0 | 1209 | $3,650 | $3.02 | 19d | 1 | 1.06mi |
| 1697 Sage Rd Unit APO2 Houston, TX | 2.0 | 2.0 | 1209 | $3,650 | $3.02 | 24d | 1 | 1.06mi |
| 7 Riverway Houston, TX | 1.0–2.0 | 1.0–2.0 | 1503 | $5,869 | $3.90 | 1d | 7 | 1.06mi |
| 1901 Augusta Dr Houston, TX | 1.0–2.0 | 1.0–2.0 | 934 | $1,715 | $1.84 | 2d | 14 | 1.08mi |
HOA detail condo
- Monthly dues
- $1,305 · $15,660/yr
- Likely covers
- pooldoormansecurity
- Assessments
- None detected in remarks — confirm with the listing agent.
Listing history 50 events
-
2026-06-17days on market $120,000 Pending 139 DOM
-
2026-06-16days on market $120,000 Pending 138 DOM
-
2026-06-15days on market $120,000 Pending 137 DOM
-
2026-06-13statusdays on market $120,000 Pending 135 DOM
-
2026-06-10days on market $120,000 Active 131 DOM
-
2026-06-08days on market $120,000 Active 130 DOM
-
2026-06-07days on market $120,000 Active 129 DOM
-
2026-06-04days on market $120,000 Active 126 DOM
-
2026-06-01days on market $120,000 Active 123 DOM
-
2026-05-31days on market $120,000 Active 122 DOM
-
2026-01-29$120,000 Active 1017-char remark
Show marketing remark (1017 chars)
Step into refined urban living in one of Houston’s most sought-after neighborhoods. This beautifully appointed 2-bedroom, 2-bath condominium showcases tranquil atrium views and a thoughtfully designed layout that blends comfort with sophistication. Expansive living and dining areas are enhanced by modern finishes creating an inviting setting for both everyday living and entertaining guests. The well-equipped kitchen and generous bedrooms provide a peaceful retreat at the end of the day. Beyond your front door, enjoy a resort-style lifestyle with an impressive collection of amenities, including a heated pool and spa, fully equipped cardio and fitness room, private tennis and pickleball courts, outdoor kitchen, and dedicated dog park. 24-hour concierge adds an extra level of ease and security. Ideally positioned near Buffalo Bayou’s scenic trails, Galleria’s upscale shopping and dining, and the renowned Houstonian, this residence delivers luxury, convenience, and an unbeatable location.
-
2025-11-01historical
-
2025-09-26$126,000 Active
-
2025-09-24historical
-
2025-05-30price $150,000
-
2025-03-27$160,000 Active
-
2025-03-14historical
-
2025-02-27$160,000 Active
-
2025-02-08historical
-
2025-01-04price $160,000
-
2024-09-23price $165,000
-
2024-08-09$170,000 Active
-
2024-08-09historical
-
2024-06-17$175,000 Active
-
2024-06-11historical
-
2024-01-20$175,000 Active
-
2024-01-16price $175,000
-
2024-01-16historical
-
2023-05-12soldstatus
-
2023-05-10soldstatus Sold
-
2023-05-07status Pending
-
2023-04-29status Option Pending
-
2023-04-12price $169,900
-
2023-04-01price $178,500
-
2023-03-15$180,000 Active
-
2022-11-18soldstatus Sold
-
2022-11-18soldstatus
-
2022-11-08status Option Pending
-
2022-11-04$149,000 Active
-
2018-10-22soldstatus
-
2018-10-18soldstatus Sold
-
2018-09-23status Pending
-
2018-09-13status Option Pending
-
2018-08-24price $149,000
-
2018-06-08price $159,000
-
2018-04-27$169,000 Active
-
2018-03-28historical
-
2018-03-21price $169,000
-
2018-02-09price $179,000
-
2018-01-20price $184,000
ⓘ Source: listings_history table (triggers on properties + properties_extension) + one-shot
backfill from property_details.listing_events for pre-trigger history.
Tax reassessment forecast TX · Resets to sale price
- Current annual tax
- $3,657 · $305/mo
- Projected year-2 tax
- $3,657 · $305/mo
- Expected delta
- $0/yr ($0/mo · 0.0%)
ⓘ Screening estimate from a state-policy table — verify with the county assessor before closing.
Climate risk First Street
- Flood 7/10 Severe FEMA zone X (unshaded) · 99% chance over 30 yrs
- Wildfire 1/10 Low
- Heat 9/10 Extreme 7 d/yr ≥109°F today · 23 d/yr by 30 yrs out
- Wind 9/10 Extreme 99% chance of damaging wind over 30 yrs
- Air quality 3/10 Moderate 3 unhealthy d/yr today · 3 by 30 yrs out
Nearby sold comps map
Loading sold comps map…
Walkable amenities ~0.75 mi
Loading nearby amenities…
Taxation est. · year 1
- Rental income
- $23,189
- − Mortgage interest
- −$6,722
- − Property taxes
- −$3,657
- − Insurance
- −$1,398
- − Repairs & maintenance
- −$1,855
- − Management
- −$1,855
- − HOA
- −$15,660
- − Depreciation
- −$3,491
- Taxable loss
- −$11,448
- Est. tax savings @ 24.0%
- +$2,748
- After-tax cash flow
- $-7,199/yr
For passive investors: Depreciation is non-cash, so a rental often shows a tax loss while cash-flowing — sheltering income. Rental losses are passive: they offset passive income freely, and up to $25,000/yr can offset ordinary (W-2) income if you actively participate and your MAGI is under $100k (phasing out to $0 by $150k); unused losses carry forward. On sale, claimed depreciation is recaptured at up to 25%, and gains may owe capital-gains tax (a 1031 exchange can defer both). Figures are a year-1 estimate at your 24.0% rate — not tax advice; consult a CPA.
Schools (NCES district)
- District
- Houston ISD
- NCES district ID
- 4823640
- Math proficiency
- 27% ▼ -18.00%
- Reading proficiency
- 35% ▼ -6.00%
- Median HH income
- $46,054
- Composite
- 26.63/100
- National rank
- #7173
- State rank
- #593 of 826 in TX
Livability — Houston
- Score
- 74/100
- State rank
- #184
- US rank
- #4771
Category grades
Schools grade is shown separately in the Schools card above.
Census & demographics
- Census place
- Houston, TX
- County
- Harris County · 4,702,590 people
- City population
- 3,226,434
- Metro
- Houston-The Woodlands-Sugar Land, TX
- Population (ZIP)
- 46,569
- Household income
- $66,971
- Rent vs Own
- Severe rent burden
- 3533.0
Population outlook (Harris County) Hauer SSP2
- Today (2025)
- 5,571,493 people
- By 2030
- 6,089,821 · +9.3%
- By 2040
- 7,142,806 · +28.2%
- By 2050
- 8,185,864 · +46.9%
- By 2075
- 10,574,329 · +89.8%
- By 2100
- 12,109,958 · +117.4%
Race, ethnicity, and origin ACS 2023
- Neighborhood character
- Diverse neighborhood (Simpson 0.69)
- Race & ethnicity
- Hispanic / Latino 38% White 37% Two or more races 22% Black 12% Asian 10% Native American 1%
- Hispanic origin (detail)
- Mexican 13% Cuban 1%
- Common ancestry
- Italian 3% Lithuanian 2% Slovak 1%
- Foreign-born
- 38% · Canada, China, Jamaica
- Languages at home
- 50% English-only · Spanish 33% Other Indo-European 6% Other Asian/Pacific 3%
Political lean MEDSL · Harris
- 2024 margin
- Lean D (+5.5) · D 52.0% · R 46.4% · Other 1.6%
- 2008→2024 swing
- +3.9pp toward D · 2008: 1.6pp · 2024: 5.5pp
- All cycles
- 2024: D+5.5 2020: D+13.3 2016: D+12.4 2012: D+0.1 2008: D+1.6
Not yet ingested
- Civics
- —
Market trends
- HPI YoY
- ▼ -1.23%
- Current HPI
- 167.8863
- Rent YoY
- ▼ -1.83%
- Metro
- Houston-The Woodlands-Sugar Land, TX
- State GDP YoY
- ▲ 3.95%
- F500 in state
- 110
Industry mix (Fortune 500 HQ in TX)
| Industry | F500 HQs | Revenue |
|---|---|---|
| Energy | 16 | $1,198B |
|
||
| Technology | 5 | $198B |
|
||
| Engineering / Construction | 4 | $72B |
|
||
| Energy Services | 3 | $60B |
|
||
| Utilities | 3 | $41B |
|
||
| Healthcare | 2 | $330B |
|
||
Price history
+90.5% since first listed61 events — show timeline
- 2026-01-29 Listed $120,000 HARMLS
- 2025-11-01 Listing Removed — HARMLS
- 2025-09-26 Listed $126,000 HARMLS
- 2025-09-24 Listing Removed — HARMLS
- 2025-05-30 Price Changed $150,000 HARMLS
- 2025-03-27 Listed $160,000 HARMLS
- 2025-03-14 Listing Removed — HARMLS
- 2025-02-27 Listed $160,000 HARMLS
- 2025-02-08 Listing Removed — HARMLS
- 2025-01-04 Price Changed $160,000 HARMLS
- 2024-09-23 Price Changed $165,000 HARMLS
- 2024-08-09 Listing Removed — HARMLS
- 2024-08-09 Listed $170,000 HARMLS
- 2024-06-17 Listed $175,000 HARMLS
- 2024-06-11 Listing Removed — HARMLS
- 2024-01-20 Listed $175,000 HARMLS
- 2024-01-16 Price Changed $175,000 HARMLS
- 2024-01-16 Coming Soon — HARMLS
- 2023-05-12 Sold (Public Records) — Public Records
- 2023-05-10 Sold (MLS) — HARMLS
- 2023-05-07 Pending — HARMLS
- 2023-04-29 Pending — HARMLS
- 2023-04-12 Price Changed $169,900 HARMLS
- 2023-04-01 Price Changed $178,500 HARMLS
- 2023-03-15 Listed $180,000 HARMLS
- 2022-11-18 Sold (Public Records) — Public Records
- 2022-11-18 Sold (MLS) — HARMLS
- 2022-11-08 Pending — HARMLS
- 2022-11-04 Listed $149,000 HARMLS
- 2018-10-22 Sold (Public Records) — Public Records
- 2018-10-18 Sold (MLS) — HARMLS
- 2018-09-23 Pending — HARMLS
- 2018-09-13 Pending — HARMLS
- 2018-08-24 Price Changed $149,000 HARMLS
- 2018-06-08 Price Changed $159,000 HARMLS
- 2018-04-27 Listed $169,000 HARMLS
- 2018-03-28 Listing Removed — HARMLS
- 2018-03-21 Price Changed $169,000 HARMLS
- 2018-02-09 Price Changed $179,000 HARMLS
- 2018-01-20 Price Changed $184,000 HARMLS
- 2017-10-20 Listed $189,000 HARMLS
- 2015-02-25 Sold (Public Records) — Public Records
- 2015-02-24 Sold (MLS) — HARMLS
- 2015-02-16 Pending — HARMLS
- 2015-02-02 Pending — HARMLS
- 2015-01-26 Relisted — HARMLS
- 2015-01-21 Pending — HARMLS
- 2015-01-12 Pending — HARMLS
- 2014-10-13 Price Changed $189,000 HARMLS
- 2014-08-01 Price Changed $199,000 HARMLS
- 2014-03-24 Relisted — HARMLS
- 2014-03-24 Price Changed $229,000 HARMLS
- 2014-03-11 Listing Removed — HARMLS
- 2014-01-27 Price Changed $259,000 HARMLS
- 2014-01-16 Listed $279,000 HARMLS
- 2008-03-20 Sold (Public Records) — Public Records
- 2007-03-29 Listing Removed — HARMLS
- 2006-09-29 Listed $105,000 HARMLS
- 2005-12-31 Listing Removed — HARMLS
- 2004-09-08 Listed $110,000 HARMLS
- 1994-08-01 Sold (Public Records) $63,000 Public Records
Property tax history
+0.8%/yrLatest (2025): $3,657 · -3.8% YoY. Source: county tax records.
Cash-flow waterfall
monthlySold comps — $/sqft
last 12 mo · ≤1 miLoading sold comps…