418 W Pierce St · Mangum, OK
Flood risk No data
- FEMA flood zone
- —
- Chance of flooding over 30 yrs
- —
- Est. flood insurance / yr
- —
Fire risk No data
- Est. fire insurance / yr
- —
Heat risk No data
- Hot days now (above threshold)
- —
- Hot days in 30 yrs
- —
Wind risk No data
- Chance of severe wind over 30 yrs
- —
Air-quality risk No data
- Unhealthy air days now
- —
- Unhealthy air days in 30 yrs
- —
Risk factors via First Street. Map © Google.
Why this score? — see what drove the B- grade
The composite is a weighted blend of 9 inputs, each scored 0–100. Each bar is that input's sub-score; the figure is the points it added to the 100-point composite (weight × sub-score).
- Cash flow +30.0/30.0
- 1% rule +10.0/10.0
- DSCR +10.0/10.0
- Appreciation +3.8/10.0
- Livability +3.2/5.0
- ARV discount +2.8/15.0
- Rent growth +2.5/5.0
- Condition / age +2.5/5.0
- Schools +2.3/10.0
$69,000
🖨 Deal sheet 📄 Offer letter ✓ Due diligence
Listing remarks
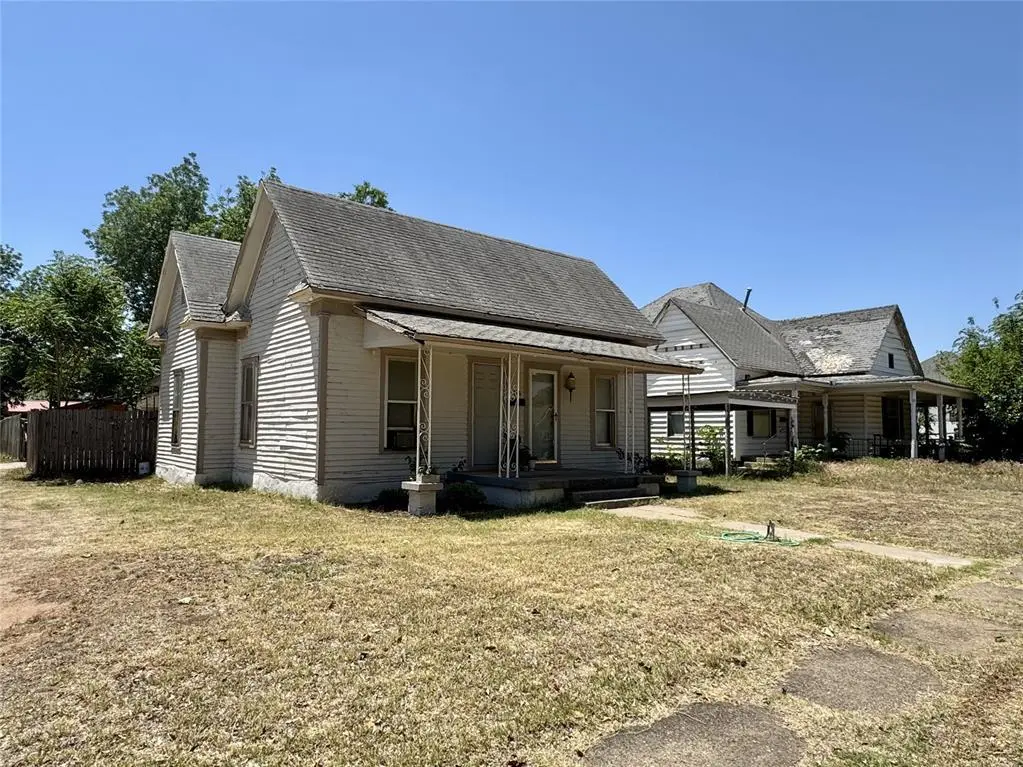
Welcome home to this charming 3-bedroom, 1 full bath home situated on a spacious corner lot with mature trees and an oversized fenced backyard. Enjoy the convenience of a covered carport leading directly into a functional mudroom—perfect for bringing in groceries with ease. Inside, you’ll find taller ceilings, newly installed flooring in the main living area, a generous kitchen with ample cabinet space, and a large dining area with additional flex space for an office or play area. The home also features window units and a wall furnace for heating and cooling comfort and a storage shed that stays with the property. This cutie is full of charm and potential making it a great oppor
Key facts
- Generous kitchen
- Covered carport
- Functional mudroom
Tags
Property features AI
Finance
- Other: Homestead exempt; Occupied by owner; No storm shelter; Located at the corner of W Pierce St between N Byers Ave and N Kentucky Ave
- Financial info: Not assumable; Loan qualification unknown
- HOA & community: No mandatory association dues
Exterior
- Parking: Additional parking; Backyard parking; Concrete parking; Other parking options
- Utilities: Water, sewer and power information not specified
- Home design: Single family residence; One-level; North-facing; Residential property
- Construction: Frame and vinyl siding construction; Other construction materials; Composition roof; Combination foundation; Built (existing property)
- Exterior features: Covered patio; Covered porch; Porch; Outbuildings and storage; Combination fencing; Corner lot
Interior
- Bedrooms: 3 bedrooms
- Flooring: Combination flooring
- Bathrooms: 1 full bathroom
- Heating & cooling: Other heating; Window unit(s) for cooling
- Interior features: In-law plan; Smoke alarm
- Laundry & utility: Inside utility
Neighborhood map
What this means for you Summary
Snapshot
- This is a 3-bed/1.0-bath single-family listed at $69k.
Deal economics
- At list price, monthly cash flow is $471 ($6k/yr) — positive.
- The deal already cash-flows at list — no discount required.
- Meets the 1% rule at list price ($1k rent vs $69k).
- Recommended offer: $67k (3.0% below list) — sets the bar for market timing.
- Cap rate 14.5% vs local median 7.8% in Mangum — top-decile yield for the area; either an underpriced asset or a hidden risk that comps aren't pricing in. Stress-test before assuming the spread holds.
Location & tenants
- Location reads 65/100 on livability (#144 in OK) — a middle-class / working-renter tenant base. Strengths: cost of living A+, housing A+, crime A-; Watch: amenities F, commute F, employment F.
- Mangum (town): math 27% / reading 28% proficiency, ranked #89 of 270 in OK (top 33%) — low school quality limits family demand, transient renter base, plan for 1-2y turnover.
- Zoned schools: Edison Es (math 47% / reading 32%, grade F, #107 of 845 statewide, top 14%, 239 students, 0% FRL); Mangum Hs (math 15% / reading 24%, grade F, #274 of 447 statewide, top 66%, 175 students, 0% FRL) — zoned schools average 0% FRL vs 56% district-wide (56 pts lower); this property's tenant base skews higher-income than the district average.
- Market conditions: 45 active listings in the ZIP.
Forward outlook
- Local home prices are declining (-2.5%/yr); year-one equity from $477 of loan paydown is wiped out by about $2k of value loss. Plan a longer hold.
- Greer County population projected to shrink 3% by 2050 — rents likely to lag national; underwrite the cash flow, not the appreciation.
- At projected returns (-2.5% appreciation + 3.0% rent growth), your $19k cash investment doubles in ~4 years — after that, you're playing with house money.
Negotiation context
- It's been on market 38 days — a 3% lower offer ($67k) is reasonable based on typical stale-listing flexibility.
- 2 sale attempts since 4y ago with the ask held roughly flat each time — persistent listings suggest the price (not the market) is what's stuck; bring a comps-based counter.
- Current owner paid $56k; 23% above their basis — modest negotiation headroom, anchor on the comps not their cost.
Risks & watch-outs
- Watch-outs: built in 1940 — expect roof / HVAC / electrical / plumbing capex.
Questions for the listing agent
- It's been on market 38 days. Have you received any prior offers? Is the seller open to a 3% concession, seller financing, or rate buy-down credit?
- Built in 1940 — when were the roof, HVAC, electrical panel, plumbing, and water heater last replaced?
- Is there a deadline driving the sale (1031 exchange, divorce, estate, relocation)? That informs how much negotiation room exists.
- What's the average days-on-market for RENTAL listings here right now (not sales)? A rising rental-DOM trend means longer vacancies and softer asking-rent achievability than the comps imply.
- What's the recent tenant-quality profile in this submarket — average credit score on applications, eviction rate, late-payment / NSF rate, and stable-employment percentage? A property-management company in the area should have these aggregated.
- How much new for-sale + rental construction is in the pipeline within 1–3 miles? Heavy new supply typically softens prices + rents 12–24 months out; constrained supply supports both.
Investment metrics
- 1% rule
- 1.65% ✓
- Cap rate
- 14.48%
- Cash-on-cash
- 29.25%
- DSCR
- 2.30
- GRM
- 5.1
CMA / ARV
- ARV (on-the-fly)
- $62,426
- Comps found
- 12
Show comp detail 12 sales within ~0.75 mi
| Address | Dist | Beds/Ba | Sqft | Sold | Price | $/sf | Match |
|---|---|---|---|---|---|---|---|
| 200 N Maryland Ave | 0.04mi | 3/2.0 | 1,329 (+4%) | 6mo | $49,500 | $37 | 82 |
| 412 N Kentucky Ave | 0.19mi | 2/1.0 (-1) | 1,224 (-4%) | 6mo | $70,000 | $57 | 75 |
| 235 W Polk St | 0.27mi | 2/2.0 (-1) | 1,249 (-2%) | 5mo | $55,000 | $44 | 71 |
| 314 N Maryland Ave | 0.12mi | 3/1.0 | 1,400 (+10%) | 9mo | $28,500 | $20 | 70 |
| 705 N Pennsylvania Ave | 0.51mi | 3/2.0 | 1,280 (+0%) | 2mo | $110,000 | $86 | 70 |
| 403 S Oklahoma Ave | 0.45mi | 2/1.0 (-1) | 1,240 (-3%) | 10mo | $14,000 | $11 | 62 |
| 413 W Taylor St | 0.15mi | 2/1.0 (-1) | 1,134 (-11%) | 10mo | $55,000 | $49 | 61 |
| 311 N Byers Ave | 0.12mi | 4/2.0 (+1) | 1,318 (+4%) | 23mo | $47,700 | $36 | 60 |
| 210 N Louis Tittle Ave | 0.47mi | 3/1.0 | 1,372 (+8%) | 13mo | $47,000 | $34 | 54 |
| 312 S Oklahoma Ave | 0.43mi | 3/2.0 | 1,415 (+11%) | 15mo | $79,600 | $56 | 46 |
| 315 N Pennsylvania Ave | 0.37mi | 2/2.0 (-1) | 1,449 (+14%) | 12mo | $114,000 | $79 | 41 |
| 214 E Van Buren St | 0.53mi | 2/2.0 (-1) | 1,428 (+12%) | 7mo | $108,000 | $76 | 40 |
Match score weights: distance 35% · size 25% · config 20% · recency 20%. Top-matched comps best support the ARV.
Projected returns pro-forma
-2.45% appreciation · 3.0% rent growth · sell at horizon
- IRR
- 24.8%
- Equity multiple
- 2.05×
- Total profit
- $20,377
- Equity at exit
- $11,972
- IRR
- 31.8%
- Equity multiple
- 3.99×
- Total profit
- $57,683
- Equity at exit
- $8,900
Cash invested: $19,320 (down + closing). Projections, not guarantees.
Landlord ↔ Tenant lean methodology
- Overall (STATE)
- 83 Strongly Landlord-Friendly
- State Oklahoma
- 83 Strongly Landlord-Friendly · R+20
- County
- — inherits STATE
- City
- — inherits STATE
ZIP-level market 73554
- Home prices YoY
- -2.7%
- Active inventory
- 45
- Price-to-rent
- 5.1×
Monthly cashflow live
- Estimated rent
- $1,136 medium interval (Pro) →
- Mortgage (P&I)
- −$362
- Tax from tax record
- −$36 /mo · $428/yr
- Insurance
- −$29
- HOA
- −$0
- Vacancy / Maint / Mgmt
- −$238
- Net cashflow
- $471
Break-even live
UW: 25.0% down · 7.5% · 30yr · 1.5% tax · 5.0% vac · 8.0% maint · 8.0% mgmt
Financing live
Cash to close
- Down payment
- $17,250
- Closing costs
- $2,070
- Reserves months
- —
- Total cash needed
- —
Loan-product check · same deal, 3 products live
Conventional
25% down · 7.5% · 30yr
- Down + closing
- —
- Monthly P&I
- —
- Monthly cashflow
- —
- DSCR
- —
- Eligible?
- —
Personal DTI + credit; lowest rate.
DSCR
20% down · 8.5% · 30yr
- Down + closing
- —
- Monthly P&I
- —
- Monthly cashflow
- —
- DSCR
- —
- Eligible?
- —
No personal income docs; deal must DSCR.
Hard money
10% down · 12.0% · 12mo
- Down + closing
- —
- Monthly P&I
- —
- Monthly cashflow
- —
- DSCR
- —
- Eligible?
- —
Short-term bridge; refi at stabilization.
Listing history 21 events
-
2026-06-18days on market $69,000 Active 38 DOM
-
2026-06-17days on market $69,000 Active 37 DOM
-
2026-06-16days on market $69,000 Active 36 DOM
-
2026-06-15days on market $69,000 Active 35 DOM
-
2026-06-13days on market $69,000 Active 33 DOM
-
2026-06-12days on market $69,000 Active 32 DOM
-
2026-06-09days on market $69,000 Active 29 DOM
-
2026-06-08days on market $69,000 Active 28 DOM
-
2026-06-08days on market $69,000 Active 27 DOM
-
2026-06-07days on market $69,000 Active 26 DOM
-
2026-06-04days on market $69,000 Active 23 DOM
-
2026-06-02days on market $69,000 Active 22 DOM
-
2026-06-01days on market $69,000 Active 21 DOM
-
2026-05-31days on market $69,000 Active 20 DOM
-
2026-05-11$69,000 Active
-
2023-06-28historical
-
2023-05-15soldstatus $56,000
-
2022-12-08price $55,000
-
2022-10-27price $65,000
-
2022-06-27$70,000 Active
-
2011-12-05soldstatus $10,000
ⓘ Source: listings_history table (triggers on properties + properties_extension) + one-shot
backfill from property_details.listing_events for pre-trigger history.
Tax reassessment forecast OK · Resets to sale price
- Current annual tax
- $428 · $36/mo
- Projected year-2 tax
- $621 · $52/mo
- Expected delta
- +$193/yr (+$16/mo · 45.1%)
ⓘ Screening estimate from a state-policy table — verify with the county assessor before closing.
Nearby sold comps map
Loading sold comps map…
Walkable amenities ~0.75 mi
Loading nearby amenities…
Taxation est. · year 1
- Rental income
- $13,627
- − Mortgage interest
- −$3,865
- − Property taxes
- −$428
- − Insurance
- −$345
- − Repairs & maintenance
- −$1,090
- − Management
- −$1,090
- − Depreciation
- −$2,007
- Taxable income
- $4,801
- Est. tax owed @ 24.0%
- −$1,152
- After-tax cash flow
- $4,498/yr
For passive investors: Depreciation is non-cash, so a rental often shows a tax loss while cash-flowing — sheltering income. Rental losses are passive: they offset passive income freely, and up to $25,000/yr can offset ordinary (W-2) income if you actively participate and your MAGI is under $100k (phasing out to $0 by $150k); unused losses carry forward. On sale, claimed depreciation is recaptured at up to 25%, and gains may owe capital-gains tax (a 1031 exchange can defer both). Figures are a year-1 estimate at your 24.0% rate — not tax advice; consult a CPA.
Schools (NCES district)
- District
- Mangum
- NCES district ID
- 4018780
- Math proficiency
- 27% ▼ -18.00%
- Reading proficiency
- 28% ▼ -15.00%
- Median HH income
- $36,568
- Composite
- 22.85/100
- National rank
- #8012
- State rank
- #89 of 270 in OK
Livability — Mangum
- Score
- 65/100
- State rank
- #144
- US rank
- #13248
Category grades
Schools grade is shown separately in the Schools card above.
Census & demographics
- Census place
- Mangum, OK
- Population (ZIP)
- 3,361
Population outlook (Greer County) Hauer SSP2
- Today (2025)
- 5,904 people
- By 2030
- 5,869 · -0.6%
- By 2040
- 5,790 · -1.9%
- By 2050
- 5,712 · -3.3%
- By 2075
- 5,196 · -12.0%
- By 2100
- 4,326 · -26.7%
Race, ethnicity, and origin ACS 2023
- Neighborhood character
- Predominantly White (75%)
- Race & ethnicity
- White 75% Hispanic / Latino 15% Two or more races 8% Black 3% Native American 1%
- Hispanic origin (detail)
- Mexican 14%
- Common ancestry
- Iranian 2% Serbian 2% Slovak 1%
- Foreign-born
- 1% · China, Canada
- Languages at home
- 94% English-only · Spanish 5%
Political lean MEDSL · Greer
- 2024 margin
- Solid R (+65.7) · D 16.6% · R 82.3% · Other 1.1%
- 2008→2024 swing
- -19.3pp toward R · 2008: -46.5pp · 2024: -65.7pp
- All cycles
- 2024: R+65.7 2020: R+64.7 2016: R+61.1 2012: R+46.7 2008: R+46.5
Not yet ingested
- Civics
- —
Market trends
- HPI YoY
- ▼ -2.45%
- Current HPI
- 88.9252
- Rent YoY
- —
- Metro
- —
- State GDP YoY
- ▲ 1.55%
- F500 in state
- 6
Industry mix (Fortune 500 HQ in OK)
| Industry | F500 HQs | Revenue |
|---|---|---|
| Energy | 3 | $48B |
|
||
Price history
+590.0% since first listed7 events — show timeline
- 2026-05-11 Listed $69,000 MLSOK
- 2023-06-28 Listing Removed — MLSOK
- 2023-05-15 Sold (Public Records) $56,000 Public Records
- 2022-12-08 Price Changed $55,000 MLSOK
- 2022-10-27 Price Changed $65,000 MLSOK
- 2022-06-27 Listed $70,000 MLSOK
- 2011-12-05 Sold (Public Records) $10,000 Public Records
Property tax history
+12.3%/yrLatest (2025): $428 · -20.9% YoY. Source: county tax records.
Cash-flow waterfall
monthlySold comps — $/sqft
last 12 mo · ≤1 miLoading sold comps…