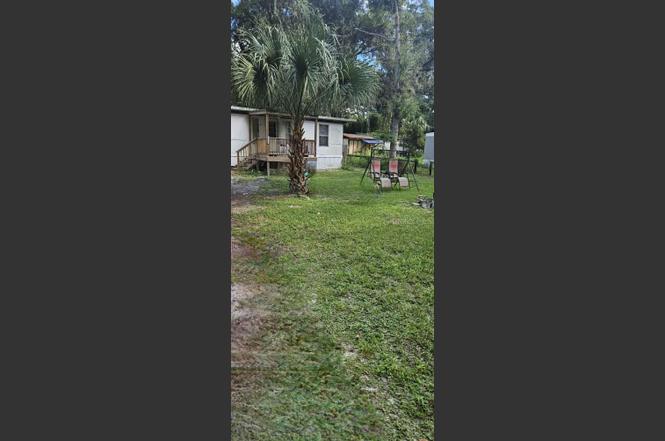
3111 NE 167th Pl · Reddick, FL
Flood risk 6/10 · Moderate
- FEMA flood zone
- X (unshaded)
- Chance of flooding over 30 yrs
- 0.73%
- Est. flood insurance / yr
- $507 – $1,088
Fire risk 6/10 · Moderate
- Est. fire insurance / yr
- $947 – $1,759
Heat risk 8/10 · Major
- Hot days now (above 108°F)
- 7 days/yr
- Hot days in 30 yrs
- 20 days/yr
Wind risk 9/10 · Severe
- Chance of severe wind over 30 yrs
- 99.0%
Air-quality risk 3/10 · Minor
- Unhealthy air days now
- 2 days/yr
- Unhealthy air days in 30 yrs
- 4 days/yr
Risk factors via First Street. Map © Google.
Why this score? — see what drove the C- grade
The composite is a weighted blend of 9 inputs, each scored 0–100. Each bar is that input's sub-score; the figure is the points it added to the 100-point composite (weight × sub-score).
- Cash flow +23.0/30.0
- ARV discount +7.5/15.0
- DSCR +7.4/10.0
- 1% rule +5.0/10.0
- Schools +3.6/10.0
- Livability +2.9/5.0
- Rent growth +2.5/5.0
- Condition / age +2.5/5.0
- Appreciation +0.0/10.0
$110,000
🖨 Deal sheet (PDF) 📄 Offer letter ✓ Due diligence
Listing remarks
TURN KEY FLASH SALE - Ready to Experience Farm Life in Citra, FL This perfect investment and income-generating property offers the peace of country living with everything brand new! Enjoy the charm of rural life while earning $1,200–$1,400 monthly in rental income. Property Highlights: Completely updated throughout – new laminate flooring, tile in kitchen, hallway, and bathroom New well and brand-new septic system | New electrical system and central A/C | Washer and dryer included | Perfect for investors, retior anyone seeking a peaceful lifestyle with steady income Embrace the tranquility of farm living with modern comforts — move-in ready and income-producing from
Key facts
- Updated throughout
- New well
- New septic system
Tags
Property features AI
Finance
- Other: Lot approximately 0.26 acres (100 x 90); Total acreage between 1/4 and less than 1/2 acre; Living area ~720 sq ft (public records); Building area ~672 sq ft (public records); Direction faces northeast
- Financial info: No lease restrictions; No investor-specific financial details provided
- HOA & community: No HOA
Exterior
- Parking: Parking details not provided
- Security: No specific security features listed
- Utilities: Well water; Septic tank; Electricity available and connected; Water available and connected; Sewer available and connected; Cable available
- Home design: Residential modular home; One level; Faces northeast
- Construction: Metal siding; Metal/other roof; Other foundation; Built as modular construction
- Exterior features: Balcony; Unimproved road access
Interior
- Kitchen: Range; Microwave; Refrigerator; Dishwasher not listed
- Bedrooms: 2 bedrooms
- Flooring: Ceramic tile; Laminate
- Bathrooms: 1 full bathroom
- Heating & cooling: Central heating (electric); Central air conditioning
- Interior features: Eat-in kitchen; Thermostat
- Laundry & utility: Washer; Dryer; Laundry area with corridor access
Neighborhood map
What this means for you Summary
Snapshot
- This is a 2-bed/1.0-bath manufactured listed at $110k.
Deal economics
- At list price, monthly cash flow is $196 ($2k/yr) — positive.
- The deal already cash-flows at list — no discount required.
- Meets the 1% rule at list price ($1k rent vs $110k).
- Recommended offer: $97k (12.0% below list) — sets the bar for market timing.
- Cap rate 8.4% vs local median 2.2% in Reddick — top-decile yield for the area; either an underpriced asset or a hidden risk that comps aren't pricing in. Stress-test before assuming the spread holds.
Location & tenants
- Location reads 58/100 on livability (#845 in FL) — a working-class tenant base; expect higher turnover. Strengths: cost of living A+, housing A+; Watch: crime D, amenities F, commute F.
- Marion (rural): math 42% / reading 43% proficiency, ranked #61 of 73 in FL (top 84%) — families likely to look elsewhere, expect single-tenant / working-renter base with shorter leases; 61% free/reduced lunch — lower-income household profile, screen leases tightly.
- Zoned schools: Sparr Elementary School (math 42% / reading 42%, grade F, #1,403 of 2,144 statewide, top 67%, 425 students, 67% FRL); North Marion Middle School (math 35% / reading 34%, grade F, #421 of 571 statewide, top 74%, 803 students, 72% FRL); North Marion High School (math 20% / reading 32%, grade F, #494 of 667 statewide, top 75%, 1,303 students, 66% FRL).
- Market conditions: 144 active listings in the ZIP; 1 comparable units currently listed for rent nearby; 7,071 units permitted in Marion County in 2024 (534 in 5+ unit buildings).
Forward outlook
- Local home prices are declining (-3.0%/yr); year-one equity from $761 of loan paydown is wiped out by about $3k of value loss. Plan a longer hold.
- Marion County population projected at +13% by 2050 — modest demand growth; plan on rents tracking national, not racing it.
Negotiation context
- It's been on market 171 days — a 12% lower offer ($97k) is reasonable based on typical stale-listing flexibility.
- 2 sale attempts; this cycle's ask has dropped $40k (27%) from the opening price — seller is motivated, your offer sets the floor, not the list.
- Current owner paid $25k; list at $110k implies a 340% gain — meaningful room to come down on a strong offer.
Risks & watch-outs
- Climate carrying-cost: major flood risk; severe wind risk, 99% chance of damaging wind over 30y; major wildfire risk; extreme-heat days projected 7→20/yr by 2055 (HVAC capex compounding) — expect insurance premiums to compound above CPI over the hold.
Questions for the listing agent
- It's been on market 171 days. Have you received any prior offers? Is the seller open to a 12% concession, seller financing, or rate buy-down credit?
- Why hasn't it sold? Are there any deal-killer items the seller is aware of (foundation, flood, title, zoning, code violations)?
- Is there a deadline driving the sale (1031 exchange, divorce, estate, relocation)? That informs how much negotiation room exists.
- Schools are D-rated, which usually means shorter tenancies and higher turnover. Who's the typical renter profile here, and what's been the actual vacancy rate?
- Crime grade is D in this area — have there been break-ins, vandalism, or insurance claims at this property in the last 3 years? What carrier currently insures it and at what premium?
- What's the average days-on-market for RENTAL listings here right now (not sales)? A rising rental-DOM trend means longer vacancies and softer asking-rent achievability than the comps imply.
- What's the recent tenant-quality profile in this submarket — average credit score on applications, eviction rate, late-payment / NSF rate, and stable-employment percentage? A property-management company in the area should have these aggregated.
- How much new for-sale + rental construction is in the pipeline within 1–3 miles? Heavy new supply typically softens prices + rents 12–24 months out; constrained supply supports both.
Investment metrics
- 1% rule
- 1.00% ✓
- Cap rate
- 8.43%
- Cash-on-cash
- 7.64%
- DSCR
- 1.34
- GRM
- 8.3
CMA / ARV
- ARV (on-the-fly)
- $52,416
- Comps found
- 1
Show comp detail 1 sale within ~0.75 mi
| Address | Dist | Beds/Ba | Sqft | Sold | Price | $/sf | Match |
|---|---|---|---|---|---|---|---|
| 3176 NE 164th Ln | 0.28mi | 2/2.0 | 742 (+10%) | 6mo | $58,000 | $78 | 60 |
Match score weights: distance 35% · size 25% · config 20% · recency 20%. Top-matched comps best support the ARV.
Projected returns pro-forma
-3.0% appreciation · 3.0% rent growth · sell at horizon
- IRR
- -4.7%
- Equity multiple
- 0.83×
- Total profit
- $-5,371
- Equity at exit
- $16,401
- IRR
- 5.0%
- Equity multiple
- 1.37×
- Total profit
- $11,257
- Equity at exit
- $9,511
Cash invested: $30,800 (down + closing). Projections, not guarantees.
Landlord ↔ Tenant lean methodology
- Overall (STATE)
- 87 Strongly Landlord-Friendly
- State Florida
- 87 Strongly Landlord-Friendly · R+3
- County
- — inherits STATE
- City
- — inherits STATE
ZIP-level market 32113
- Home prices YoY
- -5.5%
- Active inventory
- 144
- Price-to-rent
- 8.3×
Monthly cashflow live
- Estimated rent
- $1,100 medium interval (Pro) →
- Mortgage (P&I)
- −$577
- Tax from tax record
- −$50 /mo · $602/yr
- Insurance
- −$46
- HOA
- −$0
- Vacancy / Maint / Mgmt
- −$231
- Net cashflow
- $196
Break-even live
Sensitivity live
| Price | -10% $258 | -5% $227 | +0% $196 | +5% $165 | +10% $134 |
|---|---|---|---|---|---|
| Rent | -10% $109 | -5% $153 | +0% $196 | +5% $240 | +10% $283 |
| Rate | -1.0pp $252 | -0.5pp $224 | base $196 | +0.5pp $168 | +1.0pp $139 |
UW: 25.0% down · 7.5% · 30yr · 1.5% tax · 5.0% vac · 8.0% maint · 8.0% mgmt
Financing live
Cash to close
- Down payment
- $27,500
- Closing costs
- $3,300
- Reserves months
- —
- Total cash needed
- —
Loan-product check · same deal, 3 products live
Conventional
25% down · 7.5% · 30yr
- Down + closing
- —
- Monthly P&I
- —
- Monthly cashflow
- —
- DSCR
- —
- Eligible?
- —
Personal DTI + credit; lowest rate.
DSCR
20% down · 8.5% · 30yr
- Down + closing
- —
- Monthly P&I
- —
- Monthly cashflow
- —
- DSCR
- —
- Eligible?
- —
No personal income docs; deal must DSCR.
Hard money
10% down · 12.0% · 12mo
- Down + closing
- —
- Monthly P&I
- —
- Monthly cashflow
- —
- DSCR
- —
- Eligible?
- —
Short-term bridge; refi at stabilization.
Rent comps 1 comps
| Address | Beds | Baths | Sqft | Rent | $/sqft | DOM | Units | Dist |
|---|---|---|---|---|---|---|---|---|
| 17410 NE 37th Ct Citra, FL | 1.0 | 1.0 | 672 | $1,100 | $1.64 | 14d | 1 | 0.92mi |
Listing history 25 events
-
2026-06-22days on market $110,000 Active 171 DOM
-
2026-06-18days on market $110,000 Active 168 DOM
-
2026-06-17days on market $110,000 Active 167 DOM
-
2026-06-16days on market $110,000 Active 166 DOM
-
2026-06-15days on market $110,000 Active 165 DOM
-
2026-06-14days on market $110,000 Active 163 DOM
-
2026-06-13days on market $110,000 Active 162 DOM
-
2026-06-10days on market $110,000 Active 160 DOM
-
2026-06-09days on market $110,000 Active 159 DOM
-
2026-06-08days on market $110,000 Active 158 DOM
-
2026-06-07days on market $110,000 Active 157 DOM
-
2026-06-03days on market $110,000 Active 153 DOM
-
2026-06-02days on market $110,000 Active 152 DOM
-
2026-05-31days on market $110,000 Active 150 DOM
-
2026-05-30days on market $110,000 Active 149 DOM
-
2026-05-26status Active
-
2026-05-26price $110,000
-
2026-02-28price $90,000
-
2026-02-04price $121,599
-
2026-01-24price $125,530
-
2026-01-06price $128,950
-
2025-12-07price $137,950
-
2025-10-06$150,000 Active
-
1998-05-04soldstatus $25,000
-
1993-07-20soldstatus $26,500
ⓘ Source: listings_history table (triggers on properties + properties_extension) + one-shot
backfill from property_details.listing_events for pre-trigger history.
Tax reassessment forecast FL · Resets to sale price
- Current annual tax
- $602 · $50/mo
- Projected year-2 tax
- $913 · $76/mo
- Expected delta
- +$311/yr (+$26/mo · 51.6%)
ⓘ Screening estimate from a state-policy table — verify with the county assessor before closing.
Climate risk First Street
- Flood 6/10 Major FEMA zone X (unshaded) · 73% chance over 30 yrs
- Wildfire 6/10 Major
- Heat 8/10 Severe 7 d/yr ≥108°F today · 20 d/yr by 30 yrs out
- Wind 9/10 Extreme 99% chance of damaging wind over 30 yrs
- Air quality 3/10 Moderate 2 unhealthy d/yr today · 4 by 30 yrs out
Nearby sold comps map
Loading sold comps map…
Walkable amenities ~0.75 mi
Loading nearby amenities…
Taxation est. · year 1
- Rental income
- $13,200
- − Mortgage interest
- −$6,162
- − Property taxes
- −$602
- − Insurance
- −$550
- − Repairs & maintenance
- −$1,056
- − Management
- −$1,056
- − Depreciation
- −$3,200
- Taxable income
- $574
- Est. tax owed @ 24.0%
- −$138
- After-tax cash flow
- $2,216/yr
For passive investors: Depreciation is non-cash, so a rental often shows a tax loss while cash-flowing — sheltering income. Rental losses are passive: they offset passive income freely, and up to $25,000/yr can offset ordinary (W-2) income if you actively participate and your MAGI is under $100k (phasing out to $0 by $150k); unused losses carry forward. On sale, claimed depreciation is recaptured at up to 25%, and gains may owe capital-gains tax (a 1031 exchange can defer both). Figures are a year-1 estimate at your 24.0% rate — not tax advice; consult a CPA.
Schools (NCES district)
- District
- Marion
- NCES district ID
- 1201260
- Math proficiency
- 42% ▼ -7.00%
- Reading proficiency
- 43% ▼ -4.00%
- Median HH income
- $40,015
- Composite
- 35.61/100
- National rank
- #4890
- State rank
- #61 of 73 in FL
Livability — Reddick
- Score
- 58/100
- State rank
- #845
- US rank
- #21164
Category grades
Schools grade is shown separately in the Schools card above.
Census & demographics
- Population (ZIP)
- 5,382
Population outlook (Marion County) Hauer SSP2
- Today (2025)
- 365,905 people
- By 2030
- 376,768 · +3.0%
- By 2040
- 396,555 · +8.4%
- By 2050
- 412,723 · +12.8%
- By 2075
- 446,090 · +21.9%
- By 2100
- 436,193 · +19.2%
Race, ethnicity, and origin ACS 2023
- Neighborhood character
- Predominantly White (67%)
- Race & ethnicity
- White 67% Black 12% Two or more races 11% Hispanic / Latino 10%
- Hispanic origin (detail)
- Mexican 5% Puerto Rican 3% Cuban 1%
- Common ancestry
- Iranian 3% Serbian 2% Slovak 1%
- Foreign-born
- 3% · Canada
- Languages at home
- 93% English-only · Spanish 6% Other Indo-European 1%
Political lean MEDSL · Marion
- 2024 margin
- Solid R (+31.6) · D 33.8% · R 65.5%
- 2008→2024 swing
- -20.0pp toward R · 2008: -11.6pp · 2024: -31.6pp
- All cycles
- 2024: R+31.6 2020: R+25.9 2016: R+26.2 2012: R+16.2 2008: R+11.6
Not yet ingested
- Civics
- —
Market trends
- HPI YoY
- ▼ -16.68%
- Current HPI
- 284.1669
- Rent YoY
- —
- Metro
- —
- State GDP YoY
- ▲ 3.28%
- F500 in state
- 36
Industry mix (Fortune 500 HQ in FL)
| Industry | F500 HQs | Revenue |
|---|---|---|
| Industrial Technology | 2 | $29B |
|
||
| Insurance | 2 | $17B |
|
||
| Retail | 1 | $60B |
|
||
| Technology Distribution | 1 | $58B |
|
||
| Homebuilding | 1 | $35B |
|
||
| Technology Manufacturing | 1 | $35B |
|
||
Price history
+315.1% since first listed10 events — show timeline
- 2026-05-26 Relisted — Stellar MLS as Distributed by MLS Grid
- 2026-05-26 Price Changed $110,000 Stellar MLS as Distributed by MLS Grid
- 2026-02-28 Price Changed $90,000 Stellar MLS as Distributed by MLS Grid
- 2026-02-04 Price Changed $121,599 Stellar MLS as Distributed by MLS Grid
- 2026-01-24 Price Changed $125,530 Stellar MLS as Distributed by MLS Grid
- 2026-01-06 Price Changed $128,950 Stellar MLS as Distributed by MLS Grid
- 2025-12-07 Price Changed $137,950 Stellar MLS as Distributed by MLS Grid
- 2025-10-06 Listed $150,000 Stellar MLS as Distributed by MLS Grid
- 1998-05-04 Sold (Public Records) $25,000 Public Records
- 1993-07-20 Sold (Public Records) $26,500 Public Records
Property tax history
+11.6%/yrLatest (2025): $602 · +547.3% YoY. Source: county tax records.
Cash-flow waterfall
monthlySold comps — $/sqft
last 12 mo · ≤1 miLoading sold comps…