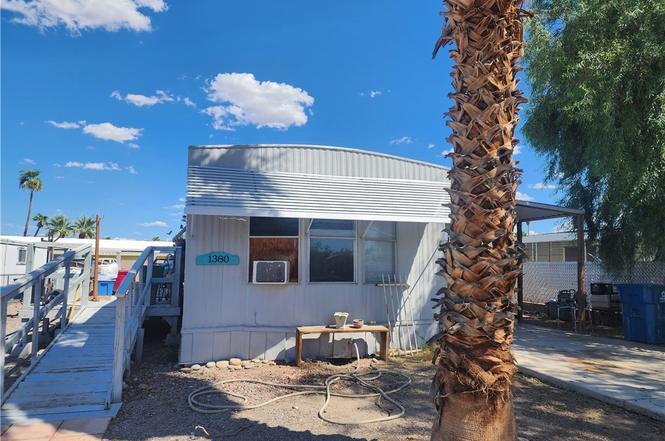
1380 Lincoln Ln · Bullhead City, AZ
Flood risk 6/10 · Moderate
- FEMA flood zone
- X (unshaded)
- Chance of flooding over 30 yrs
- 0.74%
- Est. flood insurance / yr
- $507 – $1,088
Fire risk 4/10 · Minor
- Est. fire insurance / yr
- $610 – $1,132
Heat risk 9/10 · Severe
- Hot days now (above 116°F)
- 7 days/yr
- Hot days in 30 yrs
- 16 days/yr
Wind risk 1/10 · Minimal
- Chance of severe wind over 30 yrs
- —
Air-quality risk 1/10 · Minimal
- Unhealthy air days now
- 0 days/yr
- Unhealthy air days in 30 yrs
- 0 days/yr
Risk factors via First Street. Map © Google.
Why this score? — see what drove the D+ grade
The composite is a weighted blend of 9 inputs, each scored 0–100. Each bar is that input's sub-score; the figure is the points it added to the 100-point composite (weight × sub-score).
- Cash flow +20.8/30.0
- ARV discount +7.5/15.0
- DSCR +6.6/10.0
- 1% rule +4.1/10.0
- Livability +3.2/5.0
- Condition / age +2.5/5.0
- Rent growth +2.3/5.0
- Schools +1.6/10.0
- Appreciation +0.0/10.0
$130,000
🖨 Deal sheet (PDF) 📄 Offer letter ✓ Due diligence
Listing remarks
THIS CUTE MOBILE NEEDS SOME TLC! LOCATED JUST ONE BLOCK FROM THE RIVER. LOTS OF PARKING. FENCED YARD.
Key facts
- Fenced yard
- Lots of parking
- 4,792 sq ft lot
Tags
Property features AI
Exterior
- Utilities: Public water; Public sewer; Natural gas available; Underground utilities
- Home design: Manufactured home (single wide); Residential property
- Construction: Rolled/hot mop roof
- Exterior features: Chain link fencing; Has a view
Interior
- Kitchen: Dishwasher
- Bedrooms: Manufactured home configuration (single wide)
- Bathrooms: 2 full bathrooms
- Heating & cooling: Central heating (natural gas); Central air conditioning (electric)
- Interior features: Laminate counters; Open kitchen with casual dining
- Laundry & utility: Washer; Dryer
Neighborhood map
What this means for you Summary
Snapshot
- This is a 2-bed/2.0-bath land listed at $130k.
Deal economics
- At list price, monthly cash flow is $177 ($2k/yr) — positive.
- The deal already cash-flows at list — no discount required.
- To meet the 1% rule (rent ≥ 1% of price), the offer needs to be $119k (8.8% below list).
- Recommended offer: $114k (12.0% below list) — sets the bar for market timing.
- Cap rate 7.9% vs local median 3.7% in Bullhead City — top-decile yield for the area; either an underpriced asset or a hidden risk that comps aren't pricing in. Stress-test before assuming the spread holds.
Location & tenants
- Location reads 64/100 on livability (#103 in AZ) — a middle-class / working-renter tenant base. Strengths: cost of living A+, housing A+; Watch: health & safety C-, employment D, crime D-.
- Bullhead City School District (4378) (town): math 16% / reading 22% proficiency, ranked #189 of 249 in AZ (top 76%) — low school quality limits family demand, transient renter base, plan for 1-2y turnover; 68% free/reduced lunch — lower-income household profile, screen leases tightly.
- Zoned schools: Bullhead City Middle School (math 14% / reading 23%, grade F, #140 of 218 statewide, top 65%, 508 students, 78% FRL); Mohave High School (math 14% / reading 21%, grade F, #245 of 381 statewide, top 65%, 1,175 students, 51% FRL) — zoned schools at 64% FRL track the district average.
- Market conditions: Rents soft (-0.9%/yr); 713 active listings in the ZIP; 14 comparable units currently listed for rent nearby; rentals at typical pace (median 15d on market — plan ~3-4 weeks tenant-placement turnaround); 2,543 units permitted in Mohave County in 2024 (33 in 5+ unit buildings).
Forward outlook
- Local home prices are declining (-3.0%/yr); year-one equity from $899 of loan paydown is wiped out by about $4k of value loss. Plan a longer hold.
- Mohave County population projected to shrink 6% by 2050 — rents likely to lag national; underwrite the cash flow, not the appreciation.
Negotiation context
- It's been on market 284 days — a 12% lower offer ($114k) is reasonable based on typical stale-listing flexibility.
- Current owner paid $57k; list at $130k implies a 128% gain — meaningful room to come down on a strong offer.
Risks & watch-outs
- Climate carrying-cost: major flood risk; extreme-heat days projected 7→16/yr by 2055 (HVAC capex compounding) — expect insurance premiums to compound above CPI over the hold.
Questions for the listing agent
- It's been on market 284 days. Have you received any prior offers? Is the seller open to a 12% concession, seller financing, or rate buy-down credit?
- Why hasn't it sold? Are there any deal-killer items the seller is aware of (foundation, flood, title, zoning, code violations)?
- Is there a deadline driving the sale (1031 exchange, divorce, estate, relocation)? That informs how much negotiation room exists.
- Schools are F-rated, which usually means shorter tenancies and higher turnover. Who's the typical renter profile here, and what's been the actual vacancy rate?
- Crime grade is D in this area — have there been break-ins, vandalism, or insurance claims at this property in the last 3 years? What carrier currently insures it and at what premium?
- The area grade is low — what's the realistic commute time and amenity access for the typical tenant pool here? Any planned neighborhood developments (good or bad) we should know about?
- What's the average days-on-market for RENTAL listings here right now (not sales)? A rising rental-DOM trend means longer vacancies and softer asking-rent achievability than the comps imply.
- What's the recent tenant-quality profile in this submarket — average credit score on applications, eviction rate, late-payment / NSF rate, and stable-employment percentage? A property-management company in the area should have these aggregated.
- How much new for-sale + rental construction is in the pipeline within 1–3 miles? Heavy new supply typically softens prices + rents 12–24 months out; constrained supply supports both.
Investment metrics
- 1% rule
- 0.91% ✗
- Cap rate
- 7.93%
- Cash-on-cash
- 5.85%
- DSCR
- 1.26
- GRM
- 9.1
CMA / ARV
No comps found within radius.
Projected returns pro-forma
-3.0% appreciation · 0.0% rent growth · sell at horizon
- IRR
- -10.3%
- Equity multiple
- 0.63×
- Total profit
- $-13,304
- Equity at exit
- $19,383
- IRR
- -5.1%
- Equity multiple
- 0.71×
- Total profit
- $-10,731
- Equity at exit
- $11,240
Cash invested: $36,400 (down + closing). Projections, not guarantees.
Landlord ↔ Tenant lean methodology
- Overall (STATE)
- 87 Strongly Landlord-Friendly
- State Arizona
- 87 Strongly Landlord-Friendly · R+3
- County
- — inherits STATE
- City
- — inherits STATE
ZIP-level market 86442
- Home prices YoY
- -27.0%
- Rents YoY
- -0.9%
- Active inventory
- 713
- Price-to-rent
- 9.1×
Monthly cashflow live
- Estimated rent
- $1,185 high interval (Pro) →
- Mortgage (P&I)
- −$682
- Tax from tax record
- −$23 /mo · $276/yr
- Insurance
- −$54
- HOA
- −$0
- Vacancy / Maint / Mgmt
- −$249
- Net cashflow
- $177
Break-even live
Sensitivity live
| Price | -10% $251 | -5% $214 | +0% $177 | +5% $141 | +10% $-52 |
|---|---|---|---|---|---|
| Rent | -10% $84 | -5% $131 | +0% $177 | +5% $224 | +10% $271 |
| Rate | -1.0pp $243 | -0.5pp $211 | base $177 | +0.5pp $144 | +1.0pp $110 |
UW: 25.0% down · 7.5% · 30yr · 1.5% tax · 5.0% vac · 8.0% maint · 8.0% mgmt
Financing live
Cash to close
- Down payment
- $32,500
- Closing costs
- $3,900
- Reserves months
- —
- Total cash needed
- —
Loan-product check · same deal, 3 products live
Conventional
25% down · 7.5% · 30yr
- Down + closing
- —
- Monthly P&I
- —
- Monthly cashflow
- —
- DSCR
- —
- Eligible?
- —
Personal DTI + credit; lowest rate.
DSCR
20% down · 8.5% · 30yr
- Down + closing
- —
- Monthly P&I
- —
- Monthly cashflow
- —
- DSCR
- —
- Eligible?
- —
No personal income docs; deal must DSCR.
Hard money
10% down · 12.0% · 12mo
- Down + closing
- —
- Monthly P&I
- —
- Monthly cashflow
- —
- DSCR
- —
- Eligible?
- —
Short-term bridge; refi at stabilization.
Rent comps 14 comps
| Address | Beds | Baths | Sqft | Rent | $/sqft | DOM | Units | Dist |
|---|---|---|---|---|---|---|---|---|
| 1336 Ramar Rd Bullhead City, AZ | 1.0 | 1.0 | 750 | $750 | $1.00 | 9d | 1 | 0.22mi |
| 1489 Church Dr Bullhead City, AZ | 1.0 | 1.0 | 672 | $1,100 | $1.64 | 15d | 1 | 0.32mi |
| 1190 Ramar Rd Unit F52 Bullhead City, AZ | 2.0 | 1.0 | 846 | $1,000 | $1.18 | 15d | 1 | 0.40mi |
| 1190 Ramar Rd Unit C21 Bullhead City, AZ | 2.0 | 2.0 | 858 | $1,200 | $1.40 | 15d | 1 | 0.40mi |
| 1190 Ramar Rd Bullhead City, AZ | 1.0–2.0 | 1.0–2.0 | 735 | $1,050 | $1.43 | 22d | 1 | 0.40mi |
| 1645 Palma Cir W Bullhead City, AZ | 2.0 | 1.0 | 682 | $950 | $1.39 | 15d | 1 | 0.50mi |
| 1066 Mobile Ln Bullhead City, AZ | 2.0 | 2.0 | 931 | $1,250 | $1.34 | 15d | 1 | 0.54mi |
| 1453 Luna Ln Bullhead City, AZ | 2.0 | 1.0 | 1050 | $1,500 | $1.43 | 15d | 1 | 0.78mi |
| 945 Holly St Bullhead City, AZ | 2.0 | 1.0 | 967 | $1,295 | $1.34 | 15d | 1 | 0.78mi |
| 813 Gemstone Ave Bullhead City, AZ | 2.0 | 2.0 | 1000 | $1,200 | $1.20 | 15d | 1 | 1.13mi |
| 1663 Hwy 95 Bullhead, AZ | 1.0 | 1.0 | 688 | $1,700 | $2.47 | 15d | 1 | 1.32mi |
| 1663 Highway 95 Unit C11 Bullhead City, AZ | 2.0 | 2.0 | 1014 | $1,800 | $1.78 | 15d | 1 | 1.33mi |
| 3550 Bay Sands Dr Laughlin, NV | 1.0–2.0 | 1.0–2.0 | 820 | $1,400 | $1.71 | 25d | 4 | 1.43mi |
| 3550 Bay Sands Dr Laughlin, NV | 1.0–2.0 | 1.0–2.0 | 820 | $1,400 | $1.71 | 12d | 5 | 1.43mi |
Listing history 21 events
-
2026-06-21days on market $130,000 Active 284 DOM
-
2026-06-18days on market $130,000 Active 281 DOM
-
2026-06-17days on market $130,000 Active 280 DOM
-
2026-06-16days on market $130,000 Active 279 DOM
-
2026-06-15days on market $130,000 Active 278 DOM
-
2026-06-14days on market $130,000 Active 276 DOM
-
2026-06-13days on market $130,000 Active 275 DOM
-
2026-06-10days on market $130,000 Active 273 DOM
-
2026-06-09days on market $130,000 Active 272 DOM
-
2026-06-08days on market $130,000 Active 271 DOM
-
2026-06-07days on market $130,000 Active 270 DOM
-
2026-06-05days on market $130,000 Active 267 DOM
-
2026-06-02days on market $130,000 Active 265 DOM
-
2026-06-01days on market $130,000 Active 264 DOM
-
2026-05-31days on market $130,000 Active 263 DOM
-
2026-05-30days on market $130,000 Active 262 DOM
-
2025-09-10$130,000 Active
-
2005-01-03soldstatus $56,900
-
2001-04-23soldstatus $27,500
-
2001-04-23soldstatus $27,500
-
1995-02-28soldstatus $29,000
ⓘ Source: listings_history table (triggers on properties + properties_extension) + one-shot
backfill from property_details.listing_events for pre-trigger history.
Tax reassessment forecast AZ · Resets to sale price
- Current annual tax
- $276 · $23/mo
- Projected year-2 tax
- $858 · $72/mo
- Expected delta
- +$582/yr (+$48/mo · 210.6%)
ⓘ Screening estimate from a state-policy table — verify with the county assessor before closing.
Climate risk First Street
- Flood 6/10 Major FEMA zone X (unshaded) · 74% chance over 30 yrs
- Wildfire 4/10 Moderate
- Heat 9/10 Extreme 7 d/yr ≥116°F today · 16 d/yr by 30 yrs out
- Wind 1/10 Low
- Air quality 1/10 Low 0 unhealthy d/yr today · 0 by 30 yrs out
Nearby sold comps map
Loading sold comps map…
Walkable amenities ~0.75 mi
Loading nearby amenities…
Taxation est. · year 1
- Rental income
- $14,223
- − Mortgage interest
- −$7,282
- − Property taxes
- −$276
- − Insurance
- −$650
- − Repairs & maintenance
- −$1,138
- − Management
- −$1,138
- − Depreciation
- −$3,782
- Taxable loss
- −$42
- Est. tax savings @ 24.0%
- +$10
- After-tax cash flow
- $2,140/yr
For passive investors: Depreciation is non-cash, so a rental often shows a tax loss while cash-flowing — sheltering income. Rental losses are passive: they offset passive income freely, and up to $25,000/yr can offset ordinary (W-2) income if you actively participate and your MAGI is under $100k (phasing out to $0 by $150k); unused losses carry forward. On sale, claimed depreciation is recaptured at up to 25%, and gains may owe capital-gains tax (a 1031 exchange can defer both). Figures are a year-1 estimate at your 24.0% rate — not tax advice; consult a CPA.
Schools (NCES district)
- District
- Bullhead City School District (4378)
- NCES district ID
- 0401500
- Math proficiency
- 16% ▼ -11.00%
- Reading proficiency
- 22% ▼ -6.00%
- Median HH income
- $37,109
- Composite
- 15.83/100
- National rank
- #9263
- State rank
- #189 of 249 in AZ
Livability — Bullhead City
- Score
- 64/100
- State rank
- #103
- US rank
- #14458
Category grades
Schools grade is shown separately in the Schools card above.
Census & demographics
- Census place
- Bullhead City, AZ
- County
- Mohave County · 181,906 people
- City population
- 43,354
- Metro
- Lake Havasu City-Kingman, AZ
- Population (ZIP)
- 34,735
- Household income
- $48,081
- Rent vs Own
- Severe rent burden
- 1040.0
Population outlook (Mohave County) Hauer SSP2
- Today (2025)
- 209,184 people
- By 2030
- 209,674 · +0.2%
- By 2040
- 205,897 · -1.6%
- By 2050
- 196,810 · -5.9%
- By 2075
- 169,454 · -19.0%
- By 2100
- 136,630 · -34.7%
Race, ethnicity, and origin ACS 2023
- Neighborhood character
- Predominantly White (68%)
- Race & ethnicity
- White 68% Hispanic / Latino 22% Two or more races 12% Black 2% Asian 2%
- Hispanic origin (detail)
- Mexican 19%
- Common ancestry
- Portuguese 3% Romanian 2% Lithuanian 2%
- Foreign-born
- 9% · Canada, South Korea
- Languages at home
- 87% English-only · Spanish 11%
Political lean MEDSL · Mohave
- 2024 margin
- Solid R (+55.8) · D 21.8% · R 77.6%
- 2008→2024 swing
- -22.9pp toward R · 2008: -32.9pp · 2024: -55.8pp
- All cycles
- 2024: R+55.8 2020: R+51.3 2016: R+51.5 2012: R+42.6 2008: R+32.9
Not yet ingested
- Civics
- —
Market trends
- HPI YoY
- ▼ -100.11%
- Current HPI
- 270.3297
- Rent YoY
- ▼ -0.90%
- Metro
- Lake Havasu City-Kingman, AZ
- State GDP YoY
- ▲ 4.54%
- F500 in state
- 20
Industry mix (Fortune 500 HQ in AZ)
| Industry | F500 HQs | Revenue |
|---|---|---|
| Technology | 2 | $13B |
|
||
| Mining / Metals | 1 | $23B |
|
||
| Environmental Services | 1 | $16B |
|
||
| Metals / Steel | 1 | $14B |
|
||
| Technology Distribution | 1 | $9B |
|
||
| Homebuilding | 1 | $8B |
|
||
Price history
+348.3% since first listed5 events — show timeline
- 2025-09-10 Listed $130,000 WARDEX
- 2005-01-03 Sold (Public Records) $56,900 Public Records
- 2001-04-23 Sold (Public Records) $27,500 Public Records
- 2001-04-23 Sold (Public Records) $27,500 Public Records
- 1995-02-28 Sold (Public Records) $29,000 Public Records
Property tax history
+1.8%/yrLatest (2025): $276 · +3.3% YoY. Source: county tax records.
Cash-flow waterfall
monthlySold comps — $/sqft
last 12 mo · ≤1 miLoading sold comps…