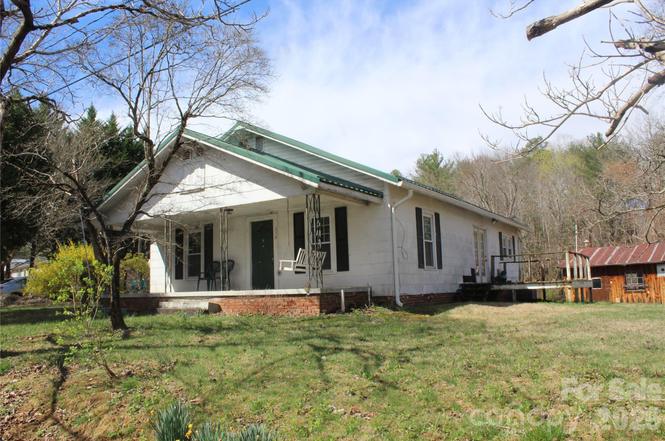
113 Williams Way · Drexel, NC
Flood risk 1/10 · Minimal
- FEMA flood zone
- X (unshaded)
- Chance of flooding over 30 yrs
- 0.0%
- Est. flood insurance / yr
- $507 – $1,088
Fire risk 4/10 · Minor
- Est. fire insurance / yr
- $906 – $1,684
Heat risk 5/10 · Moderate
- Hot days now (above 101°F)
- 7 days/yr
- Hot days in 30 yrs
- 18 days/yr
Wind risk 2/10 · Minimal
- Chance of severe wind over 30 yrs
- 1.0%
Air-quality risk 2/10 · Minimal
- Unhealthy air days now
- 2 days/yr
- Unhealthy air days in 30 yrs
- 2 days/yr
Risk factors via First Street. Map © Google.
Why this score? — see what drove the D+ grade
The composite is a weighted blend of 9 inputs, each scored 0–100. Each bar is that input's sub-score; the figure is the points it added to the 100-point composite (weight × sub-score).
- ARV discount +15.0/15.0
- Cash flow +14.7/30.0
- DSCR +4.5/10.0
- Schools +3.8/10.0
- Livability +3.4/5.0
- 1% rule +3.0/10.0
- Rent growth +2.5/5.0
- Condition / age +2.5/5.0
- Appreciation +0.0/10.0
$199,900
🖨 Deal sheet 📄 Offer letter ✓ Due diligence
Listing remarks
Don't miss out on this charming cottage-style home in the city limits of Drexel! Home features three-bedrooms and one bathroom with a living room and kitchen. Enjoy your morning coffee on the front porch. washer and dryer on back porch, not heated. The property also features a large 24x36 detached workshop with electricity, perfect for hobbyists or extra storage. Detached single garage for parking. Convenient to downtown Drexel and US Hwy 70 for easy access to surrounding areas. heated 1340 sq. feet
Key facts
- 0.6 acre lot
- Garage
- Built 1915
Property features AI
Finance
- HOA & community: No HOA
Exterior
- Parking: Detached carport; Detached garage with 1 garage space; Main level garage
- Utilities: Public water; County sewer
- Home design: Single family residence; Residential property; One story; Entry level at 1; Zoning: R-12
- Construction: Site built construction; Asbestos construction material; No foundation details specified; Shingle roof not specified
- Exterior features: Gravel road access; Publicly maintained road; Land included (0.6 acre)
Interior
- Kitchen: Dishwasher; Electric range; Freezer; Refrigerator
- Bedrooms: 3 bedrooms on the main level
- Bathrooms: 1 full bathroom on the main level
- Heating & cooling: Heat pump for heating and cooling
- Interior features: 3 total rooms; Fireplace; Basement (other)
- Laundry & utility: Washer and dryer included; Laundry on the porch
Neighborhood map
What this means for you Summary
Snapshot
- This is a 3-bed/1.0-bath single-family listed at $200k.
Deal economics
- At list price, monthly cash flow is $50 ($596/yr) — positive.
- The deal already cash-flows at list — no discount required.
- To meet the 1% rule (rent ≥ 1% of price), the offer needs to be $160k (19.7% below list).
- Recommended offer: $160k (19.7% below list) — sets the bar for 1% rule.
- Cap rate 6.6% vs local median 4.3% in Drexel — top-decile yield for the area; either an underpriced asset or a hidden risk that comps aren't pricing in. Stress-test before assuming the spread holds.
Location & tenants
- Location reads 68/100 on livability (#208 in NC) — a middle-class / working-renter tenant base. Strengths: crime A+, cost of living A+, housing A+; Watch: amenities F, commute F.
- Burke County Schools (rural): math 43% / reading 47% proficiency, ranked #89 of 178 in NC (top 50%) — families likely to look elsewhere, expect single-tenant / working-renter base with shorter leases.
- Zoned schools: Drexel Elementary (math 49% / reading 47%, grade D, #477 of 1,410 statewide, top 35%, 438 students, 77% FRL); Jimmy C Draughn High School (math 57% / reading 67%, grade B-, #184 of 535 statewide, top 37%, 682 students, 51% FRL).
- Market conditions: 431 active listings in the ZIP; 422 units permitted in Burke County in 2024 (94 in 5+ unit buildings).
- This rent runs 33% of the median local income ($58k/yr) — at the standard rent-burdened threshold; future hikes will face affordability resistance.
Forward outlook
- Local home prices are declining (-3.0%/yr); year-one equity from $1k of loan paydown is wiped out by about $6k of value loss. Plan a longer hold.
- Burke County population projected at -18% by 2050 — secular population decline; favor cash flow + early exit over multi-decade hold.
Negotiation context
- It's been on market 129 days — a 12% lower offer ($176k) is reasonable based on typical stale-listing flexibility.
- Current owner paid $61k; list at $200k implies a 228% gain — meaningful room to come down on a strong offer.
Risks & watch-outs
- Watch-outs: built in 1915 — expect roof / HVAC / electrical / plumbing capex.
- Climate carrying-cost: extreme-heat days projected 7→18/yr by 2055 (HVAC capex compounding) — expect insurance premiums to compound above CPI over the hold.
Questions for the listing agent
- It's been on market 129 days. Have you received any prior offers? Is the seller open to a 20% concession, seller financing, or rate buy-down credit?
- Built in 1915 — when were the roof, HVAC, electrical panel, plumbing, and water heater last replaced?
- Why hasn't it sold? Are there any deal-killer items the seller is aware of (foundation, flood, title, zoning, code violations)?
- Is there a deadline driving the sale (1031 exchange, divorce, estate, relocation)? That informs how much negotiation room exists.
- Schools are F-rated, which usually means shorter tenancies and higher turnover. Who's the typical renter profile here, and what's been the actual vacancy rate?
- The area grade is low — what's the realistic commute time and amenity access for the typical tenant pool here? Any planned neighborhood developments (good or bad) we should know about?
- What's the average days-on-market for RENTAL listings here right now (not sales)? A rising rental-DOM trend means longer vacancies and softer asking-rent achievability than the comps imply.
- What's the recent tenant-quality profile in this submarket — average credit score on applications, eviction rate, late-payment / NSF rate, and stable-employment percentage? A property-management company in the area should have these aggregated.
- How much new for-sale + rental construction is in the pipeline within 1–3 miles? Heavy new supply typically softens prices + rents 12–24 months out; constrained supply supports both.
Investment metrics
- 1% rule
- 0.80% ✗
- Cap rate
- 6.59%
- Cash-on-cash
- 1.06%
- DSCR
- 1.05
- GRM
- 10.4
CMA / ARV
- ARV (on-the-fly)
- $266,640
- Comps found
- 6
Show comp detail 6 sales within ~0.75 mi
| Address | Dist | Beds/Ba | Sqft | Sold | Price | $/sf | Match |
|---|---|---|---|---|---|---|---|
| 1761 Dearborn Street Ext | 0.34mi | 2/1.0 (-1) | 1,290 (-2%) | 2mo | $264,900 | $205 | 74 |
| 108 Powell Rd | 0.14mi | 2/1.0 (-1) | 1,248 (-6%) | 16mo | $230,000 | $184 | 66 |
| 111 Baxter St | 0.51mi | 3/2.0 | 1,442 (+9%) | 3mo | $308,000 | $214 | 54 |
| 1627 Amherst Rd | 0.55mi | 3/2.0 | 1,152 (-13%) | 16mo | $232,500 | $202 | 36 |
| 1662 Rawleigh St | 0.48mi | 3/2.0 | 1,152 (-13%) | 23mo | $180,000 | $156 | 33 |
| 404 Park Ave | 0.71mi | 3/2.0 | 1,177 (-11%) | 21mo | $223,400 | $190 | 28 |
Match score weights: distance 35% · size 25% · config 20% · recency 20%. Top-matched comps best support the ARV.
Projected returns pro-forma
-3.0% appreciation · 3.0% rent growth · sell at horizon
- IRR
- -14.6%
- Equity multiple
- 0.48×
- Total profit
- $-29,305
- Equity at exit
- $29,806
- IRR
- -6.0%
- Equity multiple
- 0.61×
- Total profit
- $-21,755
- Equity at exit
- $17,284
Cash invested: $55,972 (down + closing). Projections, not guarantees.
Landlord ↔ Tenant lean methodology
- Overall (STATE)
- 85 Strongly Landlord-Friendly
- State North Carolina
- 85 Strongly Landlord-Friendly · R+3
- County
- — inherits STATE
- City
- — inherits STATE
ZIP-level market 28655
- Home prices YoY
- -13.2%
- Active inventory
- 431
- Price-to-rent
- 10.4×
Monthly cashflow live
- Estimated rent
- $1,604 medium interval (Pro) →
- Mortgage (P&I)
- −$1,048
- Tax from tax record
- −$86 /mo · $1,033/yr
- Insurance
- −$83
- HOA
- −$0
- Vacancy / Maint / Mgmt
- −$337
- Net cashflow
- $50
Break-even live
UW: 25.0% down · 7.5% · 30yr · 1.5% tax · 5.0% vac · 8.0% maint · 8.0% mgmt
Financing live
Cash to close
- Down payment
- $49,975
- Closing costs
- $5,997
- Reserves months
- —
- Total cash needed
- —
Loan-product check · same deal, 3 products live
Conventional
25% down · 7.5% · 30yr
- Down + closing
- —
- Monthly P&I
- —
- Monthly cashflow
- —
- DSCR
- —
- Eligible?
- —
Personal DTI + credit; lowest rate.
DSCR
20% down · 8.5% · 30yr
- Down + closing
- —
- Monthly P&I
- —
- Monthly cashflow
- —
- DSCR
- —
- Eligible?
- —
No personal income docs; deal must DSCR.
Hard money
10% down · 12.0% · 12mo
- Down + closing
- —
- Monthly P&I
- —
- Monthly cashflow
- —
- DSCR
- —
- Eligible?
- —
Short-term bridge; refi at stabilization.
Listing history 19 events
-
2026-06-19days on market $199,900 Active 129 DOM
-
2026-06-18days on market $199,900 Active 128 DOM
-
2026-06-17days on market $199,900 Active 127 DOM
-
2026-06-16days on market $199,900 Active 126 DOM
-
2026-06-15days on market $199,900 Active 125 DOM
-
2026-06-14days on market $199,900 Active 123 DOM
-
2026-06-13days on market $199,900 Active 122 DOM
-
2026-06-10days on market $199,900 Active 120 DOM
-
2026-06-09days on market $199,900 Active 119 DOM
-
2026-06-08days on market $199,900 Active 118 DOM
-
2026-06-07days on market $199,900 Active 117 DOM
-
2026-06-05days on market $199,900 Active 114 DOM
-
2026-06-02days on market $199,900 Active 112 DOM
-
2026-06-01days on market $199,900 Active 111 DOM
-
2026-05-31days on market $199,900 Active 110 DOM
-
2026-05-30days on market $199,900 Active 109 DOM
-
2026-03-11price $199,900
-
2026-02-09$209,900 Active
-
1998-08-27soldstatus $61,000
ⓘ Source: listings_history table (triggers on properties + properties_extension) + one-shot
backfill from property_details.listing_events for pre-trigger history.
Tax reassessment forecast NC · Resets to sale price
- Current annual tax
- $1,033 · $86/mo
- Projected year-2 tax
- $1,639 · $137/mo
- Expected delta
- +$606/yr (+$51/mo · 58.7%)
ⓘ Screening estimate from a state-policy table — verify with the county assessor before closing.
Climate risk First Street
- Flood 1/10 Low FEMA zone X (unshaded) · 0% chance over 30 yrs
- Wildfire 4/10 Moderate
- Heat 5/10 Major 7 d/yr ≥101°F today · 18 d/yr by 30 yrs out
- Wind 2/10 Low 100% chance of damaging wind over 30 yrs
- Air quality 2/10 Low 2 unhealthy d/yr today · 2 by 30 yrs out
Nearby sold comps map
Loading sold comps map…
Walkable amenities ~0.75 mi
Loading nearby amenities…
Taxation est. · year 1
- Rental income
- $19,251
- − Mortgage interest
- −$11,198
- − Property taxes
- −$1,033
- − Insurance
- −$1,000
- − Repairs & maintenance
- −$1,540
- − Management
- −$1,540
- − Depreciation
- −$5,815
- Taxable loss
- −$2,875
- Est. tax savings @ 24.0%
- +$690
- After-tax cash flow
- $1,286/yr
For passive investors: Depreciation is non-cash, so a rental often shows a tax loss while cash-flowing — sheltering income. Rental losses are passive: they offset passive income freely, and up to $25,000/yr can offset ordinary (W-2) income if you actively participate and your MAGI is under $100k (phasing out to $0 by $150k); unused losses carry forward. On sale, claimed depreciation is recaptured at up to 25%, and gains may owe capital-gains tax (a 1031 exchange can defer both). Figures are a year-1 estimate at your 24.0% rate — not tax advice; consult a CPA.
Schools (NCES district)
- District
- Burke County Schools
- NCES district ID
- 3700480
- Math proficiency
- 43% ▼ -2.00%
- Reading proficiency
- 47% ▬ 0.00%
- Median HH income
- $38,342
- Composite
- 37.51/100
- National rank
- #4400
- State rank
- #89 of 178 in NC
Livability — Drexel
- Score
- 68/100
- State rank
- #208
- US rank
- #10084
Category grades
Schools grade is shown separately in the Schools card above.
Census & demographics
- Census place
- Drexel, NC
- County
- Burke County · 55,100 people
- City population
- 457
- Metro
- Hickory-Lenoir-Morganton, NC
- Population (ZIP)
- 55,100
- Household income
- $57,713
- Rent vs Own
- Severe rent burden
- 1145.0
Population outlook (Burke County) Hauer SSP2
- Today (2025)
- 86,552 people
- By 2030
- 84,123 · -2.8%
- By 2040
- 78,165 · -9.7%
- By 2050
- 71,099 · -17.9%
- By 2075
- 56,264 · -35.0%
- By 2100
- 44,742 · -48.3%
Race, ethnicity, and origin ACS 2023
- Neighborhood character
- Predominantly White (75%)
- Race & ethnicity
- White 75% Hispanic / Latino 11% Black 8% Two or more races 5% Asian 3% Native American 2%
- Hispanic origin (detail)
- Mexican 3%
- Common ancestry
- Slovak 2% Italian 2% Serbian 2%
- Foreign-born
- 7% · Canada, China
- Languages at home
- 87% English-only · Spanish 8% Other Asian/Pacific 1% Arabic 1%
Political lean MEDSL · Burke
- 2024 margin
- Solid R (+41.2) · D 29.0% · R 70.3%
- 2008→2024 swing
- -22.0pp toward R · 2008: -19.2pp · 2024: -41.2pp
- All cycles
- 2024: R+41.2 2020: R+40.1 2016: R+39.4 2012: R+23.6 2008: R+19.2
Not yet ingested
- Civics
- —
Market trends
- HPI YoY
- ▼ -55.07%
- Current HPI
- 362.0732
- Rent YoY
- —
- Metro
- Hickory-Lenoir-Morganton, NC
- State GDP YoY
- ▲ 3.28%
- F500 in state
- 26
Industry mix (Fortune 500 HQ in NC)
| Industry | F500 HQs | Revenue |
|---|---|---|
| Financial Services | 2 | $213B |
|
||
| Retail | 2 | $95B |
|
||
| Industrial Conglomerate | 1 | $38B |
|
||
| Metals / Steel | 1 | $35B |
|
||
| Utilities | 1 | $30B |
|
||
| Industrial Machinery | 1 | $19B |
|
||
Price history
+227.7% since first listed3 events — show timeline
- 2026-03-11 Price Changed $199,900 CANOPYMLS as Distributed by MLS Grid
- 2026-02-09 Listed $209,900 CANOPYMLS as Distributed by MLS Grid
- 1998-08-27 Sold (Public Records) $61,000 Public Records
Property tax history
+5.7%/yrLatest (2025): $1,033 · +53.7% YoY. Source: county tax records.
Cash-flow waterfall
monthlySold comps — $/sqft
last 12 mo · ≤1 miLoading sold comps…