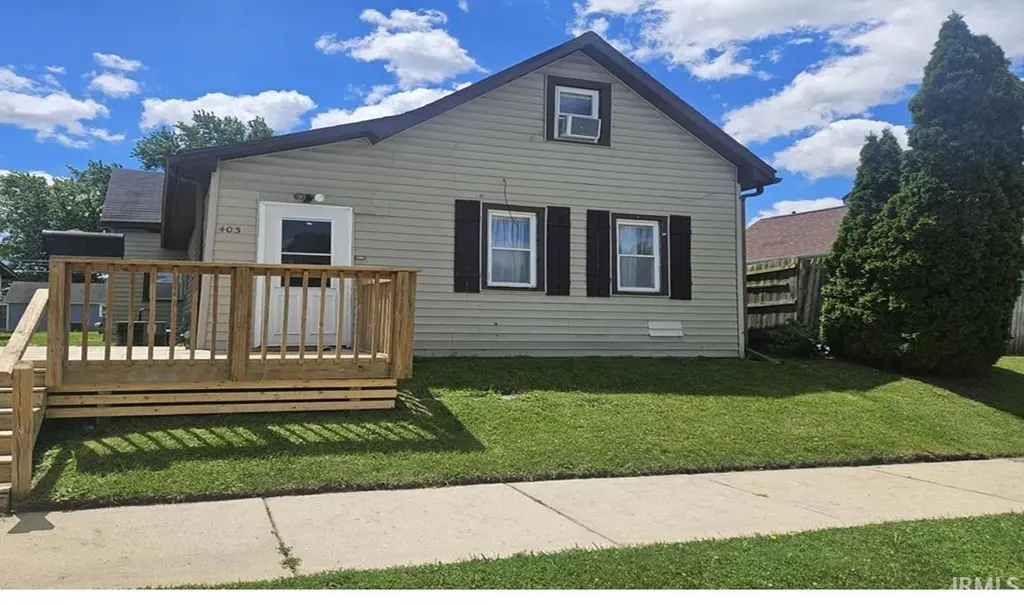
403 W Armstrong St · Frankfort, IN
Flood risk 1/10 · Minimal
- FEMA flood zone
- X (unshaded)
- Chance of flooding over 30 yrs
- 0.0%
- Est. flood insurance / yr
- $507 – $1,088
Fire risk 1/10 · Minimal
- Est. fire insurance / yr
- $717 – $1,331
Heat risk 3/10 · Minor
- Hot days now (above 101°F)
- 7 days/yr
- Hot days in 30 yrs
- 18 days/yr
Wind risk 2/10 · Minimal
- Chance of severe wind over 30 yrs
- —
Air-quality risk 3/10 · Minor
- Unhealthy air days now
- 2 days/yr
- Unhealthy air days in 30 yrs
- 3 days/yr
Risk factors via First Street. Map © Google.
Why this score? — see what drove the D- grade
The composite is a weighted blend of 9 inputs, each scored 0–100. Each bar is that input's sub-score; the figure is the points it added to the 100-point composite (weight × sub-score).
- ARV discount +15.0/15.0
- Cash flow +7.8/30.0
- Livability +3.7/5.0
- Rent growth +2.5/5.0
- Condition / age +2.5/5.0
- 1% rule +2.4/10.0
- Schools +2.4/10.0
- DSCR +1.9/10.0
- Appreciation +0.0/10.0
$159,900
🖨 Deal sheet (PDF) 📄 Offer letter ✓ Due diligence
Listing remarks
Nicely remodeled and updated home. Enter into the enclosed front porch area into the huge living/dining room. In the kitchen, you will see the appliancces included, the possible eat-in kitchen, built-in shelving and the new countertop. The laundry room includes the washer and dryer. The downstairs bedroom has an extended seating area as well as the sleeping quarters. Upstairs are 2 additional bedrooms. One of the bedrooms has a loft area with so many possibilities. 3 (or more) parking spots in the back and a storage shed. Make this your own.
Key facts
- New countertop
- Eat-in kitchen
- Built-in shelving
Tags
Property features AI
Finance
- Other: Approximately 8 total rooms
Exterior
- Parking: Off-street parking; No garage
- Utilities: Public water; Public sewer; Public power
- Home design: Single-family residence (site-built); One story; Faces: unspecified
- Construction: Vinyl siding; Block foundation; Shingle roof; Built as site-built home
- Exterior features: Deck; Porch; Partial privacy fencing; Shed(s); Sloped lot
Interior
- Kitchen: Refrigerator; Gas range
- Bedrooms: Bedrooms: see room count
- Flooring: Laminate flooring; Vinyl flooring
- Bathrooms: One full bathroom (main level)
- Heating & cooling: Natural gas heating; Forced air heating; Ceiling heating; Window cooling unit(s)
- Interior features: Built-in features; Unfinished basement
- Laundry & utility: Washer hookup (main level); Electric dryer hookup; Gas water heater
Neighborhood map
What this means for you Summary
Snapshot
- This is a 2-bed/1.0-bath single-family listed at $160k.
Deal economics
- At list price, monthly cash flow is $-175 ($-2k/yr) — negative.
- To cash-flow at today's rent, offer at most $135k (15.9% below list).
- To meet the 1% rule (rent ≥ 1% of price), the offer needs to be $118k (26.4% below list).
- Recommended offer: $118k (26.4% below list) — sets the bar for 1% rule.
- Cap rate 5.0% vs local median 3.9% in Frankfort — meaningfully above typical; check what's discounted (condition, days-on-market, listing class) to confirm the premium yield is real.
Location & tenants
- Location reads 73/100 on livability (#107 in IN) — a middle-class / working-renter tenant base. Strengths: crime A+, cost of living A+, housing A+; Watch: amenities F, commute F, employment D-.
- Community Schools Of Frankfort (rural): math 27% / reading 30% proficiency, ranked #251 of 301 in IN (top 83%) — low school quality limits family demand, transient renter base, plan for 1-2y turnover; 68% free/reduced lunch — lower-income household profile, screen leases tightly.
- Zoned schools: Frankfort Middle School (math 19% / reading 27%, grade F, #263 of 330 statewide, top 80%, 706 students, 83% FRL); Frankfort High School (math 8% / reading 42%, grade F, #323 of 369 statewide, top 88%, 895 students, 75% FRL).
- Market conditions: 129 active listings in the ZIP; 59 units permitted in Clinton County in 2024 (0 in 5+ unit buildings).
Forward outlook
- Local home prices are declining (-3.0%/yr); year-one equity from $1k of loan paydown is wiped out by about $5k of value loss. Plan a longer hold.
- Clinton County population projected at -15% by 2050 — secular population decline; favor cash flow + early exit over multi-decade hold.
Negotiation context
- Only 2 days on market — expect competitive offers; lowballing is unlikely to land.
Risks & watch-outs
- Watch-outs: built in 1944 — expect roof / HVAC / electrical / plumbing capex.
Questions for the listing agent
- What do current leases actually rent for vs. the listed asking? Can we see a recent rent roll and the last 12 months of T-12 income?
- Built in 1944 — when were the roof, HVAC, electrical panel, plumbing, and water heater last replaced?
- Is there a deadline driving the sale (1031 exchange, divorce, estate, relocation)? That informs how much negotiation room exists.
- Schools are F-rated, which usually means shorter tenancies and higher turnover. Who's the typical renter profile here, and what's been the actual vacancy rate?
- The area grade is low — what's the realistic commute time and amenity access for the typical tenant pool here? Any planned neighborhood developments (good or bad) we should know about?
- What's the average days-on-market for RENTAL listings here right now (not sales)? A rising rental-DOM trend means longer vacancies and softer asking-rent achievability than the comps imply.
- What's the recent tenant-quality profile in this submarket — average credit score on applications, eviction rate, late-payment / NSF rate, and stable-employment percentage? A property-management company in the area should have these aggregated.
- How much new for-sale + rental construction is in the pipeline within 1–3 miles? Heavy new supply typically softens prices + rents 12–24 months out; constrained supply supports both.
Investment metrics
- 1% rule
- 0.74% ✗
- Cap rate
- 4.98%
- Cash-on-cash
- -4.70%
- DSCR
- 0.79
- GRM
- 11.3
CMA / ARV
- ARV (on-the-fly)
- $197,072
- Comps found
- 12
Show comp detail 12 sales within ~0.75 mi
| Address | Dist | Beds/Ba | Sqft | Sold | Price | $/sf | Match |
|---|---|---|---|---|---|---|---|
| 1002 Short 4th St | 0.28mi | 3/1.0 (+1) | 1,747 (-3%) | 2mo | $133,500 | $76 | 75 |
| 59 W White St | 0.54mi | 2/2.0 | 1,820 (+1%) | 1mo | $199,000 | $109 | 69 |
| 406 S Harrison St | 0.41mi | 2/2.0 | 1,800 (-0%) | 11mo | $185,000 | $103 | 67 |
| 309 W Morrison St | 0.52mi | 3/1.0 (+1) | 1,905 (+5%) | 2mo | $217,000 | $114 | 60 |
| 601 S Clay St | 0.48mi | 3/2.0 (+1) | 1,894 (+5%) | 3mo | $163,500 | $86 | 58 |
| 457 W Morrison St | 0.52mi | 3/1.0 (+1) | 1,743 (-4%) | 10mo | $205,000 | $118 | 56 |
| 862 S Jackson St. St | 0.31mi | 3/1.0 (+1) | 1,538 (-15%) | 0mo | $197,000 | $128 | 55 |
| 600 S Clay St | 0.46mi | 3/2.0 (+1) | 1,891 (+5%) | 10mo | $240,000 | $127 | 53 |
| 608 Fisher St | 0.64mi | 2/2.0 | 1,670 (-8%) | 1mo | $241,000 | $144 | 53 |
| 458 Main Ave | 0.32mi | 3/1.5 (+1) | 2,006 (+11%) | 9mo | $157,000 | $78 | 52 |
| 552 Elmwood Dr | 0.70mi | 2/1.0 | 1,605 (-11%) | 8mo | $154,500 | $96 | 42 |
| 751 E Armstrong St | 0.62mi | 3/1.0 (+1) | 2,074 (+15%) | 13mo | $127,500 | $61 | 30 |
Match score weights: distance 35% · size 25% · config 20% · recency 20%. Top-matched comps best support the ARV.
Projected returns pro-forma
-3.0% appreciation · 3.0% rent growth · sell at horizon
- IRR
- -24.3%
- Equity multiple
- 0.17×
- Total profit
- $-37,066
- Equity at exit
- $23,842
- IRR
- -19.6%
- Equity multiple
- -0.04×
- Total profit
- $-46,591
- Equity at exit
- $13,825
Cash invested: $44,772 (down + closing). Projections, not guarantees.
Landlord ↔ Tenant lean methodology
- Overall (STATE)
- 90 Strongly Landlord-Friendly
- State Indiana
- 90 Strongly Landlord-Friendly · R+11
- County
- — inherits STATE
- City
- — inherits STATE
ZIP-level market 46041
- Home prices YoY
- -17.8%
- Active inventory
- 129
- Price-to-rent
- 11.3×
Monthly cashflow live
- Estimated rent
- $1,177 medium interval (Pro) →
- Mortgage (P&I)
- −$839
- Tax est. 1.5%
- −$200 /mo · $2,398/yr
- Insurance
- −$67
- HOA
- −$0
- Vacancy / Maint / Mgmt
- −$247
- Net cashflow
- $-175
Break-even live
Sensitivity live
| Price | -10% $-65 | -5% $-120 | +0% $-175 | +5% $-231 | +10% $-286 |
|---|---|---|---|---|---|
| Rent | -10% $-268 | -5% $-222 | +0% $-175 | +5% $-129 | +10% $-82 |
| Rate | -1.0pp $-95 | -0.5pp $-135 | base $-175 | +0.5pp $-217 | +1.0pp $-259 |
UW: 25.0% down · 7.5% · 30yr · 1.5% tax · 5.0% vac · 8.0% maint · 8.0% mgmt
Financing live
Cash to close
- Down payment
- $39,975
- Closing costs
- $4,797
- Reserves months
- —
- Total cash needed
- —
Loan-product check · same deal, 3 products live
Conventional
25% down · 7.5% · 30yr
- Down + closing
- —
- Monthly P&I
- —
- Monthly cashflow
- —
- DSCR
- —
- Eligible?
- —
Personal DTI + credit; lowest rate.
DSCR
20% down · 8.5% · 30yr
- Down + closing
- —
- Monthly P&I
- —
- Monthly cashflow
- —
- DSCR
- —
- Eligible?
- —
No personal income docs; deal must DSCR.
Hard money
10% down · 12.0% · 12mo
- Down + closing
- —
- Monthly P&I
- —
- Monthly cashflow
- —
- DSCR
- —
- Eligible?
- —
Short-term bridge; refi at stabilization.
Listing history 3 events
-
2026-06-21days on market $159,900 Active 2 DOM
-
2026-06-18remarks 547-char remark
-
2026-06-18$159,900 Active 1 DOM
ⓘ Source: listings_history table (triggers on properties + properties_extension) + one-shot
backfill from property_details.listing_events for pre-trigger history.
Climate risk First Street
- Flood 1/10 Low FEMA zone X (unshaded) · 0% chance over 30 yrs
- Wildfire 1/10 Low
- Heat 3/10 Moderate 7 d/yr ≥101°F today · 18 d/yr by 30 yrs out
- Wind 2/10 Low
- Air quality 3/10 Moderate 2 unhealthy d/yr today · 3 by 30 yrs out
Nearby sold comps map
Loading sold comps map…
Walkable amenities ~0.75 mi
Loading nearby amenities…
Taxation est. · year 1
- Rental income
- $14,121
- − Mortgage interest
- −$8,957
- − Property taxes
- −$2,398
- − Insurance
- −$800
- − Repairs & maintenance
- −$1,130
- − Management
- −$1,130
- − Depreciation
- −$4,652
- Taxable loss
- −$4,945
- Est. tax savings @ 24.0%
- +$1,187
- After-tax cash flow
- $-918/yr
For passive investors: Depreciation is non-cash, so a rental often shows a tax loss while cash-flowing — sheltering income. Rental losses are passive: they offset passive income freely, and up to $25,000/yr can offset ordinary (W-2) income if you actively participate and your MAGI is under $100k (phasing out to $0 by $150k); unused losses carry forward. On sale, claimed depreciation is recaptured at up to 25%, and gains may owe capital-gains tax (a 1031 exchange can defer both). Figures are a year-1 estimate at your 24.0% rate — not tax advice; consult a CPA.
Schools (NCES district)
- District
- Community Schools Of Frankfort
- NCES district ID
- 1803660
- Math proficiency
- 27% ▼ -3.00%
- Reading proficiency
- 30% ▼ -6.00%
- Median HH income
- $42,144
- Composite
- 24.2/100
- National rank
- #7728
- State rank
- #251 of 301 in IN
Livability — Frankfort
- Score
- 73/100
- State rank
- #107
- US rank
- #5623
Category grades
Schools grade is shown separately in the Schools card above.
Census & demographics
- Census place
- Frankfort, IN
- Population (ZIP)
- 23,359
Population outlook (Clinton County) Hauer SSP2
- Today (2025)
- 31,197 people
- By 2030
- 30,257 · -3.0%
- By 2040
- 28,383 · -9.0%
- By 2050
- 26,644 · -14.6%
- By 2075
- 23,858 · -23.5%
- By 2100
- 22,236 · -28.7%
Race, ethnicity, and origin ACS 2023
- Neighborhood character
- Predominantly White (73%)
- Race & ethnicity
- White 73% Hispanic / Latino 24% Two or more races 11%
- Hispanic origin (detail)
- Mexican 22%
- Common ancestry
- Iranian 1% Italian 1% Slovak 1%
- Foreign-born
- 11% · Canada, Philippines
- Languages at home
- 86% English-only · Spanish 14%
Political lean MEDSL · Clinton
- 2024 margin
- Solid R (+48.0) · D 25.2% · R 73.2% · Other 1.6%
- 2008→2024 swing
- -35.0pp toward R · 2008: -13.0pp · 2024: -48.0pp
- All cycles
- 2024: R+48.0 2020: R+46.1 2016: R+48.0 2012: R+30.7 2008: R+13.0
Not yet ingested
- Civics
- —
Market trends
- HPI YoY
- ▼ -57.02%
- Current HPI
- 263.2258
- Rent YoY
- —
- Metro
- —
- State GDP YoY
- ▲ 2.90%
- F500 in state
- 18
Industry mix (Fortune 500 HQ in IN)
| Industry | F500 HQs | Revenue |
|---|---|---|
| Industrial Machinery | 2 | $37B |
|
||
| Healthcare | 1 | $177B |
|
||
| Pharmaceuticals | 1 | $45B |
|
||
| Metals / Steel | 1 | $18B |
|
||
| Agriculture | 1 | $17B |
|
||
| Packaging | 1 | $12B |
|
||
Price history
1 event — show timeline
- 2026-06-17 Listed $159,900 IRMLS
Property tax history
-22.3%/yrLatest (2024): $15 · +0.0% YoY. Source: county tax records.
Cash-flow waterfall
monthlySold comps — $/sqft
last 12 mo · ≤1 miLoading sold comps…