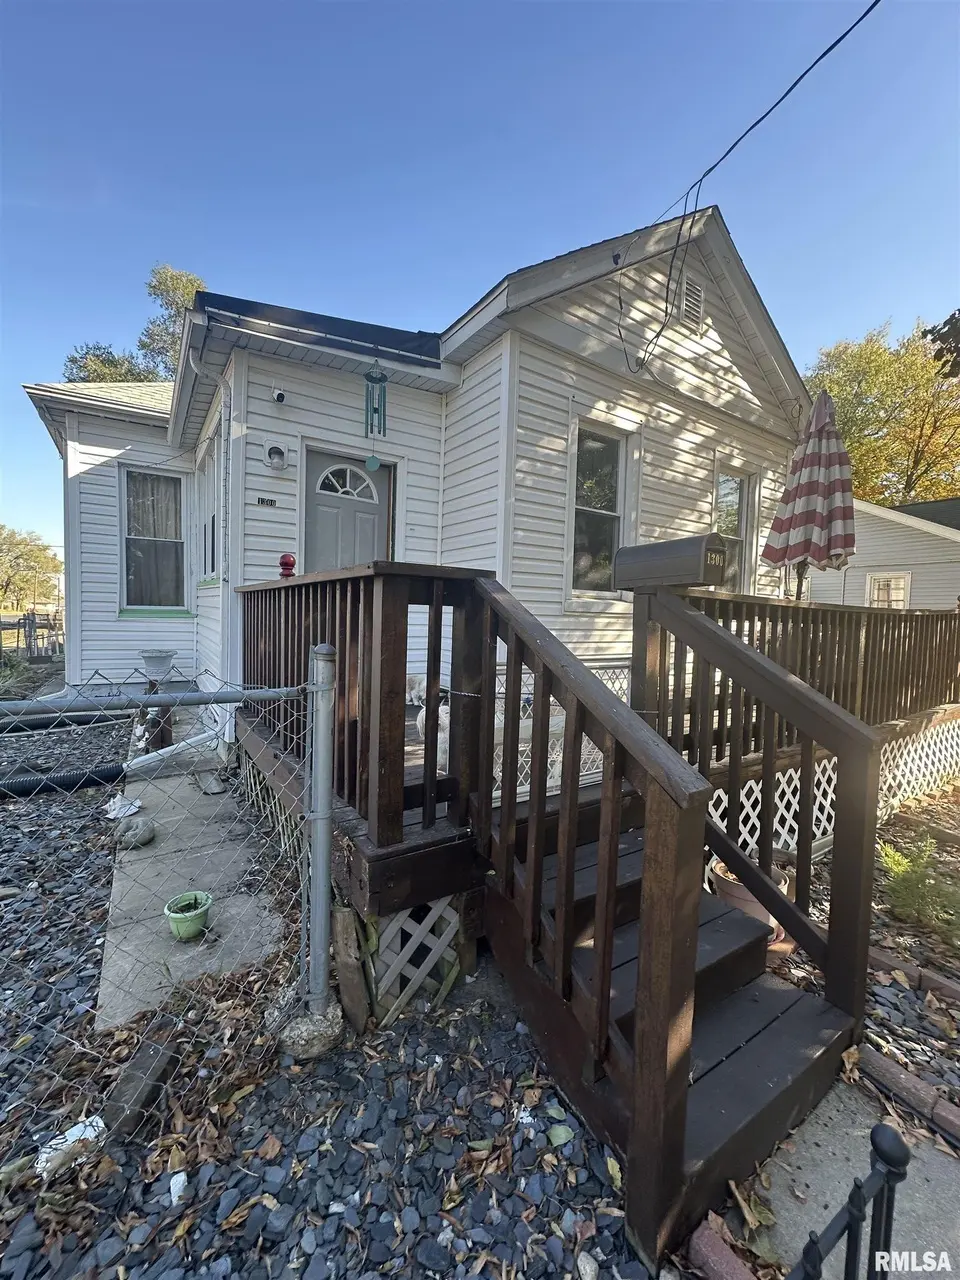
1300 S Greenlawn Ave · Peoria, IL
Flood risk 1/10 · Minimal
- FEMA flood zone
- X
- Chance of flooding over 30 yrs
- 0.0%
- Est. flood insurance / yr
- $507 – $1,088
Fire risk 1/10 · Minimal
- Est. fire insurance / yr
- $804 – $1,492
Heat risk 3/10 · Minor
- Hot days now (above 105°F)
- 7 days/yr
- Hot days in 30 yrs
- 18 days/yr
Wind risk 2/10 · Minimal
- Chance of severe wind over 30 yrs
- 1.0%
Air-quality risk 3/10 · Minor
- Unhealthy air days now
- 1 days/yr
- Unhealthy air days in 30 yrs
- 3 days/yr
Risk factors via First Street. Map © Google.
Why this score? — see what drove the B grade
The composite is a weighted blend of 9 inputs, each scored 0–100. Each bar is that input's sub-score; the figure is the points it added to the 100-point composite (weight × sub-score).
- Cash flow +30.0/30.0
- 1% rule +10.0/10.0
- DSCR +10.0/10.0
- ARV discount +7.5/15.0
- Appreciation +5.3/10.0
- Livability +3.7/5.0
- Rent growth +2.5/5.0
- Condition / age +2.5/5.0
- Schools +1.1/10.0
$55,000
🖨 Deal sheet (PDF) 📄 Offer letter ✓ Due diligence
Listing remarks MLS
Wow! great opportunity to have a corner lot home plus additional lot 126 x30 each lot. fenced backyard with fruit trees ( peach and apple) .all the updates have done from you.- great for started home or investment opportunity. Since owner bought the home many upgrades in the home: central air, siding, roof, flooring, fenced yard, appliances, plumbing, electrical, water softener- owned- filter system for the water in the kitchen, outside concrete path in a side of the home with pipes installed to protect the foundation ( side of the lot). Some personal properties can be sold if buyer wants (bill of sale)- such as: mower and ice breaker, furnitures ,etc- Refrigerator ,range/oven, microwave, water softener and washer and dryer stays with the home. Measurements are approximates and no guaranty.
Key facts
- Corner lot home
- Water softener
- Filter system
Tags
Neighborhood map
What this means for you Summary
Snapshot
- This is a 3-bed/1.0-bath single-family listed at $55k.
Deal economics
- At list price, monthly cash flow is $538 ($6k/yr) — positive.
- The deal already cash-flows at list — no discount required.
- Meets the 1% rule at list price ($1k rent vs $55k).
- Recommended offer: $48k (12.0% below list) — sets the bar for market timing.
- Cap rate 18.0% vs local median 5.6% in Peoria — top-decile yield for the area; either an underpriced asset or a hidden risk that comps aren't pricing in. Stress-test before assuming the spread holds.
Location & tenants
- Location reads 73/100 on livability (#270 in IL) — a middle-class / working-renter tenant base. Strengths: commute A+, cost of living A+, housing A+; Watch: employment D+, schools F, crime F.
- Peoria SD 150 (urban): math 11% / reading 14% proficiency, ranked #554 of 620 in IL (top 89%) — low school quality limits family demand, transient renter base, plan for 1-2y turnover; 70% free/reduced lunch — lower-income household profile, screen leases tightly.
- Market conditions: 42 active listings in the ZIP; 16 comparable units currently listed for rent nearby; rentals at typical pace (median 15d on market — plan ~3-4 weeks tenant-placement turnaround); lower-income renter base — watch delinquency; 73 units permitted in Peoria County in 2024 (0 in 5+ unit buildings).
- At $1,093/mo this rent would consume 50% of the median local household income ($26k/yr) (locally 1385% of renters already pay >50% of income on rent) — very limited rent-growth headroom before tenants either downsize or default.
Forward outlook
- In year one you build about $728 of equity ($380 loan paydown + $348 appreciation (0.6% local appreciation)).
- Peoria County population projected at -11% by 2050 — secular population decline; favor cash flow + early exit over multi-decade hold.
- At projected returns (0.6% appreciation + 3.0% rent growth), your $15k cash investment doubles in ~3 years — after that, you're playing with house money.
Negotiation context
- It's been on market 234 days — a 12% lower offer ($48k) is reasonable based on typical stale-listing flexibility.
- Current owner paid $18k; list at $55k implies a 206% gain — meaningful room to come down on a strong offer.
Risks & watch-outs
- Watch-outs: built in 1900 — expect roof / HVAC / electrical / plumbing capex.
Questions for the listing agent
- It's been on market 234 days. Have you received any prior offers? Is the seller open to a 12% concession, seller financing, or rate buy-down credit?
- Built in 1900 — when were the roof, HVAC, electrical panel, plumbing, and water heater last replaced?
- Why hasn't it sold? Are there any deal-killer items the seller is aware of (foundation, flood, title, zoning, code violations)?
- Is there a deadline driving the sale (1031 exchange, divorce, estate, relocation)? That informs how much negotiation room exists.
- Schools are F-rated, which usually means shorter tenancies and higher turnover. Who's the typical renter profile here, and what's been the actual vacancy rate?
- Crime grade is F in this area — have there been break-ins, vandalism, or insurance claims at this property in the last 3 years? What carrier currently insures it and at what premium?
- What's the average days-on-market for RENTAL listings here right now (not sales)? A rising rental-DOM trend means longer vacancies and softer asking-rent achievability than the comps imply.
- What's the recent tenant-quality profile in this submarket — average credit score on applications, eviction rate, late-payment / NSF rate, and stable-employment percentage? A property-management company in the area should have these aggregated.
- How much new for-sale + rental construction is in the pipeline within 1–3 miles? Heavy new supply typically softens prices + rents 12–24 months out; constrained supply supports both.
Investment metrics
- 1% rule
- 1.99% ✓
- Cap rate
- 18.03%
- Cash-on-cash
- 41.93%
- DSCR
- 2.87
- GRM
- 4.2
CMA / ARV
- ARV (median comp)
- $30,304
- List price
- $55,000
- Delta
- 81.49%
- Verdict
- OVERPRICED
- Comps
- 20 within 1.0 mi
Show comp detail 12 sales within ~0.75 mi
| Address | Dist | Beds/Ba | Sqft | Sold | Price | $/sf | Match |
|---|---|---|---|---|---|---|---|
| 2005 W Antoinette St | 0.32mi | 4/1.0 (+1) | 1,324 (+1%) | 7mo | $50,000 | $38 | 72 |
| 1927 W Proctor St | 0.37mi | 3/1.0 | 1,344 (+2%) | 8mo | $30,000 | $22 | 72 |
| 806 S Greenlawn Ave | 0.42mi | 2/1.0 (-1) | 1,368 (+4%) | 3mo | $36,000 | $26 | 66 |
| 3001 SW Jefferson Ave | 0.10mi | 2/1.0 (-1) | 1,166 (-11%) | 8mo | $15,000 | $13 | 66 |
| 2107 W Wiswall St | 0.53mi | 3/1.0 | 1,408 (+7%) | 6mo | $33,000 | $23 | 58 |
| 924 S Warren St | 0.35mi | 2/1.0 (-1) | 1,162 (-11%) | 2mo | $39,000 | $34 | 58 |
| 1307 S Blaine St | 0.04mi | 2/1.0 (-1) | 1,120 (-15%) | 14mo | $34,750 | $31 | 57 |
| 1529 S Arago St | 0.52mi | 2/1.0 (-1) | 1,180 (-10%) | 5mo | $55,000 | $47 | 50 |
| 1509 S Arago St | 0.49mi | 2/1.0 (-1) | 1,456 (+11%) | 8mo | $49,900 | $34 | 47 |
| 435 S Madison Park Ter | 0.70mi | 3/1.0 | 1,218 (-7%) | 10mo | $35,000 | $29 | 47 |
| 1208 W George St | 0.62mi | 2/1.0 (-1) | 1,212 (-8%) | 12mo | $27,000 | $22 | 44 |
| 2324 W Wiswall St | 0.63mi | 3/1.0 | 1,500 (+14%) | 10mo | $27,500 | $18 | 38 |
Match score weights: distance 35% · size 25% · config 20% · recency 20%. Top-matched comps best support the ARV.
Projected returns pro-forma
0.63% appreciation · 3.0% rent growth · sell at horizon
- IRR
- 44.0%
- Equity multiple
- 3.23×
- Total profit
- $34,304
- Equity at exit
- $17,732
- IRR
- 46.2%
- Equity multiple
- 6.39×
- Total profit
- $83,074
- Equity at exit
- $22,778
Cash invested: $15,400 (down + closing). Projections, not guarantees.
Landlord ↔ Tenant lean methodology
- Overall (STATE)
- 43 Moderately Tenant-Leaning
- State Illinois
- 43 Moderately Tenant-Leaning · D+7
- County
- — inherits STATE
- City
- — inherits STATE
ZIP-level market 61605
- Home prices YoY
- 0.4%
- Active inventory
- 42
- Price-to-rent
- 4.2×
Monthly cashflow live
- Estimated rent
- $1,093 high interval (Pro) →
- Mortgage (P&I)
- −$288
- Tax from tax record
- −$14 /mo · $168/yr
- Insurance
- −$23
- HOA
- −$0
- Vacancy / Maint / Mgmt
- −$230
- Net cashflow
- $538
Break-even live
Sensitivity live
| Price | -10% $569 | -5% $554 | +0% $538 | +5% $523 | +10% $507 |
|---|---|---|---|---|---|
| Rent | -10% $452 | -5% $495 | +0% $538 | +5% $581 | +10% $624 |
| Rate | -1.0pp $566 | -0.5pp $552 | base $538 | +0.5pp $524 | +1.0pp $509 |
UW: 25.0% down · 7.5% · 30yr · 1.5% tax · 5.0% vac · 8.0% maint · 8.0% mgmt
Financing live
Cash to close
- Down payment
- $13,750
- Closing costs
- $1,650
- Reserves months
- —
- Total cash needed
- —
Loan-product check · same deal, 3 products live
Conventional
25% down · 7.5% · 30yr
- Down + closing
- —
- Monthly P&I
- —
- Monthly cashflow
- —
- DSCR
- —
- Eligible?
- —
Personal DTI + credit; lowest rate.
DSCR
20% down · 8.5% · 30yr
- Down + closing
- —
- Monthly P&I
- —
- Monthly cashflow
- —
- DSCR
- —
- Eligible?
- —
No personal income docs; deal must DSCR.
Hard money
10% down · 12.0% · 12mo
- Down + closing
- —
- Monthly P&I
- —
- Monthly cashflow
- —
- DSCR
- —
- Eligible?
- —
Short-term bridge; refi at stabilization.
Rent comps 16 comps
| Address | Beds | Baths | Sqft | Rent | $/sqft | DOM | Units | Dist |
|---|---|---|---|---|---|---|---|---|
| 928 S Matthew St Peoria, IL | 2.0 | 1.0 | 1080 | $748 | $0.69 | 14d | 1 | 0.32mi |
| 945 S Shelley St Peoria, IL | 1.0–3.0 | 1.0–2.0 | 929 | $1,025 | $1.10 | 14d | 1 | 0.39mi |
| 2116 W Proctor St Peoria, IL | 2.0 | 1.0 | 912 | $879 | $0.96 | 14d | 1 | 0.41mi |
| 2320 W Garden St Peoria, IL | 2.0 | 1.0 | 1096 | $1,000 | $0.91 | 44d | 1 | 0.44mi |
| 1540 W Kettelle St Peoria, IL | 3.0 | 1.0 | 1001 | $748 | $0.75 | 14d | 1 | 0.77mi |
| 2804 W Humboldt St Peoria, IL | 3.0 | 1.0 | 1060 | $995 | $0.94 | 14d | 1 | 0.81mi |
| 1214 W Butler St Peoria, IL | 4.0 | 1.0 | 1440 | $795 | $0.55 | 44d | 1 | 0.83mi |
| 2807 W Howett St Peoria, IL | 3.0 | 2.0 | 1388 | $1,550 | $1.12 | 44d | 1 | 0.89mi |
| 102 N Cedar Ave West Peoria, IL | 4.0 | 1.0 | 1272 | $995 | $0.78 | 44d | 1 | 1.04mi |
| 3001 W Wiswall St Peoria, IL | 2.0 | 1.0 | 1000 | $1,100 | $1.10 | 14d | 1 | 1.06mi |
| 2916 W Meidroth St Peoria, IL | 2.0 | 1.0 | 1125 | $1,049 | $0.93 | 22d | 1 | 1.12mi |
| 214 Pecan St Peoria, IL | 2.0 | 1.0 | 1050 | $1,595 | $1.52 | 14d | 1 | 1.13mi |
| 3031 W Wiswall St Peoria, IL | 2.0 | 1.0 | 1100 | $1,100 | $1.00 | 14d | 1 | 1.13mi |
| 1401 W Adrian G Hinton Ave Peoria, IL | 2.0 | 1.0 | 1100 | $775 | $0.70 | 44d | 1 | 1.13mi |
| 1816 W Callender Ave Peoria, IL | 3.0 | 2.0 | 1628 | $1,650 | $1.01 | 44d | 1 | 1.34mi |
| 1723 W Fredonia Ave Peoria, IL | 4.0 | 2.5 | 1219 | $2,100 | $1.72 | 14d | 1 | 1.50mi |
Listing history 19 events
-
2026-06-19days on market $55,000 Active 234 DOM
-
2026-06-18days on market $55,000 Active 233 DOM
-
2026-06-17days on market $55,000 Active 232 DOM
-
2026-06-16days on market $55,000 Active 231 DOM
-
2026-06-15days on market $55,000 Active 230 DOM
-
2026-06-14days on market $55,000 Active 228 DOM
-
2026-06-13days on market $55,000 Active 227 DOM
-
2026-06-10days on market $55,000 Active 225 DOM
-
2026-06-09days on market $55,000 Active 224 DOM
-
2026-06-08days on market $55,000 Active 223 DOM
-
2026-06-07days on market $55,000 Active 222 DOM
-
2026-06-03days on market $55,000 Active 218 DOM
-
2026-06-02days on market $55,000 Active 217 DOM
-
2026-06-01days on market $55,000 Active 216 DOM
-
2026-05-31days on market $55,000 Active 215 DOM
-
2026-05-30days on market $55,000 Active 214 DOM
-
2026-01-06price $55,000 804-char remark
Show marketing remark (804 chars)
Wow! great opportunity to have a corner lot home plus additional lot 126 x30 each lot. fenced backyard with fruit trees ( peach and apple) .all the updates have done from you.- great for started home or investment opportunity. Since owner bought the home many upgrades in the home: central air, siding, roof, flooring, fenced yard, appliances, plumbing, electrical, water softener- owned- filter system for the water in the kitchen, outside concrete path in a side of the home with pipes installed to protect the foundation ( side of the lot). Some personal properties can be sold if buyer wants (bill of sale)- such as: mower and ice breaker, furnitures ,etc- Refrigerator ,range/oven, microwave, water softener and washer and dryer stays with the home. Measurements are approximates and no guaranty.
-
2025-10-28$70,000 Active 804-char remark
Show marketing remark (804 chars)
Wow! great opportunity to have a corner lot home plus additional lot 126 x30 each lot. fenced backyard with fruit trees ( peach and apple) .all the updates have done from you.- great for started home or investment opportunity. Since owner bought the home many upgrades in the home: central air, siding, roof, flooring, fenced yard, appliances, plumbing, electrical, water softener- owned- filter system for the water in the kitchen, outside concrete path in a side of the home with pipes installed to protect the foundation ( side of the lot). Some personal properties can be sold if buyer wants (bill of sale)- such as: mower and ice breaker, furnitures ,etc- Refrigerator ,range/oven, microwave, water softener and washer and dryer stays with the home. Measurements are approximates and no guaranty.
-
2008-03-11soldstatus $18,000
ⓘ Source: listings_history table (triggers on properties + properties_extension) + one-shot
backfill from property_details.listing_events for pre-trigger history.
Tax reassessment forecast IL · Partial reset (capped growth)
- Current annual tax
- $168 · $14/mo
- Projected year-2 tax
- $708 · $59/mo
- Expected delta
- +$540/yr (+$45/mo · 321.6%)
ⓘ Screening estimate from a state-policy table — verify with the county assessor before closing.
Climate risk First Street
- Flood 1/10 Low FEMA zone X · 0% chance over 30 yrs
- Wildfire 1/10 Low
- Heat 3/10 Moderate 7 d/yr ≥105°F today · 18 d/yr by 30 yrs out
- Wind 2/10 Low 100% chance of damaging wind over 30 yrs
- Air quality 3/10 Moderate 1 unhealthy d/yr today · 3 by 30 yrs out
Nearby sold comps map
Loading sold comps map…
Walkable amenities ~0.75 mi
Loading nearby amenities…
Taxation est. · year 1
- Rental income
- $13,116
- − Mortgage interest
- −$3,081
- − Property taxes
- −$168
- − Insurance
- −$275
- − Repairs & maintenance
- −$1,049
- − Management
- −$1,049
- − Depreciation
- −$1,600
- Taxable income
- $5,894
- Est. tax owed @ 24.0%
- −$1,414
- After-tax cash flow
- $5,043/yr
For passive investors: Depreciation is non-cash, so a rental often shows a tax loss while cash-flowing — sheltering income. Rental losses are passive: they offset passive income freely, and up to $25,000/yr can offset ordinary (W-2) income if you actively participate and your MAGI is under $100k (phasing out to $0 by $150k); unused losses carry forward. On sale, claimed depreciation is recaptured at up to 25%, and gains may owe capital-gains tax (a 1031 exchange can defer both). Figures are a year-1 estimate at your 24.0% rate — not tax advice; consult a CPA.
Schools (NCES district)
- District
- Peoria SD 150
- NCES district ID
- 1731230
- Math proficiency
- 11% ▼ -5.00%
- Reading proficiency
- 14% ▼ -4.00%
- Median HH income
- $41,951
- Composite
- 10.92/100
- National rank
- #9751
- State rank
- #554 of 620 in IL
Livability — Peoria
- Score
- 73/100
- State rank
- #270
- US rank
- #5096
Category grades
Schools grade is shown separately in the Schools card above.
Census & demographics
- Census place
- Peoria, IL
- County
- Peoria County · 120,495 people
- City population
- 114,670
- Metro
- Peoria, IL
- Population (ZIP)
- 13,424
- Household income
- $26,392
- Rent vs Own
- Severe rent burden
- 1385.0
Population outlook (Peoria County) Hauer SSP2
- Today (2025)
- 183,007 people
- By 2030
- 179,643 · -1.8%
- By 2040
- 171,782 · -6.1%
- By 2050
- 163,508 · -10.7%
- By 2075
- 140,178 · -23.4%
- By 2100
- 114,493 · -37.4%
Race, ethnicity, and origin ACS 2023
- Neighborhood character
- Diverse neighborhood (Simpson 0.61)
- Race & ethnicity
- Black 56% White 27% Hispanic / Latino 12% Two or more races 7% Native American 1%
- Hispanic origin (detail)
- Mexican 8%
- Common ancestry
- Lithuanian 1% Iranian 1% Portuguese 1%
- Foreign-born
- 4% · Canada, Vietnam
- Languages at home
- 92% English-only · Spanish 7%
Political lean MEDSL · Peoria
- 2024 margin
- Toss-up / Even · D 51.5% · R 46.9% · Other 1.6%
- 2008→2024 swing
- -9.2pp toward R · 2008: 13.9pp · 2024: 4.7pp
- All cycles
- 2024: D+4.7 2020: D+6.3 2016: D+2.8 2012: D+4.4 2008: D+13.9
Not yet ingested
- Civics
- —
Market trends
- HPI YoY
- ▲ 0.63%
- Current HPI
- 170.5814
- Rent YoY
- —
- Metro
- Peoria, IL
- State GDP YoY
- ▲ 1.59%
- F500 in state
- 60
Industry mix (Fortune 500 HQ in IL)
| Industry | F500 HQs | Revenue |
|---|---|---|
| Insurance | 4 | $201B |
|
||
| Consumer Goods | 4 | $87B |
|
||
| Industrial Machinery | 3 | $64B |
|
||
| Healthcare | 2 | $55B |
|
||
| Retail / Pharmacy | 1 | $148B |
|
||
| Agriculture / Food | 1 | $86B |
|
||
Price history
+205.6% since first listed3 events — show timeline
- 2026-01-06 Price Changed $55,000 RMLSA as Distributed by MLS Grid
- 2025-10-28 Listed $70,000 RMLSA as Distributed by MLS Grid
- 2008-03-11 Sold (Public Records) $18,000 Public Records
Property tax history
-21.8%/yrLatest (2016): $168 · -52.1% YoY. Source: county tax records.
Cash-flow waterfall
monthlySold comps — $/sqft
last 12 mo · ≤1 miLoading sold comps…