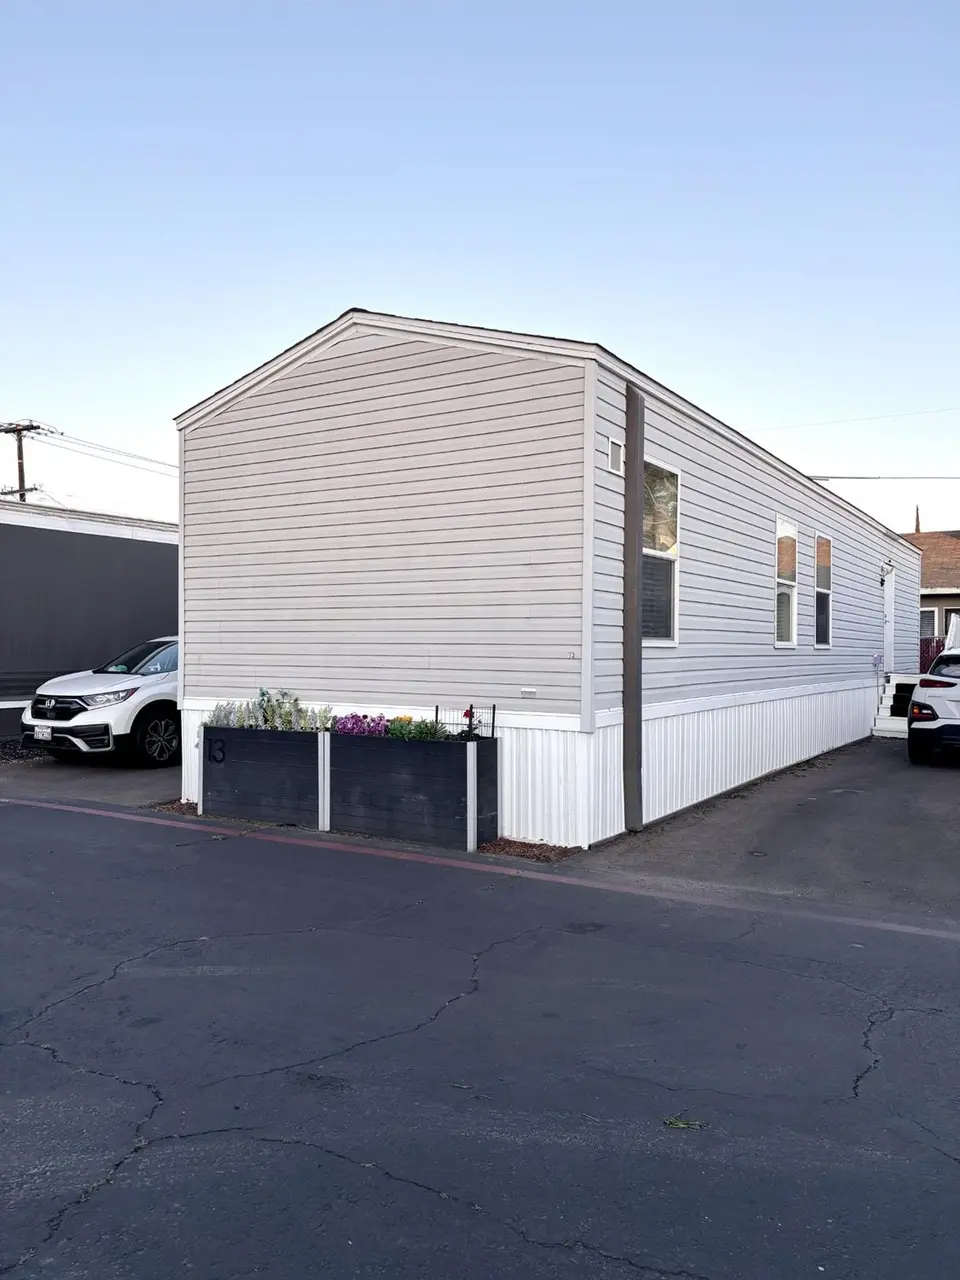
2355 Atwater #13 · Atwater, CA
Flood risk No data
- FEMA flood zone
- —
- Chance of flooding over 30 yrs
- —
- Est. flood insurance / yr
- —
Fire risk No data
- Est. fire insurance / yr
- —
Heat risk No data
- Hot days now (above threshold)
- —
- Hot days in 30 yrs
- —
Wind risk No data
- Chance of severe wind over 30 yrs
- —
Air-quality risk No data
- Unhealthy air days now
- —
- Unhealthy air days in 30 yrs
- —
Risk factors via First Street. Map © Google.
Why this score? — see what drove the B- grade
The composite is a weighted blend of 9 inputs, each scored 0–100. Each bar is that input's sub-score; the figure is the points it added to the 100-point composite (weight × sub-score).
- Cash flow +28.6/30.0
- DSCR +10.0/10.0
- 1% rule +7.9/10.0
- ARV discount +7.5/15.0
- Livability +3.4/5.0
- Schools +2.8/10.0
- Rent growth +2.5/5.0
- Condition / age +2.5/5.0
- Appreciation +0.0/10.0
$95,000
🖨 Deal sheet 📄 Offer letter ✓ Due diligence
Listing remarks
Move-in ready and fully furnished, this inviting home offers a comfortable and convenient turnkey opportunity in a welcoming Atwater community. The functional layout creates a warm and relaxing living space that's easy to enjoy from the moment you arrive. The home features central heating and air conditioning, along with two mini-split AC systems that allow you to heat or cool individual rooms as neededoffering flexibility, comfort, and the potential for improved energy efficiency. Additional highlights include 2 storage sheds , providing valuable extra space for tools, hobbies, or seasonal storage. The community currently offers a $300 monthly subsidy applied toward the base space rent (su
Key facts
- Central heating
- Air conditioning
- Storage sheds
Tags
Property features AI
Finance
- Financial info: Land lease: No (listed land lease amount $795 noted)
- HOA & community: No association; Not a senior community
Exterior
- Parking: No garage
- Utilities: Public water; Public sewer; Natural gas connected; Cable available; 220 volts in kitchen; 220 volts in laundry
- Home design: Manufactured home located in a park; Single wide; Built in 2017
- Construction: Vinyl skirting; Composition roof; Manufactured home construction
- Exterior features: Storage shed(s); Storage area; Lot details: see remarks
Interior
- Kitchen: Free standing gas range; Free standing refrigerator; Microwave; Laminate countertops
- Bedrooms: 2 bedrooms
- Flooring: Laminate flooring
- Bathrooms: 1 full bathroom with tub/shower over
- Heating & cooling: Central heating; Central cooling; Wall units; Multiple HVAC units (see remarks)
- Interior features: Accessible full bathroom; Furnished; Dining and living room combined; Laminate counters in kitchen; Storage area (interior or attached)
- Laundry & utility: Washer and dryer included; Laundry closet; Electric hookup for laundry (220 volts available)
Neighborhood map
What this means for you Summary
Snapshot
- This is a 2-bed/1.0-bath manufactured listed at $95k.
Deal economics
- At list price, monthly cash flow is $313 ($4k/yr) — positive.
- The deal already cash-flows at list — no discount required.
- Meets the 1% rule at list price ($1k rent vs $95k).
- Recommended offer: $86k (9.0% below list) — sets the bar for market timing.
- Cap rate 10.2% vs local median 2.8% in Atwater — top-decile yield for the area; either an underpriced asset or a hidden risk that comps aren't pricing in. Stress-test before assuming the spread holds.
Location & tenants
- Location reads 68/100 on livability (#295 in CA) — a middle-class / working-renter tenant base. Strengths: housing A+, health & safety A+, amenities B; Watch: employment D+, schools D, crime F.
- Merced Union High (urban): math 20% / reading 46% proficiency, ranked #301 of 517 in CA (top 58%) — families likely to look elsewhere, expect single-tenant / working-renter base with shorter leases.
- Market conditions: 115 active listings in the ZIP; 459 units permitted in Merced County in 2024 (0 in 5+ unit buildings).
Forward outlook
- Local home prices are declining (-3.0%/yr); year-one equity from $657 of loan paydown is wiped out by about $3k of value loss. Plan a longer hold.
- Merced County population projected at +12% by 2050 — modest demand growth; plan on rents tracking national, not racing it.
- At projected returns (-3.0% appreciation + 3.0% rent growth), your $27k cash investment doubles in ~9 years — after that, you're playing with house money.
Negotiation context
- It's been on market 95 days — a 9% lower offer ($86k) is reasonable based on typical stale-listing flexibility.
Questions for the listing agent
- It's been on market 95 days. Have you received any prior offers? Is the seller open to a 9% concession, seller financing, or rate buy-down credit?
- Why hasn't it sold? Are there any deal-killer items the seller is aware of (foundation, flood, title, zoning, code violations)?
- Is there a deadline driving the sale (1031 exchange, divorce, estate, relocation)? That informs how much negotiation room exists.
- Schools are D-rated, which usually means shorter tenancies and higher turnover. Who's the typical renter profile here, and what's been the actual vacancy rate?
- Crime grade is F in this area — have there been break-ins, vandalism, or insurance claims at this property in the last 3 years? What carrier currently insures it and at what premium?
- What's the average days-on-market for RENTAL listings here right now (not sales)? A rising rental-DOM trend means longer vacancies and softer asking-rent achievability than the comps imply.
- What's the recent tenant-quality profile in this submarket — average credit score on applications, eviction rate, late-payment / NSF rate, and stable-employment percentage? A property-management company in the area should have these aggregated.
- How much new for-sale + rental construction is in the pipeline within 1–3 miles? Heavy new supply typically softens prices + rents 12–24 months out; constrained supply supports both.
Investment metrics
- 1% rule
- 1.29% ✓
- Cap rate
- 10.25%
- Cash-on-cash
- 14.12%
- DSCR
- 1.63
- GRM
- 6.5
CMA / ARV
- ARV (on-the-fly)
- $59,360
- Comps found
- 3
Show comp detail 3 sales within ~0.75 mi
| Address | Dist | Beds/Ba | Sqft | Sold | Price | $/sf | Match |
|---|---|---|---|---|---|---|---|
| 2324 Olive Ave #13 | 0.00mi | 2/1.0 | 742 (0%) | 8mo | $50,000 | $67 | 94 |
| 2355 Atwater Blvd #11 | 0.00mi | 2/1.0 | 742 (0%) | 10mo | $59,000 | $80 | 92 |
| 2355 Atwater #23 | 0.03mi | 3/2.0 (+1) | 725 (-2%) | 19mo | $64,950 | $90 | 70 |
Match score weights: distance 35% · size 25% · config 20% · recency 20%. Top-matched comps best support the ARV.
Projected returns pro-forma
-3.0% appreciation · 3.0% rent growth · sell at horizon
- IRR
- 4.4%
- Equity multiple
- 1.17×
- Total profit
- $4,561
- Equity at exit
- $14,165
- IRR
- 13.9%
- Equity multiple
- 2.12×
- Total profit
- $29,718
- Equity at exit
- $8,214
Cash invested: $26,600 (down + closing). Projections, not guarantees.
Landlord ↔ Tenant lean methodology
- Overall (STATE)
- 18 Strongly Tenant-Friendly
- State California
- 18 Strongly Tenant-Friendly · D+13
- County
- — inherits STATE
- City
- — inherits STATE
ZIP-level market 95301
- Active inventory
- 115
- Price-to-rent
- 6.5×
Monthly cashflow live
- Estimated rent
- $1,227 medium interval (Pro) →
- Mortgage (P&I)
- −$498
- Tax est. 1.5%
- −$119 /mo · $1,425/yr
- Insurance
- −$40
- HOA
- −$0
- Vacancy / Maint / Mgmt
- −$258
- Net cashflow
- $313
Break-even live
UW: 25.0% down · 7.5% · 30yr · 1.5% tax · 5.0% vac · 8.0% maint · 8.0% mgmt
Financing live
Cash to close
- Down payment
- $23,750
- Closing costs
- $2,850
- Reserves months
- —
- Total cash needed
- —
Loan-product check · same deal, 3 products live
Conventional
25% down · 7.5% · 30yr
- Down + closing
- —
- Monthly P&I
- —
- Monthly cashflow
- —
- DSCR
- —
- Eligible?
- —
Personal DTI + credit; lowest rate.
DSCR
20% down · 8.5% · 30yr
- Down + closing
- —
- Monthly P&I
- —
- Monthly cashflow
- —
- DSCR
- —
- Eligible?
- —
No personal income docs; deal must DSCR.
Hard money
10% down · 12.0% · 12mo
- Down + closing
- —
- Monthly P&I
- —
- Monthly cashflow
- —
- DSCR
- —
- Eligible?
- —
Short-term bridge; refi at stabilization.
Listing history 15 events
-
2026-06-18days on market $95,000 Active 95 DOM
-
2026-06-17days on market $95,000 Active 94 DOM
-
2026-06-16days on market $95,000 Active 93 DOM
-
2026-06-15days on market $95,000 Active 92 DOM
-
2026-06-14days on market $95,000 Active 90 DOM
-
2026-06-13days on market $95,000 Active 89 DOM
-
2026-06-10days on market $95,000 Active 87 DOM
-
2026-06-09days on market $95,000 Active 86 DOM
-
2026-06-08days on market $95,000 Active 85 DOM
-
2026-06-07days on market $95,000 Active 84 DOM
-
2026-06-03days on market $95,000 Active 80 DOM
-
2026-06-02days on market $95,000 Active 79 DOM
-
2026-06-01days on market $95,000 Active 78 DOM
-
2026-05-31days on market $95,000 Active 77 DOM
-
2026-05-30days on market $95,000 Active 76 DOM
ⓘ Source: listings_history table (triggers on properties + properties_extension) + one-shot
backfill from property_details.listing_events for pre-trigger history.
Nearby sold comps map
Loading sold comps map…
Walkable amenities ~0.75 mi
Loading nearby amenities…
Taxation est. · year 1
- Rental income
- $14,727
- − Mortgage interest
- −$5,321
- − Property taxes
- −$1,425
- − Insurance
- −$475
- − Repairs & maintenance
- −$1,178
- − Management
- −$1,178
- − Depreciation
- −$2,764
- Taxable income
- $2,386
- Est. tax owed @ 24.0%
- −$573
- After-tax cash flow
- $3,184/yr
For passive investors: Depreciation is non-cash, so a rental often shows a tax loss while cash-flowing — sheltering income. Rental losses are passive: they offset passive income freely, and up to $25,000/yr can offset ordinary (W-2) income if you actively participate and your MAGI is under $100k (phasing out to $0 by $150k); unused losses carry forward. On sale, claimed depreciation is recaptured at up to 25%, and gains may owe capital-gains tax (a 1031 exchange can defer both). Figures are a year-1 estimate at your 24.0% rate — not tax advice; consult a CPA.
Schools (NCES district)
- District
- Merced Union High
- NCES district ID
- 0624660
- Math proficiency
- 20% ▲ 3.00%
- Reading proficiency
- 46% ▼ -1.00%
- Median HH income
- $44,977
- Composite
- 28.11/100
- National rank
- #6823
- State rank
- #301 of 517 in CA
Livability — Atwater
- Score
- 68/100
- State rank
- #295
- US rank
- #9893
Category grades
Schools grade is shown separately in the Schools card above.
Census & demographics
- Census place
- Atwater, CA
- County
- Merced County · 205,386 people
- City population
- 43,009
- Metro
- Merced, CA
- Population (ZIP)
- 43,009
- Household income
- $68,349
- Rent vs Own
- Severe rent burden
- 1477.0
Population outlook (Merced County) Hauer SSP2
- Today (2025)
- 285,501 people
- By 2030
- 293,437 · +2.8%
- By 2040
- 308,808 · +8.2%
- By 2050
- 321,011 · +12.4%
- By 2075
- 338,497 · +18.6%
- By 2100
- 330,493 · +15.8%
Race, ethnicity, and origin ACS 2023
- Neighborhood character
- Diverse neighborhood (Simpson 0.61)
- Race & ethnicity
- Hispanic / Latino 53% White 33% Two or more races 11% Asian 6% Black 4% Native American 1%
- Hispanic origin (detail)
- Mexican 50%
- Common ancestry
- Russian 7% Slovak 1% Iranian 1%
- Foreign-born
- 21% · Canada
- Languages at home
- 56% English-only · Spanish 37% Other Indo-European 3% Other Asian/Pacific 2%
Political lean MEDSL · Merced
- 2024 margin
- Toss-up / Even · D 46.5% · R 50.9% · Other 2.6%
- 2008→2024 swing
- -12.7pp toward R · 2008: 8.3pp · 2024: -4.4pp
- All cycles
- 2024: R+4.4 2020: D+10.6 2016: D+7.9 2012: D+5.4 2008: D+8.3
Not yet ingested
- Civics
- —
Market trends
- HPI YoY
- ▼ -365.43%
- Current HPI
- 281.52
- Rent YoY
- —
- Metro
- Merced, CA
- State GDP YoY
- ▲ 3.21%
- F500 in state
- 116
Industry mix (Fortune 500 HQ in CA)
| Industry | F500 HQs | Revenue |
|---|---|---|
| Technology | 27 | $1,492B |
|
||
| Financial Services | 3 | $174B |
|
||
| Retail | 3 | $44B |
|
||
| Insurance | 3 | $26B |
|
||
| Media / Entertainment | 2 | $115B |
|
||
| Pharmaceuticals / Biotech | 2 | $62B |
|
||
Cash-flow waterfall
monthlySold comps — $/sqft
last 12 mo · ≤1 miLoading sold comps…