300 W Tennessee St W · Collinwood, TN
Flood risk 1/10 · Minimal
- FEMA flood zone
- X (unshaded)
- Chance of flooding over 30 yrs
- 0.0%
- Est. flood insurance / yr
- $473 – $860
Fire risk 4/10 · Minor
- Est. fire insurance / yr
- $949 – $1,763
Heat risk 4/10 · Minor
- Hot days now (above 103°F)
- 7 days/yr
- Hot days in 30 yrs
- 20 days/yr
Wind risk 4/10 · Minor
- Chance of severe wind over 30 yrs
- 16.0%
Air-quality risk 2/10 · Minimal
- Unhealthy air days now
- 1 days/yr
- Unhealthy air days in 30 yrs
- 1 days/yr
Risk factors via First Street. Map © Google.
Why this score? — see what drove the C- grade
The composite is a weighted blend of 9 inputs, each scored 0–100. Each bar is that input's sub-score; the figure is the points it added to the 100-point composite (weight × sub-score).
- Cash flow +16.7/30.0
- Appreciation +9.1/10.0
- ARV discount +7.5/15.0
- DSCR +5.2/10.0
- 1% rule +3.5/10.0
- Livability +3.0/5.0
- Rent growth +2.5/5.0
- Condition / age +2.5/5.0
- Schools +1.2/10.0
$99,000
🖨 Deal sheet (PDF) 📄 Offer letter ✓ Due diligence
Listing remarks
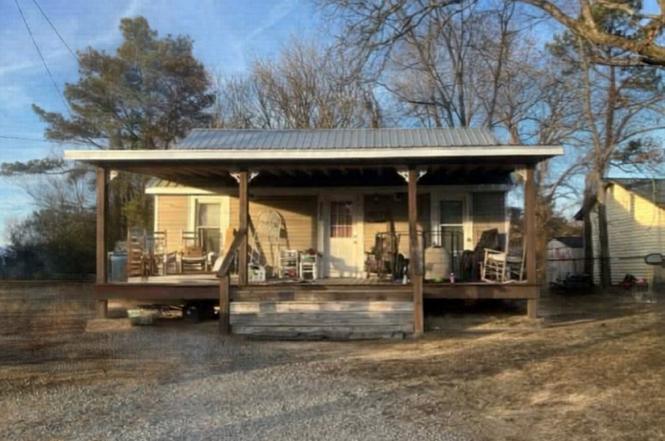
⸻ Affordable Small-Town Home | Motivated Seller | Collinwood, Tennessee $99,000 Welcome to this charming opportunity in the heart of Collinwood, Tennessee, a quiet small-town setting known for its relaxed lifestyle and friendly community. This home offers incredible value at an affordable price point, making it ideal for first-time buyers, investors, or anyone looking for a simple and peaceful place to call home. With a motivated seller, this property is priced to move and ready for its next owner. The home features a functional layout with comfortable living space and plenty of potential to personalize, update, or enhance over time. Whether you’re looking for a starter home, rental
Key facts
- New front porch
- New flooring
- Plumbing upgrades
Tags
Property features AI
Finance
- Financial info: $304 annual tax (tax amount provided)
Exterior
- Parking: No covered parking listed; No parking total specified
- Utilities: Public water; Shared septic; Water available; Cable connected
- Home design: Single-family residence; One story
- Construction: Vinyl siding; Metal roof; Block foundation; Existing (year built listed as existing)
- Exterior features: Covered porch
Interior
- Kitchen: No appliances included
- Bedrooms: 2 bedrooms (both on the main level)
- Flooring: Laminate
- Bathrooms: 1 full bathroom
- Heating & cooling: Propane heating; Cooling present (unspecified type)
- Interior features: Laminate flooring; Basement (other)
- Laundry & utility: Washer hookup; Electric dryer hookup
Neighborhood map
What this means for you Summary
Snapshot
- This is a 2-bed/1.0-bath single-family listed at $99k.
Deal economics
- At list price, monthly cash flow is $62 ($746/yr) — positive.
- The deal already cash-flows at list — no discount required.
- To meet the 1% rule (rent ≥ 1% of price), the offer needs to be $84k (15.3% below list).
- Recommended offer: $84k (15.3% below list) — sets the bar for 1% rule.
Location & tenants
- Location reads 60/100 on livability (#262 in TN) — a middle-class / working-renter tenant base. Strengths: cost of living A+, housing A, crime B; Watch: health & safety C-, amenities F, commute F.
- Wayne County (rural): math 8% / reading 21% proficiency, ranked #130 of 139 in TN (top 94%) — low school quality limits family demand, transient renter base, plan for 1-2y turnover.
- Zoned schools: Collinwood Elementary (math 8% / reading 22%, grade F, #752 of 952 statewide, top 79%, 342 students, 0% FRL); Waynesboro Middle School (math 8% / reading 22%, grade F, #230 of 333 statewide, top 69%, 290 students, 0% FRL); Collinwood High School (math 5% / reading 34%, grade F, #183 of 332 statewide, top 59%, 270 students, 0% FRL) — zoned schools average 0% FRL vs 55% district-wide (55 pts lower); this property's tenant base skews higher-income than the district average.
- Market conditions: 16 active listings in the ZIP.
Forward outlook
- In year one you build about $9k of equity ($684 loan paydown + $8k appreciation (8.3% local appreciation)).
- Wayne County population projected at -12% by 2050 — secular population decline; favor cash flow + early exit over multi-decade hold.
- At projected returns (8.3% appreciation + 3.0% rent growth), your $28k cash investment doubles in ~3 years — after that, you're playing with house money.
- By year 4, paydown + projected appreciation supports a ~$31k cash-out refi (75% LTV) — recoverable capital for the next deal without selling this one.
Negotiation context
- It's been on market 181 days — a 12% lower offer ($87k) is reasonable based on typical stale-listing flexibility.
- 2 sale attempts since 5y ago; this cycle's ask has dropped $26k (21%) from the opening price — seller is motivated, your offer sets the floor, not the list.
- Current owner paid $24k; list at $99k implies a 312% gain — meaningful room to come down on a strong offer.
Questions for the listing agent
- It's been on market 181 days. Have you received any prior offers? Is the seller open to a 15% concession, seller financing, or rate buy-down credit?
- Built in 1964 — when were the roof, HVAC, electrical panel, plumbing, and water heater last replaced?
- Why hasn't it sold? Are there any deal-killer items the seller is aware of (foundation, flood, title, zoning, code violations)?
- Is there a deadline driving the sale (1031 exchange, divorce, estate, relocation)? That informs how much negotiation room exists.
- Schools are F-rated, which usually means shorter tenancies and higher turnover. Who's the typical renter profile here, and what's been the actual vacancy rate?
- What's the average days-on-market for RENTAL listings here right now (not sales)? A rising rental-DOM trend means longer vacancies and softer asking-rent achievability than the comps imply.
- What's the recent tenant-quality profile in this submarket — average credit score on applications, eviction rate, late-payment / NSF rate, and stable-employment percentage? A property-management company in the area should have these aggregated.
- How much new for-sale + rental construction is in the pipeline within 1–3 miles? Heavy new supply typically softens prices + rents 12–24 months out; constrained supply supports both.
Investment metrics
- 1% rule
- 0.85% ✗
- Cap rate
- 7.05%
- Cash-on-cash
- 2.69%
- DSCR
- 1.12
- GRM
- 9.8
CMA / ARV
No comps found within radius.
Projected returns pro-forma
8.26% appreciation · 3.0% rent growth · sell at horizon
- IRR
- 22.6%
- Equity multiple
- 2.67×
- Total profit
- $46,372
- Equity at exit
- $76,987
- IRR
- 20.6%
- Equity multiple
- 5.75×
- Total profit
- $131,612
- Equity at exit
- $154,542
Cash invested: $27,720 (down + closing). Projections, not guarantees.
Landlord ↔ Tenant lean methodology
- Overall (STATE)
- 87 Strongly Landlord-Friendly
- State Tennessee
- 87 Strongly Landlord-Friendly · R+13
- County
- — inherits STATE
- City
- — inherits STATE
ZIP-level market 38450
- Home prices YoY
- 2.6%
- Active inventory
- 16
- Price-to-rent
- 9.8×
Monthly cashflow live
- Estimated rent
- $838 medium interval (Pro) →
- Mortgage (P&I)
- −$519
- Tax from tax record
- −$40 /mo · $476/yr
- Insurance
- −$41
- HOA
- −$0
- Vacancy / Maint / Mgmt
- −$176
- Net cashflow
- $62
Break-even live
Sensitivity live
| Price | -10% $118 | -5% $90 | +0% $62 | +5% $34 | +10% $6 |
|---|---|---|---|---|---|
| Rent | -10% $-4 | -5% $29 | +0% $62 | +5% $95 | +10% $128 |
| Rate | -1.0pp $112 | -0.5pp $87 | base $62 | +0.5pp $37 | +1.0pp $10 |
UW: 25.0% down · 7.5% · 30yr · 1.5% tax · 5.0% vac · 8.0% maint · 8.0% mgmt
Financing live
Cash to close
- Down payment
- $24,750
- Closing costs
- $2,970
- Reserves months
- —
- Total cash needed
- —
Loan-product check · same deal, 3 products live
Conventional
25% down · 7.5% · 30yr
- Down + closing
- —
- Monthly P&I
- —
- Monthly cashflow
- —
- DSCR
- —
- Eligible?
- —
Personal DTI + credit; lowest rate.
DSCR
20% down · 8.5% · 30yr
- Down + closing
- —
- Monthly P&I
- —
- Monthly cashflow
- —
- DSCR
- —
- Eligible?
- —
No personal income docs; deal must DSCR.
Hard money
10% down · 12.0% · 12mo
- Down + closing
- —
- Monthly P&I
- —
- Monthly cashflow
- —
- DSCR
- —
- Eligible?
- —
Short-term bridge; refi at stabilization.
Listing history 21 events
-
2026-06-18days on market $99,000 Active 181 DOM
-
2026-06-17days on market $99,000 Active 180 DOM
-
2026-06-16days on market $99,000 Active 179 DOM
-
2026-06-15days on market $99,000 Active 178 DOM
-
2026-06-13days on market $99,000 Active 176 DOM
-
2026-06-12days on market $99,000 Active 175 DOM
-
2026-06-09days on market $99,000 Active 172 DOM
-
2026-06-08days on market $99,000 Active 171 DOM
-
2026-06-08days on market $99,000 Active 170 DOM
-
2026-06-07days on market $99,000 Active 169 DOM
-
2026-06-03days on market $99,000 Active 166 DOM
-
2026-06-02days on market $99,000 Active 165 DOM
-
2026-06-01days on market $99,000 Active 164 DOM
-
2026-05-31days on market $99,000 Active 163 DOM
-
2026-03-07price $99,000
-
2025-12-20$125,000 Active
-
2022-03-02historical
-
2021-09-23price $55,000
-
2021-08-15price $79,000
-
2021-06-30$99,000 Active
-
2002-04-13soldstatus $24,000
ⓘ Source: listings_history table (triggers on properties + properties_extension) + one-shot
backfill from property_details.listing_events for pre-trigger history.
Tax reassessment forecast TN · Resets to sale price
- Current annual tax
- $476 · $40/mo
- Projected year-2 tax
- $703 · $59/mo
- Expected delta
- +$227/yr (+$19/mo · 47.7%)
ⓘ Screening estimate from a state-policy table — verify with the county assessor before closing.
Climate risk First Street
- Flood 1/10 Low FEMA zone X (unshaded) · 0% chance over 30 yrs
- Wildfire 4/10 Moderate
- Heat 4/10 Moderate 7 d/yr ≥103°F today · 20 d/yr by 30 yrs out
- Wind 4/10 Moderate 16% chance of damaging wind over 30 yrs
- Air quality 2/10 Low 1 unhealthy d/yr today · 1 by 30 yrs out
Nearby sold comps map
Loading sold comps map…
Walkable amenities ~0.75 mi
Loading nearby amenities…
Taxation est. · year 1
- Rental income
- $10,060
- − Mortgage interest
- −$5,546
- − Property taxes
- −$476
- − Insurance
- −$495
- − Repairs & maintenance
- −$805
- − Management
- −$805
- − Depreciation
- −$2,880
- Taxable loss
- −$946
- Est. tax savings @ 24.0%
- +$227
- After-tax cash flow
- $973/yr
For passive investors: Depreciation is non-cash, so a rental often shows a tax loss while cash-flowing — sheltering income. Rental losses are passive: they offset passive income freely, and up to $25,000/yr can offset ordinary (W-2) income if you actively participate and your MAGI is under $100k (phasing out to $0 by $150k); unused losses carry forward. On sale, claimed depreciation is recaptured at up to 25%, and gains may owe capital-gains tax (a 1031 exchange can defer both). Figures are a year-1 estimate at your 24.0% rate — not tax advice; consult a CPA.
Schools (NCES district)
- District
- Wayne County
- NCES district ID
- 4704440
- Math proficiency
- 8% ▼ -16.00%
- Reading proficiency
- 21% ▼ -10.00%
- Median HH income
- $34,215
- Composite
- 11.79/100
- National rank
- #9681
- State rank
- #130 of 139 in TN
Livability — Collinwood
- Score
- 60/100
- State rank
- #262
- US rank
- #18501
Category grades
Schools grade is shown separately in the Schools card above.
Census & demographics
- Census place
- Collinwood, TN
- Population (ZIP)
- 2,633
Population outlook (Wayne County) Hauer SSP2
- Today (2025)
- 16,256 people
- By 2030
- 15,921 · -2.1%
- By 2040
- 15,248 · -6.2%
- By 2050
- 14,393 · -11.5%
- By 2075
- 12,481 · -23.2%
- By 2100
- 10,466 · -35.6%
Race, ethnicity, and origin ACS 2023
- Neighborhood character
- Predominantly White (97%)
- Race & ethnicity
- White 97% Hispanic / Latino 2% Two or more races 1%
- Common ancestry
- Italian 1%
- Foreign-born
- 0% · Canada
- Languages at home
- 99% English-only · Spanish 1%
Political lean MEDSL · Wayne
- 2024 margin
- Solid R (+76.9) · D 11.2% · R 88.1%
- 2008→2024 swing
- -27.7pp toward R · 2008: -49.2pp · 2024: -76.9pp
- All cycles
- 2024: R+76.9 2020: R+74.6 2016: R+73.9 2012: R+56.3 2008: R+49.2
Not yet ingested
- Civics
- —
Market trends
- HPI YoY
- ▲ 8.26%
- Current HPI
- 322.4243
- Rent YoY
- —
- Metro
- —
- State GDP YoY
- ▲ 2.78%
- F500 in state
- 22
Industry mix (Fortune 500 HQ in TN)
| Industry | F500 HQs | Revenue |
|---|---|---|
| Healthcare | 3 | $91B |
|
||
| Retail | 3 | $72B |
|
||
| Transportation / Logistics | 1 | $88B |
|
||
| Paper / Packaging | 1 | $19B |
|
||
| Insurance | 1 | $13B |
|
||
| Energy | 1 | $12B |
|
||
Price history
+312.5% since first listed7 events — show timeline
- 2026-03-07 Price Changed $99,000 REALTRACS as Distributed by MLS Grid
- 2025-12-20 Listed $125,000 REALTRACS as Distributed by MLS Grid
- 2022-03-02 Listing Removed — REALTRACS as Distributed by MLS Grid
- 2021-09-23 Price Changed $55,000 REALTRACS as Distributed by MLS Grid
- 2021-08-15 Price Changed $79,000 REALTRACS as Distributed by MLS Grid
- 2021-06-30 Listed $99,000 REALTRACS as Distributed by MLS Grid
- 2002-04-13 Sold (Public Records) $24,000 Public Records
Property tax history
+6.1%/yrLatest (2025): $476 · +27.6% YoY. Source: county tax records.
Cash-flow waterfall
monthlySold comps — $/sqft
last 12 mo · ≤1 miLoading sold comps…