121 Washington Ave S #417 · Minneapolis, MN
Flood risk 1/10 · Minimal
- FEMA flood zone
- X (unshaded)
- Chance of flooding over 30 yrs
- 0.0%
- Est. flood insurance / yr
- $507 – $1,088
Fire risk 1/10 · Minimal
- Est. fire insurance / yr
- $888 – $1,650
Heat risk 2/10 · Minimal
- Hot days now (above 99°F)
- 7 days/yr
- Hot days in 30 yrs
- 14 days/yr
Wind risk 2/10 · Minimal
- Chance of severe wind over 30 yrs
- —
Air-quality risk 2/10 · Minimal
- Unhealthy air days now
- 1 days/yr
- Unhealthy air days in 30 yrs
- 1 days/yr
Risk factors via First Street. Map © Google.
Why this score? — see what drove the C+ grade
The composite is a weighted blend of 9 inputs, each scored 0–100. Each bar is that input's sub-score; the figure is the points it added to the 100-point composite (weight × sub-score).
- Cash flow +15.2/30.0
- ARV discount +15.0/15.0
- 1% rule +8.7/10.0
- Appreciation +4.8/10.0
- DSCR +4.7/10.0
- Rent growth +3.9/5.0
- Livability +3.9/5.0
- Schools +3.5/10.0
- Condition / age +2.5/5.0
$350,000
🖨 Deal sheet 📄 Offer letter ✓ Due diligence
Listing remarks MLS
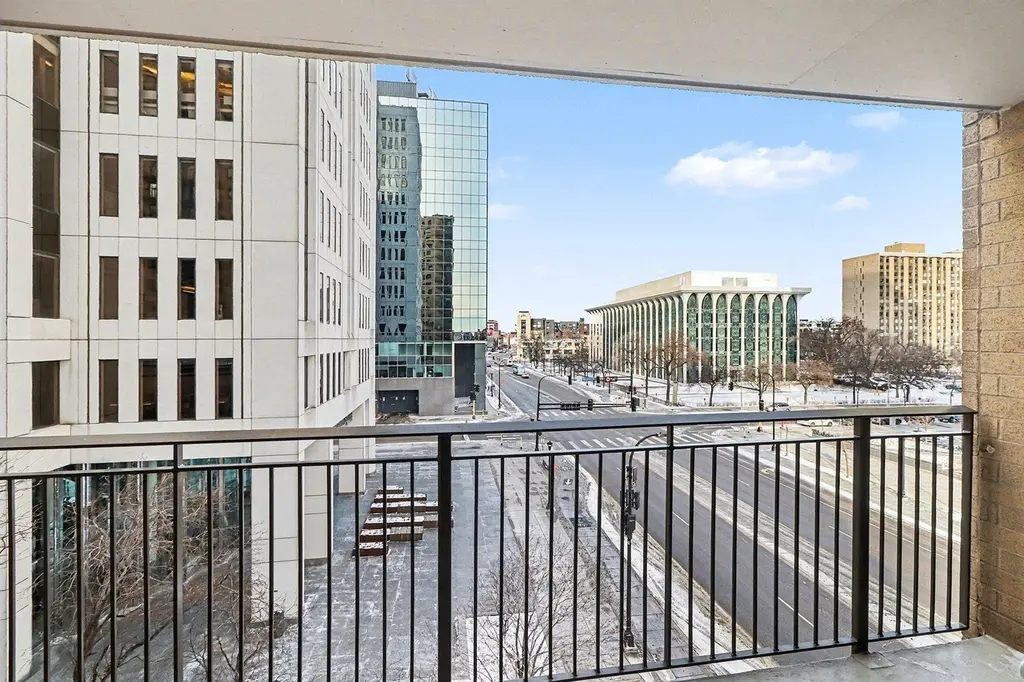
Rarely available THREE BEDROOM corner condo on the SKYWAY with a balcony overlooking the city! 70K kitchen remodel with custom cabinets, mosaic backsplash and stainless steel appliances. Custom vanities in both baths. Spacious primary suite with walk in closet. Ample storage in this unit along with an additional storage locker. Gorgeous city views from FIVE windows! Streaming sunlight all day! Amenity enriched building with 24 hour security, rooftop heated pool with big city views, new grilling and game area with beautiful firepits, hot tub, sauna, gym and heated garage. Highly walkable Mill District neighborhood just two blocks to the river! The required sliding glass door replacement has been completed by the seller. Quick stroll to Whole Foods, Trader Joes, US Bank Stadium, Target Center, Stone Arch Bridge, the Guthrie and a host of the best restaurants, bars & coffee shops in the city. City living at it's best! Common areas are being remodeled starting in April to include lobby, elevators, residential hallways etc. Please see rendition by mailbox receiving area on lobby level.
Key facts
- $1,234 HOA
- Garage
- Pool
Neighborhood map
What this means for you Summary
Snapshot
- This is a 3-bed/2.0-bath condo listed at $350k.
Deal economics
- At list price, monthly cash flow is $123 ($1k/yr) — positive.
- The deal already cash-flows at list — no discount required.
- Meets the 1% rule at list price ($5k rent vs $350k).
- Recommended offer: $308k (12.0% below list) — sets the bar for market timing.
- Cap rate 6.7% vs local median 3.1% in Minneapolis — top-decile yield for the area; either an underpriced asset or a hidden risk that comps aren't pricing in. Stress-test before assuming the spread holds.
Location & tenants
- Location reads 78/100 on livability (#110 in MN, #2,525 nationally) — a middle-class / working-renter tenant base. Strengths: amenities A+, commute A+, housing A+; Watch: cost of living C-, crime F.
- Minneapolis Public School District (urban): math 35% / reading 46% proficiency, ranked #217 of 301 in MN (top 72%) — families likely to look elsewhere, expect single-tenant / working-renter base with shorter leases.
- Market conditions: Rents rising fast (+5.5%/yr); 160 active listings in the ZIP; 40 comparable units currently listed for rent nearby; rentals leasing fast (median 3d on market — plan ~1-2 weeks tenant-placement turnaround); high-income renter base; 4,651 units permitted in Hennepin County in 2024 (2,443 in 5+ unit buildings).
- At $4,779/mo this rent would consume 51% of the median local household income ($114k/yr) (locally 610% of renters already pay >50% of income on rent) — very limited rent-growth headroom before tenants either downsize or default.
Forward outlook
- In year one you build about $956 of equity ($2k loan paydown + $-1k appreciation (-0.4% local appreciation)).
- Hennepin County population projected at +30% by 2050 — long-run rental-demand tailwind backs the buy-and-hold thesis.
- At projected returns (-0.4% appreciation + 5.5% rent growth), your $98k cash investment doubles in ~9 years — after that, you're playing with house money.
Negotiation context
- It's been on market 148 days — a 12% lower offer ($308k) is reasonable based on typical stale-listing flexibility.
- 3 sale attempts since 31y ago; this cycle's ask has dropped $35k (9%) from the opening price — seller is motivated, your offer sets the floor, not the list.
- Current owner paid $175k; list at $350k implies a 100% gain — meaningful room to come down on a strong offer.
Risks & watch-outs
- Watch-outs: HOA is 26% of rent.
Questions for the listing agent
- It's been on market 148 days. Have you received any prior offers? Is the seller open to a 12% concession, seller financing, or rate buy-down credit?
- What does the HOA fee cover, when was the last increase, and are there any pending special assessments or reserve-fund shortfalls?
- Any open or pending special assessments — roof, HVAC, plumbing, elevator, façade? What's the per-unit balance and payoff schedule, and is the seller paying it off at close or rolling it to the buyer?
- Why hasn't it sold? Are there any deal-killer items the seller is aware of (foundation, flood, title, zoning, code violations)?
- Is there a deadline driving the sale (1031 exchange, divorce, estate, relocation)? That informs how much negotiation room exists.
- Crime grade is F in this area — have there been break-ins, vandalism, or insurance claims at this property in the last 3 years? What carrier currently insures it and at what premium?
- What's the average days-on-market for RENTAL listings here right now (not sales)? A rising rental-DOM trend means longer vacancies and softer asking-rent achievability than the comps imply.
- What's the recent tenant-quality profile in this submarket — average credit score on applications, eviction rate, late-payment / NSF rate, and stable-employment percentage? A property-management company in the area should have these aggregated.
- How much new apartment / multifamily construction is in the pipeline within 1–3 miles? Heavy new supply (>2% of stock underway) typically softens rents 12–24 months out; light construction supports rent growth.
Investment metrics
- 1% rule
- 1.37% ✓
- Cap rate
- 6.71%
- Cash-on-cash
- 1.51%
- DSCR
- 1.07
- GRM
- 6.1
CMA / ARV
- ARV (median comp)
- $560,000
- List price
- $350,000
- Delta
- -37.50%
- Verdict
- UNDERPRICED
- Comps
- 15 within 1.0 mi
Projected returns pro-forma
-0.42% appreciation · 5.49% rent growth · sell at horizon
- IRR
- 0.8%
- Equity multiple
- 1.04×
- Total profit
- $3,874
- Equity at exit
- $94,370
- IRR
- 9.5%
- Equity multiple
- 2.10×
- Total profit
- $108,183
- Equity at exit
- $107,795
Cash invested: $98,000 (down + closing). Projections, not guarantees.
Landlord ↔ Tenant lean methodology
- Overall (CITY)
- 34 Tenant-Leaning
- State Minnesota
- 46 Balanced · D+2
- County
- — inherits STATE
- City Minneapolis
- 34 Tenant-Leaning · D+50
ZIP-level market 55401
- Home prices YoY
- -0.2%
- Rents YoY
- 5.5%
- Active inventory
- 160
- Price-to-rent
- 6.1×
Monthly cashflow live
- Estimated rent
- $4,779 high interval (Pro) →
- Mortgage (P&I)
- −$1,835
- Tax est. 1.5%
- −$438 /mo · $5,250/yr
- Insurance
- −$146
- HOA
- −$1,234
- Vacancy / Maint / Mgmt
- −$1,004
- Net cashflow
- $123
Break-even live
UW: 25.0% down · 7.5% · 30yr · 1.5% tax · 5.0% vac · 8.0% maint · 8.0% mgmt
Financing live
Cash to close
- Down payment
- $87,500
- Closing costs
- $10,500
- Reserves months
- —
- Total cash needed
- —
Loan-product check · same deal, 3 products live
Conventional
25% down · 7.5% · 30yr
- Down + closing
- —
- Monthly P&I
- —
- Monthly cashflow
- —
- DSCR
- —
- Eligible?
- —
Personal DTI + credit; lowest rate.
DSCR
20% down · 8.5% · 30yr
- Down + closing
- —
- Monthly P&I
- —
- Monthly cashflow
- —
- DSCR
- —
- Eligible?
- —
No personal income docs; deal must DSCR.
Hard money
10% down · 12.0% · 12mo
- Down + closing
- —
- Monthly P&I
- —
- Monthly cashflow
- —
- DSCR
- —
- Eligible?
- —
Short-term bridge; refi at stabilization.
Rent comps 40 comps
| Address | Beds | Baths | Sqft | Rent | $/sqft | DOM | Units | Dist |
|---|---|---|---|---|---|---|---|---|
| 365 Nicollet Mall Minneapolis, MN | 3.0 | 1.0–3.5 | 1656 | $9,753 | $5.89 | 3d | 33 | 0.14mi |
| 400 Marquette Ave Minneapolis, MN | 3.0 | 1.0–2.0 | 1103 | $5,615 | $5.09 | 2d | 14 | 0.16mi |
| 465 Nicollet Mall Minneapolis, MN | 2.0 | 1.0–3.0 | 1153 | $4,620 | $4.01 | 2d | 14 | 0.19mi |
| 101 S 5th St Minneapolis, MN | 3.0 | 1.0–2.0 | 1249 | $4,049 | $3.24 | 2d | 35 | 0.21mi |
| 270 Hennepin Ave Minneapolis, MN | 3.0 | 1.0–3.0 | 1505 | $9,421 | $6.26 | 2d | 54 | 0.24mi |
| 120 Hennepin Ave Minneapolis, MN | 2.0 | 1.0–2.0 | 960 | $3,665 | $3.82 | 8d | 10 | 0.26mi |
| 222 Hennepin Ave Minneapolis, MN | 1.0–2.0 | 1.0–2.0 | 994 | $4,175 | $4.20 | 2d | 12 | 0.26mi |
| 511 S 4th St Minneapolis, MN | 2.0 | 1.0–2.0 | 882 | $2,945 | $3.34 | 2d | 11 | 0.29mi |
| 608 2nd Ave S Minneapolis, MN | 2.0 | 1.0–2.0 | 999 | $2,300 | $2.30 | 3d | 34 | 0.29mi |
| 250 Portland Ave Minneapolis, MN | 1.0–2.0 | 1.0–2.0 | 902 | $3,372 | $3.74 | 3d | 11 | 0.30mi |
| 120 N 2nd St Minneapolis, MN | 1.0–2.0 | 1.0–2.5 | 1039 | $3,428 | $3.30 | 2d | 19 | 0.34mi |
| 600 5th Ave S Minneapolis, MN | 1.0–2.0 | 1.0–2.0 | 915 | $3,315 | $3.62 | 2d | 9 | 0.35mi |
| 110 N 1st St Minneapolis, MN | 1.0–2.0 | 1.0–2.0 | 885 | $3,799 | $4.29 | 2d | 20 | 0.36mi |
| 240 Park Ave Minneapolis, MN | 1.0–2.0 | 1.0–2.0 | 1047 | $3,875 | $3.70 | 3d | 2 | 0.38mi |
| 650 Portland Ave Minneapolis, MN | 2.0 | 1.0–2.0 | 1104 | $4,141 | $3.75 | 3d | 18 | 0.42mi |
| 700 S 4th St Minneapolis, MN | 2.0 | 1.0–2.0 | 897 | $3,995 | $4.45 | 2d | 26 | 0.44mi |
| 615 S 8th St Minneapolis, MN | 2.0 | 1.0–2.5 | 1248 | $6,125 | $4.91 | 2d | 52 | 0.54mi |
| 212 10th Ave S Minneapolis, MN | 3.0 | 1.0–2.5 | 1490 | $8,588 | $5.76 | 2d | 10 | 0.61mi |
| 360 N 5th Ave Minneapolis, MN | 2.0 | 1.0–2.5 | 1185 | $7,325 | $6.18 | 2d | 85 | 0.62mi |
| 432 N 1st St Minneapolis, MN | 1.0–2.0 | 1.0–2.0 | 1067 | $2,175 | $2.04 | 3d | 6 | 0.67mi |
| 1111 3rd Ave S Unit 1511914P Minneapolis, MN | 4.0 | 1.0–2.0 | 1081 | $9,693 | $8.97 | 3d | 2 | 0.70mi |
| 1010 S 7th St Minneapolis, MN | 2.0 | 1.0–2.0 | 834 | $2,725 | $3.27 | 44d | 1 | 0.73mi |
| 200 University Ave SE Minneapolis, MN | 3.0 | 1.0–3.0 | 1554 | $8,035 | $5.17 | 2d | 25 | 0.74mi |
| 1120 S 2nd St #213 Minneapolis, MN | 2.0 | 2.0 | 1532 | $3,895 | $2.54 | 15d | 1 | 0.76mi |
| 721 N 3rd St Minneapolis, MN | 3.0 | 1.0–2.0 | 972 | $4,630 | $4.76 | 2d | 10 | 0.82mi |
| 401 1st Ave NE Minneapolis, MN | 2.0 | 1.0–2.0 | 922 | $3,733 | $4.05 | 2d | 9 | 0.86mi |
| 735 E 16th St #2 Minneapolis, MN | 3.0 | 1.0 | 1296 | $1,650 | $1.27 | 24d | 1 | 0.91mi |
| 110 6th Ave NE Minneapolis, MN | 2.0 | 1.0–2.0 | 831 | $3,109 | $3.74 | 3d | 8 | 0.93mi |
| 617 Marshall St NE Minneapolis, MN | 4.0 | 2.0 | 1879 | $3,495 | $1.86 | 18d | 1 | 0.93mi |
| 20 6th St NE Minneapolis, MN | 2.0 | 1.0–2.0 | 858 | $2,936 | $3.42 | 2d | 9 | 0.94mi |
| 915 Washington Ave N Minneapolis, MN | 2.0 | 2.0–2.5 | 1215 | $2,549 | $2.10 | 2d | 5 | 0.98mi |
| 1369 Spruce Pl Minneapolis, MN | 1.0–3.0 | 1.0–2.5 | 1396 | $6,750 | $4.83 | 3d | 24 | 1.02mi |
| 415 6th St SE Unit 1 Minneapolis, MN | 4.0 | 2.0 | 2400 | $3,160 | $1.32 | 3d | 1 | 1.06mi |
| 711 4th St SE Minneapolis, MN | 4.0 | 1.0–2.0 | 1667 | $2,625 | $1.57 | 44d | 51 | 1.11mi |
| 623 Spring St NE Unit 623 Minneapolis, MN | 3.0 | 2.0 | 1650 | $2,600 | $1.58 | 44d | 1 | 1.14mi |
| 621 6th St SE Minneapolis, MN | 4.0 | 2.0 | 2000 | $4,000 | $2.00 | 14d | 1 | 1.16mi |
| 1000 University Ave SE Minneapolis, MN | 2.0–4.0 | 1.0–2.0 | 1136 | $2,465 | $2.17 | 24d | 9 | 1.19mi |
| 1819 15th Ave S Minneapolis, MN | 3.0 | 1.5 | 1700 | $2,050 | $1.21 | 14d | 1 | 1.25mi |
| 430 Oak Grove St Minneapolis, MN | 1.0–2.0 | 1.0–2.0 | 1085 | $4,450 | $4.10 | 14d | 7 | 1.27mi |
| 415 Oak Grove St Minneapolis, MN | 2.0 | 1.0–2.0 | 1019 | $3,590 | $3.52 | 3d | 12 | 1.28mi |
HOA detail condo
- Monthly dues
- $1,234 · $14,808/yr
- Likely covers
- poolgymsecurity
- Assessments
- None detected in remarks — confirm with the listing agent.
Listing history 25 events
-
2026-06-18days on market $350,000 Active 148 DOM
-
2026-06-17days on market $350,000 Active 147 DOM
-
2026-06-16days on market $350,000 Active 146 DOM
-
2026-06-15price $350,000 Active 145 DOM
-
2026-06-15days on market $375,000 Active 145 DOM
-
2026-06-13days on market $375,000 Active 143 DOM
-
2026-06-09days on market $375,000 Active 139 DOM
-
2026-06-08days on market $375,000 Active 138 DOM
-
2026-06-07days on market $375,000 Active 137 DOM
-
2026-06-04days on market $375,000 Active 134 DOM
-
2026-06-03days on market $375,000 Active 133 DOM
-
2026-06-02days on market $375,000 Active 132 DOM
-
2026-06-01days on market $375,000 Active 131 DOM
-
2026-05-31days on market $375,000 Active 130 DOM
-
2026-05-01price $375,000 1106-char remark
Show marketing remark (1106 chars)
Rarely available THREE BEDROOM corner condo on the SKYWAY with a balcony overlooking the city! 70K kitchen remodel with custom cabinets, mosaic backsplash and stainless steel appliances. Custom vanities in both baths. Spacious primary suite with walk in closet. Ample storage in this unit along with an additional storage locker. Gorgeous city views from FIVE windows! Streaming sunlight all day! Amenity enriched building with 24 hour security, rooftop heated pool with big city views, new grilling and game area with beautiful firepits, hot tub, sauna, gym and heated garage. Highly walkable Mill District neighborhood just two blocks to the river! The required sliding glass door replacement has been completed by the seller. Quick stroll to Whole Foods, Trader Joes, US Bank Stadium, Target Center, Stone Arch Bridge, the Guthrie and a host of the best restaurants, bars & coffee shops in the city. City living at it's best! Common areas are being remodeled starting in April to include lobby, elevators, residential hallways etc. Please see rendition by mailbox receiving area on lobby level.
-
2026-01-22$385,000 Active 1106-char remark
Show marketing remark (1106 chars)
Rarely available THREE BEDROOM corner condo on the SKYWAY with a balcony overlooking the city! 70K kitchen remodel with custom cabinets, mosaic backsplash and stainless steel appliances. Custom vanities in both baths. Spacious primary suite with walk in closet. Ample storage in this unit along with an additional storage locker. Gorgeous city views from FIVE windows! Streaming sunlight all day! Amenity enriched building with 24 hour security, rooftop heated pool with big city views, new grilling and game area with beautiful firepits, hot tub, sauna, gym and heated garage. Highly walkable Mill District neighborhood just two blocks to the river! The required sliding glass door replacement has been completed by the seller. Quick stroll to Whole Foods, Trader Joes, US Bank Stadium, Target Center, Stone Arch Bridge, the Guthrie and a host of the best restaurants, bars & coffee shops in the city. City living at it's best! Common areas are being remodeled starting in April to include lobby, elevators, residential hallways etc. Please see rendition by mailbox receiving area on lobby level.
-
2026-01-20historical $385,000 1106-char remark
Show marketing remark (1106 chars)
Rarely available THREE BEDROOM corner condo on the SKYWAY with a balcony overlooking the city! 70K kitchen remodel with custom cabinets, mosaic backsplash and stainless steel appliances. Custom vanities in both baths. Spacious primary suite with walk in closet. Ample storage in this unit along with an additional storage locker. Gorgeous city views from FIVE windows! Streaming sunlight all day! Amenity enriched building with 24 hour security, rooftop heated pool with big city views, new grilling and game area with beautiful firepits, hot tub, sauna, gym and heated garage. Highly walkable Mill District neighborhood just two blocks to the river! The required sliding glass door replacement has been completed by the seller. Quick stroll to Whole Foods, Trader Joes, US Bank Stadium, Target Center, Stone Arch Bridge, the Guthrie and a host of the best restaurants, bars & coffee shops in the city. City living at it's best! Common areas are being remodeled starting in April to include lobby, elevators, residential hallways etc. Please see rendition by mailbox receiving area on lobby level.
-
1999-06-23soldstatus $175,000
-
1999-06-01soldstatus $175,000
-
1999-04-10historical
-
1999-04-04$179,900
-
1996-01-05soldstatus $129,900
-
1995-12-13soldstatus $129,900
-
1995-10-28historical
-
1995-10-04$129,900
ⓘ Source: listings_history table (triggers on properties + properties_extension) + one-shot
backfill from property_details.listing_events for pre-trigger history.
Climate risk First Street
- Flood 1/10 Low FEMA zone X (unshaded) · 0% chance over 30 yrs
- Wildfire 1/10 Low
- Heat 2/10 Low 7 d/yr ≥99°F today · 14 d/yr by 30 yrs out
- Wind 2/10 Low
- Air quality 2/10 Low 1 unhealthy d/yr today · 1 by 30 yrs out
Nearby sold comps map
Loading sold comps map…
Walkable amenities ~0.75 mi
Loading nearby amenities…
Taxation est. · year 1
- Rental income
- $57,354
- − Mortgage interest
- −$19,605
- − Property taxes
- −$5,250
- − Insurance
- −$1,750
- − Repairs & maintenance
- −$4,588
- − Management
- −$4,588
- − HOA
- −$14,808
- − Depreciation
- −$10,182
- Taxable loss
- −$3,418
- Est. tax savings @ 24.0%
- +$820
- After-tax cash flow
- $2,296/yr
For passive investors: Depreciation is non-cash, so a rental often shows a tax loss while cash-flowing — sheltering income. Rental losses are passive: they offset passive income freely, and up to $25,000/yr can offset ordinary (W-2) income if you actively participate and your MAGI is under $100k (phasing out to $0 by $150k); unused losses carry forward. On sale, claimed depreciation is recaptured at up to 25%, and gains may owe capital-gains tax (a 1031 exchange can defer both). Figures are a year-1 estimate at your 24.0% rate — not tax advice; consult a CPA.
Schools (NCES district)
- District
- Minneapolis Public School District
- NCES district ID
- 2721240
- Math proficiency
- 35% ▼ -7.00%
- Reading proficiency
- 46% ▼ -1.00%
- Median HH income
- $50,521
- Composite
- 34.92/100
- National rank
- #5067
- State rank
- #217 of 301 in MN
Livability — Minneapolis
- Score
- 78/100
- State rank
- #110
- US rank
- #2525
Category grades
Schools grade is shown separately in the Schools card above.
Census & demographics
- Census place
- Minneapolis, MN
- County
- Hennepin County · 1,150,272 people
- City population
- 417,555
- Metro
- Minneapolis-St. Paul-Bloomington, MN-WI
- Population (ZIP)
- 11,816
- Household income
- $113,522
- Rent vs Own
- Severe rent burden
- 610.0
Population outlook (Hennepin County) Hauer SSP2
- Today (2025)
- 1,405,227 people
- By 2030
- 1,492,650 · +6.2%
- By 2040
- 1,660,157 · +18.1%
- By 2050
- 1,823,498 · +29.8%
- By 2075
- 2,221,283 · +58.1%
- By 2100
- 2,509,976 · +78.6%
Race, ethnicity, and origin ACS 2023
- Neighborhood character
- Predominantly White (75%)
- Race & ethnicity
- White 75% Asian 9% Hispanic / Latino 8% Two or more races 6% Black 5%
- Hispanic origin (detail)
- Mexican 4%
- Common ancestry
- Portuguese 10% Romanian 7% Lithuanian 5%
- Foreign-born
- 13% · Canada, China, South Korea
- Languages at home
- 86% English-only · Spanish 6% Other Indo-European 3% Chinese 2%
Political lean MEDSL · Hennepin
- 2024 margin
- Solid D (+42.6) · D 70.2% · R 27.5% · Other 2.3%
- 2008→2024 swing
- +14.0pp toward D · 2008: 28.6pp · 2024: 42.6pp
- All cycles
- 2024: D+42.6 2020: D+43.2 2016: D+35.3 2012: D+27.1 2008: D+28.6
Not yet ingested
- Civics
- —
Market trends
- HPI YoY
- ▼ -0.42%
- Current HPI
- 233.936
- Rent YoY
- ▲ 5.49%
- Metro
- Minneapolis-St. Paul-Bloomington, MN-WI
- State GDP YoY
- ▲ 2.41%
- F500 in state
- 34
Industry mix (Fortune 500 HQ in MN)
| Industry | F500 HQs | Revenue |
|---|---|---|
| Healthcare | 2 | $407B |
|
||
| Retail | 2 | $150B |
|
||
| Consumer Goods | 2 | $32B |
|
||
| Industrial Machinery | 2 | $6B |
|
||
| Agriculture | 1 | $40B |
|
||
| Healthcare / Medical Devices | 1 | $32B |
|
||
Price history
+188.7% since first listed11 events — show timeline
- 2026-05-01 Price Changed $375,000 NORTHSTARMLS as Distributed by MLS Grid
- 2026-01-22 Listed $385,000 NORTHSTARMLS as Distributed by MLS Grid
- 2026-01-20 Coming Soon $385,000 NORTHSTARMLS as Distributed by MLS Grid
- 1999-06-23 Sold (Public Records) $175,000 Public Records
- 1999-06-01 Sold (MLS) $175,000 NORTHSTARMLS as Distributed by MLS Grid
- 1999-04-10 Listing Removed — NORTHSTARMLS as Distributed by MLS Grid
- 1999-04-04 Listed $179,900 NORTHSTARMLS as Distributed by MLS Grid
- 1996-01-05 Sold (Public Records) $129,900 Public Records
- 1995-12-13 Sold (MLS) $129,900 NORTHSTARMLS as Distributed by MLS Grid
- 1995-10-28 Listing Removed — NORTHSTARMLS as Distributed by MLS Grid
- 1995-10-04 Listed $129,900 NORTHSTARMLS as Distributed by MLS Grid
Property tax history
+3.0%/yrLatest (2025): $297 · +26.6% YoY. Source: county tax records.
Cash-flow waterfall
monthlySold comps — $/sqft
last 12 mo · ≤1 miLoading sold comps…