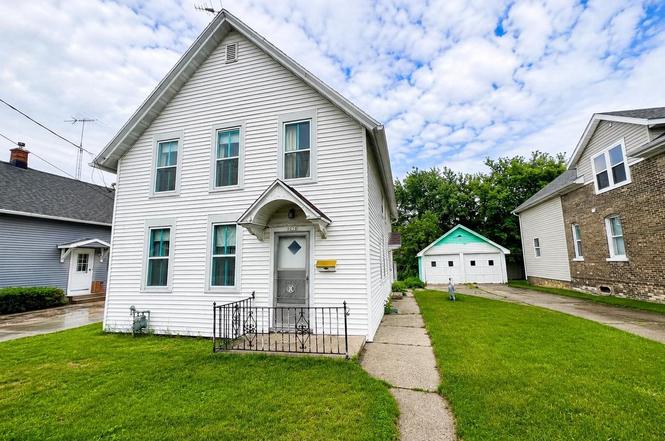
927 S 23rd St · Manitowoc, WI
Flood risk 1/10 · Minimal
- FEMA flood zone
- X (unshaded)
- Chance of flooding over 30 yrs
- 0.0%
- Est. flood insurance / yr
- $473 – $860
Fire risk 1/10 · Minimal
- Est. fire insurance / yr
- $636 – $1,182
Heat risk 1/10 · Minimal
- Hot days now (above 91°F)
- 7 days/yr
- Hot days in 30 yrs
- 14 days/yr
Wind risk 1/10 · Minimal
- Chance of severe wind over 30 yrs
- —
Air-quality risk 2/10 · Minimal
- Unhealthy air days now
- 1 days/yr
- Unhealthy air days in 30 yrs
- 2 days/yr
Risk factors via First Street. Map © Google.
Why this score? — see what drove the D+ grade
The composite is a weighted blend of 9 inputs, each scored 0–100. Each bar is that input's sub-score; the figure is the points it added to the 100-point composite (weight × sub-score).
- ARV discount +15.0/15.0
- Cash flow +14.2/30.0
- DSCR +4.3/10.0
- 1% rule +4.1/10.0
- Livability +4.0/5.0
- Rent growth +2.5/5.0
- Condition / age +2.5/5.0
- Schools +2.3/10.0
- Appreciation +0.0/10.0
$129,900
🖨 Deal sheet (PDF) 📄 Offer letter ✓ Due diligence
Listing remarks
Spacious 4 bed, 2 bath property located in Manitowoc offering flexibility and plenty of potential. Currently being used as a single family home, this property can be converted back into an upper/lower duplex, with each unit featuring 2 bedrooms and 1 bathroom. The home offers generous living space throughout, making it a great option for an owner occupant, investor, or anyone looking for a property with future income potential. Enjoy a large backyard with room to relax, garden, entertain, or create your ideal outdoor setup. A 2 stall detached garage provides convenient parking and additional storage. Bring your ideas and make the most of this versatile property. Schedule your showing today!
Key facts
- Upper lower duplex
- Large backyard
- Detached garage
Tags
Property features AI
Finance
- Other: Two-unit building (each unit ~851 sq ft)
Exterior
- Utilities: Municipal water; Municipal sewer; Natural gas
- Home design: Multi-family property; 2-story / bi-level configuration; Residential zoning
- Construction: Information source for year built: Assessor/Public Record
- Exterior features: Vinyl exterior; Level lot
Interior
- Kitchen: Unit 2 kitchen ~12 x 12; Includes oven/range
- Bedrooms: Unit 1: 2 bedrooms; Unit 2: 2 bedrooms (master ~14 x 11, second ~12 x 8)
- Bathrooms: Unit 1: 1 full bathroom; Unit 2: 1 full bathroom
- Heating & cooling: Forced air heating; Central air conditioning; Natural gas heat fuel
- Interior features: Full stone basement
Neighborhood map
What this means for you Summary
Snapshot
- This is a 2-bed/2.0-bath single-family listed at $130k.
Deal economics
- At list price, monthly cash flow is $21 ($252/yr) — positive.
- The deal already cash-flows at list — no discount required.
- To meet the 1% rule (rent ≥ 1% of price), the offer needs to be $119k (8.5% below list).
- Recommended offer: $119k (8.5% below list) — sets the bar for 1% rule.
- Cap rate 6.5% vs local median 2.7% in Manitowoc — top-decile yield for the area; either an underpriced asset or a hidden risk that comps aren't pricing in. Stress-test before assuming the spread holds.
Location & tenants
- Location reads 81/100 on livability (#56 in WI, #1,555 nationally) — a professional / high-income tenant draw. Strengths: commute A+, cost of living A+, housing A+; Watch: schools D, amenities F.
- Manitowoc School District (town): math 23% / reading 30% proficiency, ranked #304 of 342 in WI (top 89%) — low school quality limits family demand, transient renter base, plan for 1-2y turnover.
- Market conditions: 98 active listings in the ZIP; 100 units permitted in Manitowoc County in 2024 (0 in 5+ unit buildings).
Forward outlook
- Local home prices are declining (-3.0%/yr); year-one equity from $898 of loan paydown is wiped out by about $4k of value loss. Plan a longer hold.
- Manitowoc County population projected at -21% by 2050 — secular population decline; favor cash flow + early exit over multi-decade hold.
Negotiation context
- Only 3 days on market — expect competitive offers; lowballing is unlikely to land.
Risks & watch-outs
- Watch-outs: built in 1920 — expect roof / HVAC / electrical / plumbing capex.
Questions for the listing agent
- Built in 1920 — when were the roof, HVAC, electrical panel, plumbing, and water heater last replaced?
- Is there a deadline driving the sale (1031 exchange, divorce, estate, relocation)? That informs how much negotiation room exists.
- Schools are D-rated, which usually means shorter tenancies and higher turnover. Who's the typical renter profile here, and what's been the actual vacancy rate?
- The area grade is low — what's the realistic commute time and amenity access for the typical tenant pool here? Any planned neighborhood developments (good or bad) we should know about?
- What's the average days-on-market for RENTAL listings here right now (not sales)? A rising rental-DOM trend means longer vacancies and softer asking-rent achievability than the comps imply.
- What's the recent tenant-quality profile in this submarket — average credit score on applications, eviction rate, late-payment / NSF rate, and stable-employment percentage? A property-management company in the area should have these aggregated.
- How much new for-sale + rental construction is in the pipeline within 1–3 miles? Heavy new supply typically softens prices + rents 12–24 months out; constrained supply supports both.
Investment metrics
- 1% rule
- 0.91% ✗
- Cap rate
- 6.49%
- Cash-on-cash
- 0.69%
- DSCR
- 1.03
- GRM
- 9.1
CMA / ARV
- ARV (on-the-fly)
- $221,705
- Comps found
- 12
Show comp detail 12 sales within ~0.75 mi
| Address | Dist | Beds/Ba | Sqft | Sold | Price | $/sf | Match |
|---|---|---|---|---|---|---|---|
| 1013 S 22nd St | 0.12mi | 3/1.5 (+1) | 1,523 (-0%) | 4mo | $250,000 | $164 | 84 |
| 1110 S 24th St | 0.22mi | 3/2.0 (+1) | 1,528 (-0%) | 8mo | $195,000 | $128 | 78 |
| 2111 Hamilton St | 0.32mi | 3/2.0 (+1) | 1,473 (-4%) | 1mo | $175,000 | $119 | 73 |
| 1223 S 25th St | 0.38mi | 2/2.0 | 1,443 (-6%) | 5mo | $231,000 | $160 | 69 |
| 519 Riverview Dr | 0.51mi | 3/2.0 (+1) | 1,520 (-1%) | 2mo | $255,000 | $168 | 69 |
| 1122 S 22nd St | 0.24mi | 3/1.0 (+1) | 1,387 (-9%) | 2mo | $190,000 | $137 | 63 |
| 2315 Clark St | 0.17mi | 3/1.0 (+1) | 1,365 (-11%) | 3mo | $103,000 | $75 | 63 |
| 1030 S 21st St | 0.16mi | 3/2.0 (+1) | 1,728 (+13%) | 5mo | $200,000 | $116 | 61 |
| 1144 S 25th St | 0.31mi | 3/1.0 (+1) | 1,391 (-9%) | 1mo | $202,100 | $145 | 60 |
| 1409 S 26th St | 0.58mi | 3/2.0 (+1) | 1,684 (+10%) | 0mo | $255,000 | $151 | 50 |
| 625 S 27th St | 0.39mi | 3/1.5 (+1) | 1,307 (-14%) | 2mo | $202,000 | $155 | 48 |
| 1503 S 25th St | 0.64mi | 3/1.0 (+1) | 1,651 (+8%) | 2mo | $225,000 | $136 | 46 |
Match score weights: distance 35% · size 25% · config 20% · recency 20%. Top-matched comps best support the ARV.
Projected returns pro-forma
-3.0% appreciation · 3.0% rent growth · sell at horizon
- IRR
- -15.2%
- Equity multiple
- 0.46×
- Total profit
- $-19,683
- Equity at exit
- $19,369
- IRR
- -6.6%
- Equity multiple
- 0.58×
- Total profit
- $-15,297
- Equity at exit
- $11,231
Cash invested: $36,372 (down + closing). Projections, not guarantees.
Landlord ↔ Tenant lean methodology
- Overall (STATE)
- 73 Landlord-Friendly
- State Wisconsin
- 73 Landlord-Friendly · R+2
- County
- — inherits STATE
- City
- — inherits STATE
ZIP-level market 54220
- Home prices YoY
- -25.5%
- Active inventory
- 98
- Price-to-rent
- 9.1×
Monthly cashflow live
- Estimated rent
- $1,188 medium interval (Pro) →
- Mortgage (P&I)
- −$681
- Tax from tax record
- −$183 /mo · $2,190/yr
- Insurance
- −$54
- HOA
- −$0
- Vacancy / Maint / Mgmt
- −$250
- Net cashflow
- $21
Break-even live
Sensitivity live
| Price | -10% $95 | -5% $58 | +0% $21 | +5% $-16 | +10% $-53 |
|---|---|---|---|---|---|
| Rent | -10% $-73 | -5% $-26 | +0% $21 | +5% $68 | +10% $115 |
| Rate | -1.0pp $86 | -0.5pp $54 | base $21 | +0.5pp $-13 | +1.0pp $-47 |
UW: 25.0% down · 7.5% · 30yr · 1.5% tax · 5.0% vac · 8.0% maint · 8.0% mgmt
Financing live
Cash to close
- Down payment
- $32,475
- Closing costs
- $3,897
- Reserves months
- —
- Total cash needed
- —
Loan-product check · same deal, 3 products live
Conventional
25% down · 7.5% · 30yr
- Down + closing
- —
- Monthly P&I
- —
- Monthly cashflow
- —
- DSCR
- —
- Eligible?
- —
Personal DTI + credit; lowest rate.
DSCR
20% down · 8.5% · 30yr
- Down + closing
- —
- Monthly P&I
- —
- Monthly cashflow
- —
- DSCR
- —
- Eligible?
- —
No personal income docs; deal must DSCR.
Hard money
10% down · 12.0% · 12mo
- Down + closing
- —
- Monthly P&I
- —
- Monthly cashflow
- —
- DSCR
- —
- Eligible?
- —
Short-term bridge; refi at stabilization.
Listing history 3 events
-
2026-06-21days on market $129,900 Active 3 DOM
-
2026-06-19remarks 699-char remark
-
2026-06-19$129,900 Active 1 DOM
ⓘ Source: listings_history table (triggers on properties + properties_extension) + one-shot
backfill from property_details.listing_events for pre-trigger history.
Tax reassessment forecast WI · Partial reset (capped growth)
- Current annual tax
- $2,190 · $183/mo
- Projected year-2 tax
- $2,297 · $191/mo
- Expected delta
- +$106/yr (+$9/mo · 4.9%)
ⓘ Screening estimate from a state-policy table — verify with the county assessor before closing.
Climate risk First Street
- Flood 1/10 Low FEMA zone X (unshaded) · 0% chance over 30 yrs
- Wildfire 1/10 Low
- Heat 1/10 Low 7 d/yr ≥91°F today · 14 d/yr by 30 yrs out
- Wind 1/10 Low
- Air quality 2/10 Low 1 unhealthy d/yr today · 2 by 30 yrs out
Nearby sold comps map
Loading sold comps map…
Walkable amenities ~0.75 mi
Loading nearby amenities…
Taxation est. · year 1
- Rental income
- $14,261
- − Mortgage interest
- −$7,276
- − Property taxes
- −$2,190
- − Insurance
- −$650
- − Repairs & maintenance
- −$1,141
- − Management
- −$1,141
- − Depreciation
- −$3,779
- Taxable loss
- −$1,916
- Est. tax savings @ 24.0%
- +$460
- After-tax cash flow
- $712/yr
For passive investors: Depreciation is non-cash, so a rental often shows a tax loss while cash-flowing — sheltering income. Rental losses are passive: they offset passive income freely, and up to $25,000/yr can offset ordinary (W-2) income if you actively participate and your MAGI is under $100k (phasing out to $0 by $150k); unused losses carry forward. On sale, claimed depreciation is recaptured at up to 25%, and gains may owe capital-gains tax (a 1031 exchange can defer both). Figures are a year-1 estimate at your 24.0% rate — not tax advice; consult a CPA.
Schools (NCES district)
- District
- Manitowoc School District
- NCES district ID
- 5508610
- Math proficiency
- 23% ▼ -8.00%
- Reading proficiency
- 30% ▼ -3.00%
- Median HH income
- $44,540
- Composite
- 22.76/100
- National rank
- #8029
- State rank
- #304 of 342 in WI
Livability — Manitowoc
- Score
- 81/100
- State rank
- #56
- US rank
- #1555
Category grades
Schools grade is shown separately in the Schools card above.
Census & demographics
- Census place
- Manitowoc, WI
- County
- Manitowoc County · 55,069 people
- City population
- 40,949
- Metro
- Manitowoc, WI
- Population (ZIP)
- 40,949
- Household income
- $66,035
- Rent vs Own
- Severe rent burden
- 825.0
Population outlook (Manitowoc County) Hauer SSP2
- Today (2025)
- 76,561 people
- By 2030
- 74,096 · -3.2%
- By 2040
- 67,752 · -11.5%
- By 2050
- 60,731 · -20.7%
- By 2075
- 48,723 · -36.4%
- By 2100
- 39,250 · -48.7%
Race, ethnicity, and origin ACS 2023
- Neighborhood character
- Predominantly White (85%)
- Race & ethnicity
- White 85% Hispanic / Latino 6% Two or more races 5% Asian 4% Black 1%
- Hispanic origin (detail)
- Mexican 4%
- Common ancestry
- Romanian 8% Lithuanian 6% Portuguese 4%
- Foreign-born
- 4% · Canada, China
- Languages at home
- 92% English-only · Spanish 4% Other Asian/Pacific 2% Chinese 1%
Political lean MEDSL · Manitowoc
- 2024 margin
- Strong R (+23.4) · D 37.6% · R 61.0% · Other 1.4%
- 2008→2024 swing
- -30.9pp toward R · 2008: 7.5pp · 2024: -23.4pp
- All cycles
- 2024: R+23.4 2020: R+23.2 2016: R+21.7 2012: R+2.8 2008: D+7.5
Not yet ingested
- Civics
- —
Market trends
- HPI YoY
- ▼ -88.08%
- Current HPI
- 256.8561
- Rent YoY
- —
- Metro
- Manitowoc, WI
- State GDP YoY
- ▲ 2.10%
- F500 in state
- 20
Industry mix (Fortune 500 HQ in WI)
| Industry | F500 HQs | Revenue |
|---|---|---|
| Industrial Machinery | 4 | $23B |
|
||
| Industrial Technology | 2 | $36B |
|
||
| Insurance | 1 | $36B |
|
||
| Professional Services | 1 | $19B |
|
||
| Utilities | 1 | $9B |
|
||
| Consumer Goods | 1 | $3B |
|
||
Price history
1 event — show timeline
- 2026-06-18 Listed $129,900 RANW
Property tax history
+4.0%/yrLatest (2025): $2,190 · +74.4% YoY. Source: county tax records.
Cash-flow waterfall
monthlySold comps — $/sqft
last 12 mo · ≤1 miLoading sold comps…