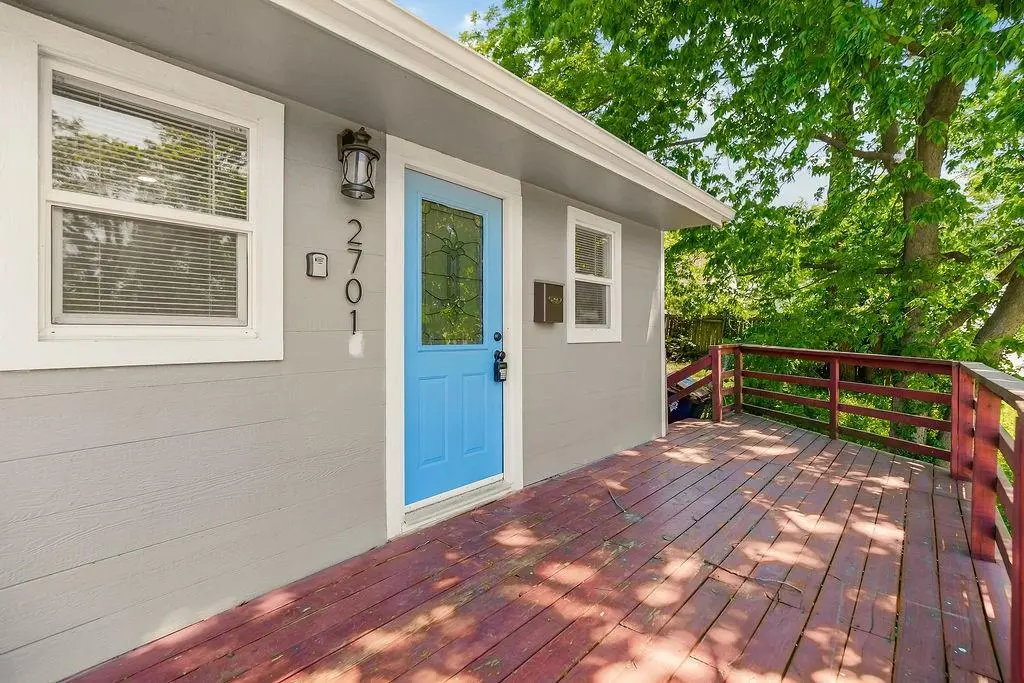
2701 Oakley Ave · Kansas City, MO
Flood risk 1/10 · Minimal
- FEMA flood zone
- X (unshaded)
- Chance of flooding over 30 yrs
- 0.0%
- Est. flood insurance / yr
- $473 – $860
Fire risk 1/10 · Minimal
- Est. fire insurance / yr
- $1,054 – $1,958
Heat risk 4/10 · Minor
- Hot days now (above 106°F)
- 7 days/yr
- Hot days in 30 yrs
- 17 days/yr
Wind risk 2/10 · Minimal
- Chance of severe wind over 30 yrs
- —
Air-quality risk 3/10 · Minor
- Unhealthy air days now
- 2 days/yr
- Unhealthy air days in 30 yrs
- 3 days/yr
Risk factors via First Street. Map © Google.
Why this score? — see what drove the C+ grade
The composite is a weighted blend of 9 inputs, each scored 0–100. Each bar is that input's sub-score; the figure is the points it added to the 100-point composite (weight × sub-score).
- Cash flow +25.6/30.0
- Appreciation +10.0/10.0
- DSCR +8.5/10.0
- 1% rule +5.7/10.0
- Livability +3.9/5.0
- Rent growth +3.7/5.0
- Condition / age +2.5/5.0
- Schools +1.5/10.0
- ARV discount +0.0/15.0
$109,900
🖨 Deal sheet 📄 Offer letter ✓ Due diligence
Listing remarks MLS
Come see this charming home featuring: three bedrooms, one bathroom, living room and dining room. Recently replaced roof, newer windows, brand new appliances, updated 200 amp electrical all electrical home. Don't miss out on this delightful home! Great opportunity for a rental property. Seller is related to Realtor.
Key facts
- 4,553 sq ft lot
- Built 1959
- Listed 25 days
Neighborhood map
What this means for you Summary
Snapshot
- This is a 2-bed/1.0-bath single-family listed at $110k.
Deal economics
- At list price, monthly cash flow is $260 ($3k/yr) — positive.
- The deal already cash-flows at list — no discount required.
- Meets the 1% rule at list price ($1k rent vs $110k).
- Recommended offer: $108k (1.5% below list) — sets the bar for market timing.
- Cap rate 9.1% vs local median 3.9% in Kansas City — top-decile yield for the area; either an underpriced asset or a hidden risk that comps aren't pricing in. Stress-test before assuming the spread holds.
Location & tenants
- Location reads 78/100 on livability (#28 in MO, #2,671 nationally) — a middle-class / working-renter tenant base. Strengths: amenities A+, commute A+, cost of living A+; Watch: schools C-, crime F.
- Kansas City 33 (urban): math 12% / reading 24% proficiency, ranked #308 of 324 in MO (top 95%) — low school quality limits family demand, transient renter base, plan for 1-2y turnover; 75% free/reduced lunch — lower-income household profile, screen leases tightly.
- Market conditions: Rents rising fast (+4.7%/yr); 86 active listings in the ZIP; 16 comparable units currently listed for rent nearby; rentals at typical pace (median 16d on market — plan ~3-4 weeks tenant-placement turnaround); lower-income renter base — watch delinquency; 4,002 units permitted in Jackson County in 2024 (2,271 in 5+ unit buildings).
- This rent runs 39% of the median local income ($36k/yr) — at the standard rent-burdened threshold; future hikes will face affordability resistance.
Forward outlook
- In year one you build about $12k of equity ($760 loan paydown + $11k appreciation (10.0% local appreciation)).
- Jackson County population projected at +4% by 2050 — modest demand growth; plan on rents tracking national, not racing it.
- At projected returns (10.0% appreciation + 4.7% rent growth), your $31k cash investment doubles in ~2 years — after that, you're playing with house money.
- By year 4, paydown + projected appreciation supports a ~$42k cash-out refi (75% LTV) — recoverable capital for the next deal without selling this one.
Negotiation context
- It's been on market 25 days — a 2% lower offer ($108k) is reasonable based on typical stale-listing flexibility.
- 2 sale attempts since 14y ago with the ask held roughly flat each time — persistent listings suggest the price (not the market) is what's stuck; bring a comps-based counter.
Risks & watch-outs
- Watch-outs: built in 1959 — expect roof / HVAC / electrical / plumbing capex.
Questions for the listing agent
- Built in 1959 — when were the roof, HVAC, electrical panel, plumbing, and water heater last replaced?
- Is there a deadline driving the sale (1031 exchange, divorce, estate, relocation)? That informs how much negotiation room exists.
- Crime grade is F in this area — have there been break-ins, vandalism, or insurance claims at this property in the last 3 years? What carrier currently insures it and at what premium?
- What's the average days-on-market for RENTAL listings here right now (not sales)? A rising rental-DOM trend means longer vacancies and softer asking-rent achievability than the comps imply.
- What's the recent tenant-quality profile in this submarket — average credit score on applications, eviction rate, late-payment / NSF rate, and stable-employment percentage? A property-management company in the area should have these aggregated.
- How much new for-sale + rental construction is in the pipeline within 1–3 miles? Heavy new supply typically softens prices + rents 12–24 months out; constrained supply supports both.
Investment metrics
- 1% rule
- 1.07% ✓
- Cap rate
- 9.13%
- Cash-on-cash
- 10.15%
- DSCR
- 1.45
- GRM
- 7.8
CMA / ARV
- ARV (median comp)
- $86,130
- List price
- $109,900
- Delta
- 27.60%
- Verdict
- OVERPRICED
- Comps
- 20 within 1.0 mi
Show comp detail 12 sales within ~0.75 mi
| Address | Dist | Beds/Ba | Sqft | Sold | Price | $/sf | Match |
|---|---|---|---|---|---|---|---|
| 5601 E 27th Ter | 0.05mi | 2/1.0 | 896 (-9%) | 0mo | $109,500 | $122 | 83 |
| 2543 Drury Ave | 0.17mi | 2/1.0 | 1,077 (+10%) | 0mo | $100,000 | $93 | 76 |
| 2835 Raytown Rd | 0.39mi | 3/1.0 (+1) | 958 (-3%) | 7mo | $185,000 | $193 | 67 |
| 5226 E 28th Ter | 0.26mi | 3/2.5 (+1) | 916 (-7%) | 4mo | $120,000 | $131 | 62 |
| 2451 Poplar Ave | 0.51mi | 3/1.0 (+1) | 1,042 (+6%) | 3mo | $52,000 | $50 | 59 |
| 2534 Lawn Ave | 0.63mi | 3/1.0 (+1) | 996 (+1%) | 14mo | $135,000 | $136 | 52 |
| 2830 Cypress Ave | 0.72mi | 3/1.0 (+1) | 1,043 (+6%) | 0mo | $29,900 | $29 | 51 |
| 2810 Elmwood Ave | 0.66mi | 2/1.0 | 856 (-13%) | 1mo | $120,000 | $140 | 47 |
| 3015 Quincy Ave | 0.51mi | 3/1.0 (+1) | 899 (-9%) | 12mo | $38,500 | $43 | 47 |
| 2237 Oakley Ave | 0.54mi | 3/1.0 (+1) | 889 (-10%) | 10mo | $150,000 | $169 | 45 |
| 2825 Kensington Ave | 0.74mi | 3/2.0 (+1) | 1,044 (+6%) | 11mo | $130,000 | $125 | 37 |
| 2416 Brighton Ave | 0.54mi | 3/1.5 (+1) | 1,122 (+14%) | 9mo | $90,000 | $80 | 37 |
Match score weights: distance 35% · size 25% · config 20% · recency 20%. Top-matched comps best support the ARV.
Projected returns pro-forma
10.0% appreciation · 4.65% rent growth · sell at horizon
- IRR
- 32.4%
- Equity multiple
- 3.55×
- Total profit
- $78,387
- Equity at exit
- $99,007
- IRR
- 28.4%
- Equity multiple
- 8.22×
- Total profit
- $222,059
- Equity at exit
- $213,512
Cash invested: $30,772 (down + closing). Projections, not guarantees.
Landlord ↔ Tenant lean methodology
- Overall (STATE)
- 81 Strongly Landlord-Friendly
- State Missouri
- 81 Strongly Landlord-Friendly · R+10
- County
- — inherits STATE
- City
- — inherits STATE
ZIP-level market 64128
- Home prices YoY
- 21.6%
- Rents YoY
- 4.7%
- Active inventory
- 86
- Price-to-rent
- 7.8×
Monthly cashflow live
- Estimated rent
- $1,181 high interval (Pro) →
- Mortgage (P&I)
- −$576
- Tax from tax record
- −$51 /mo · $611/yr
- Insurance
- −$46
- HOA
- −$0
- Vacancy / Maint / Mgmt
- −$248
- Net cashflow
- $260
Break-even live
UW: 25.0% down · 7.5% · 30yr · 1.5% tax · 5.0% vac · 8.0% maint · 8.0% mgmt
Financing live
Cash to close
- Down payment
- $27,475
- Closing costs
- $3,297
- Reserves months
- —
- Total cash needed
- —
Loan-product check · same deal, 3 products live
Conventional
25% down · 7.5% · 30yr
- Down + closing
- —
- Monthly P&I
- —
- Monthly cashflow
- —
- DSCR
- —
- Eligible?
- —
Personal DTI + credit; lowest rate.
DSCR
20% down · 8.5% · 30yr
- Down + closing
- —
- Monthly P&I
- —
- Monthly cashflow
- —
- DSCR
- —
- Eligible?
- —
No personal income docs; deal must DSCR.
Hard money
10% down · 12.0% · 12mo
- Down + closing
- —
- Monthly P&I
- —
- Monthly cashflow
- —
- DSCR
- —
- Eligible?
- —
Short-term bridge; refi at stabilization.
Rent comps 16 comps
| Address | Beds | Baths | Sqft | Rent | $/sqft | DOM | Units | Dist |
|---|---|---|---|---|---|---|---|---|
| 2855 Van Brunt Blvd Unit A Kansas City, MO | 2.0 | 1.0 | 744 | $1,080 | $1.45 | 43d | 1 | 0.26mi |
| 5108 E 30th St Kansas City, MO | 3.0 | 1.0 | 960 | $1,400 | $1.46 | 2d | 1 | 0.46mi |
| 3243 Denver Dr Kansas City, MO | 1.0–3.0 | 1.0 | 862 | $1,088 | $1.26 | 43d | 1 | 0.71mi |
| 3118 Chelsea Ave Kansas City, MO | 2.0 | 1.0 | 864 | $980 | $1.13 | 43d | 1 | 0.76mi |
| 2454 Cypress Ave Kansas City, MO | 3.0 | 1.0 | 800 | $1,300 | $1.62 | 3d | 1 | 0.76mi |
| 3032 Elmwood Ave Kansas City, MO | 3.0 | 1.0 | 1027 | $1,275 | $1.24 | 7d | 1 | 0.78mi |
| 2447 Norton Ave Kansas City, MO | 2.0 | 1.0 | 800 | $976 | $1.22 | 16d | 1 | 0.96mi |
| 2424 Norton Ave Unit B Kansas City, MO | 3.0 | 1.0 | 982 | $1,150 | $1.17 | 16d | 1 | 1.00mi |
| 1616 Hardesty Ave Unit 1-108 Kansas City, MO | 1.0 | 1.0 | 634 | $1,150 | $1.81 | 21d | 1 | 1.13mi |
| 1603 Elmwood Ave Kansas City, MO | 2.0 | 1.0 | 1064 | $1,031 | $0.97 | 12d | 1 | 1.27mi |
| 3437 Jackson Ave Kansas City, MO | 2.0 | 1.0 | 700 | $1,150 | $1.64 | 16d | 1 | 1.29mi |
| 2419 Bales Ave Kansas City, MO | 3.0 | 1.5 | 1116 | $1,500 | $1.34 | 2d | 1 | 1.33mi |
| 2225 Askew Ave Kansas City, MO | 2.0 | 1.0 | 864 | $1,050 | $1.22 | 43d | 1 | 1.33mi |
| 2213 Askew Ave Kansas City, MO | 2.0 | 1.0 | 865 | $1,002 | $1.16 | 19d | 1 | 1.34mi |
| 2413 College Ave Kansas City, MO | 2.0 | 2.0 | 1022 | $1,225 | $1.20 | 23d | 1 | 1.47mi |
| 4902 E 39th St Kansas City, MO | 2.0 | 1.0 | 820 | $1,300 | $1.59 | 16d | 1 | 1.48mi |
Listing history 18 events
-
2026-06-09days on market $109,900 Active 25 DOM
-
2026-06-08days on market $109,900 Active 24 DOM
-
2026-06-07days on market $109,900 Active 23 DOM
-
2026-06-05days on market $109,900 Active 20 DOM
-
2026-06-03days on market $109,900 Active 19 DOM
-
2026-06-02days on market $109,900 Active 18 DOM
-
2026-06-01days on market $109,900 Active 17 DOM
-
2026-05-31days on market $109,900 Active 16 DOM
-
2026-05-15$109,900 Active 676-char remark
-
2024-12-06soldstatus
-
2024-12-03soldstatus Closed 318-char remark
Show marketing remark (318 chars)
Come see this charming home featuring: three bedrooms, one bathroom, living room and dining room. Recently replaced roof, newer windows, brand new appliances, updated 200 amp electrical all electrical home. Don't miss out on this delightful home! Great opportunity for a rental property. Seller is related to Realtor.
-
2024-11-01status Pending 318-char remark
Show marketing remark (318 chars)
Come see this charming home featuring: three bedrooms, one bathroom, living room and dining room. Recently replaced roof, newer windows, brand new appliances, updated 200 amp electrical all electrical home. Don't miss out on this delightful home! Great opportunity for a rental property. Seller is related to Realtor.
-
2024-10-15$115,000 Active 318-char remark
Show marketing remark (318 chars)
Come see this charming home featuring: three bedrooms, one bathroom, living room and dining room. Recently replaced roof, newer windows, brand new appliances, updated 200 amp electrical all electrical home. Don't miss out on this delightful home! Great opportunity for a rental property. Seller is related to Realtor.
-
2014-04-14soldstatus
Show marketing remark (201 chars)
REO, Corporate Owned. NOT A SHORT SALE. Sold as is, where is. No seller disclosures available. Buyer to assume all liens and encumbrances, including, but not limited to, real estate taxes and HOA fees.
-
2012-10-13$3,900
Show marketing remark (201 chars)
REO, Corporate Owned. NOT A SHORT SALE. Sold as is, where is. No seller disclosures available. Buyer to assume all liens and encumbrances, including, but not limited to, real estate taxes and HOA fees.
-
2012-05-01soldstatus
-
2005-03-30soldstatus
-
1988-10-03soldstatus
ⓘ Source: listings_history table (triggers on properties + properties_extension) + one-shot
backfill from property_details.listing_events for pre-trigger history.
Tax reassessment forecast MO · Resets to sale price
- Current annual tax
- $611 · $51/mo
- Projected year-2 tax
- $1,066 · $89/mo
- Expected delta
- +$455/yr (+$38/mo · 74.4%)
ⓘ Screening estimate from a state-policy table — verify with the county assessor before closing.
Climate risk First Street
- Flood 1/10 Low FEMA zone X (unshaded) · 0% chance over 30 yrs
- Wildfire 1/10 Low
- Heat 4/10 Moderate 7 d/yr ≥106°F today · 17 d/yr by 30 yrs out
- Wind 2/10 Low
- Air quality 3/10 Moderate 2 unhealthy d/yr today · 3 by 30 yrs out
Nearby sold comps map
Loading sold comps map…
Walkable amenities ~0.75 mi
Loading nearby amenities…
Taxation est. · year 1
- Rental income
- $14,177
- − Mortgage interest
- −$6,156
- − Property taxes
- −$611
- − Insurance
- −$550
- − Repairs & maintenance
- −$1,134
- − Management
- −$1,134
- − Depreciation
- −$3,197
- Taxable income
- $1,394
- Est. tax owed @ 24.0%
- −$335
- After-tax cash flow
- $2,788/yr
For passive investors: Depreciation is non-cash, so a rental often shows a tax loss while cash-flowing — sheltering income. Rental losses are passive: they offset passive income freely, and up to $25,000/yr can offset ordinary (W-2) income if you actively participate and your MAGI is under $100k (phasing out to $0 by $150k); unused losses carry forward. On sale, claimed depreciation is recaptured at up to 25%, and gains may owe capital-gains tax (a 1031 exchange can defer both). Figures are a year-1 estimate at your 24.0% rate — not tax advice; consult a CPA.
Schools (NCES district)
- District
- Kansas City 33
- NCES district ID
- 2916400
- Math proficiency
- 12% ▼ -8.00%
- Reading proficiency
- 24% ▬ 0.00%
- Median HH income
- $35,227
- Composite
- 14.8/100
- National rank
- #9387
- State rank
- #308 of 324 in MO
Livability — Kansas City
- Score
- 78/100
- State rank
- #28
- US rank
- #2671
Category grades
Schools grade is shown separately in the Schools card above.
Census & demographics
- Census place
- Kansas City, MO
- County
- Jackson County · 687,798 people
- City population
- 439,467
- Metro
- Kansas City, MO-KS
- Population (ZIP)
- 11,912
- Household income
- $36,088
- Rent vs Own
- Severe rent burden
- 946.0
Population outlook (Jackson County) Hauer SSP2
- Today (2025)
- 719,589 people
- By 2030
- 731,456 · +1.6%
- By 2040
- 746,689 · +3.8%
- By 2050
- 749,289 · +4.1%
- By 2075
- 736,227 · +2.3%
- By 2100
- 668,210 · -7.1%
Race, ethnicity, and origin ACS 2023
- Neighborhood character
- Predominantly Black (79%)
- Race & ethnicity
- Black 79% Hispanic / Latino 9% White 8% Two or more races 7%
- Hispanic origin (detail)
- Mexican 6%
- Common ancestry
- Swedish 1% Hispanic 1%
- Foreign-born
- 7% · Canada
- Languages at home
- 88% English-only · Spanish 7% French/Haitian/Cajun 2%
Political lean MEDSL · Jackson
- 2024 margin
- D (+19.3) · D 58.9% · R 39.5% · Other 1.6%
- 2008→2024 swing
- -6.1pp toward R · 2008: 25.4pp · 2024: 19.3pp
- All cycles
- 2024: D+19.3 2020: D+22.0 2016: D+16.6 2012: D+19.0 2008: D+25.4
Not yet ingested
- Civics
- —
Market trends
- HPI YoY
- ▲ 73.41%
- Current HPI
- 412.6862
- Rent YoY
- ▲ 4.65%
- Metro
- Kansas City, MO-KS
- State GDP YoY
- ▲ 1.84%
- F500 in state
- 20
Industry mix (Fortune 500 HQ in MO)
| Industry | F500 HQs | Revenue |
|---|---|---|
| Healthcare | 1 | $163B |
|
||
| Insurance | 1 | $21B |
|
||
| Industrial Technology | 1 | $17B |
|
||
| Retail | 1 | $16B |
|
||
| Industrial Distribution | 1 | $10B |
|
||
| Utilities | 1 | $9B |
|
||
Price history
+2848.7% since first listed9 events — show timeline
- 2024-12-06 Sold (Public Records) — Public Records
- 2024-12-03 Sold (MLS) — Heartland MLS as Distributed by MLS Grid
- 2024-11-01 Pending — Heartland MLS as Distributed by MLS Grid
- 2024-10-15 Listed $115,000 Heartland MLS as Distributed by MLS Grid
- 2014-04-14 Sold (MLS) — Heartland MLS as Distributed by MLS Grid
- 2012-10-13 Listed $3,900 Heartland MLS as Distributed by MLS Grid
- 2012-05-01 Sold (Public Records) — Public Records
- 2005-03-30 Sold (Public Records) — Public Records
- 1988-10-03 Sold (Public Records) — Public Records
Property tax history
+3.3%/yrLatest (2025): $611 · +8.8% YoY. Source: county tax records.
Cash-flow waterfall
monthlySold comps — $/sqft
last 12 mo · ≤1 miLoading sold comps…