1922 Candlelight Dr · Chesapeake, VA
Flood risk 1/10 · Minimal
- FEMA flood zone
- X (unshaded)
- Chance of flooding over 30 yrs
- 0.0%
- Est. flood insurance / yr
- $507 – $1,088
Fire risk 1/10 · Minimal
- Est. fire insurance / yr
- $666 – $1,236
Heat risk 9/10 · Severe
- Hot days now (above 105°F)
- 7 days/yr
- Hot days in 30 yrs
- 16 days/yr
Wind risk 8/10 · Major
- Chance of severe wind over 30 yrs
- 80.0%
Air-quality risk 5/10 · Moderate
- Unhealthy air days now
- 6 days/yr
- Unhealthy air days in 30 yrs
- 7 days/yr
Risk factors via First Street. Map © Google.
Why this score? — see what drove the D grade
The composite is a weighted blend of 9 inputs, each scored 0–100. Each bar is that input's sub-score; the figure is the points it added to the 100-point composite (weight × sub-score).
- Cash flow +11.9/30.0
- ARV discount +10.1/15.0
- Schools +5.8/10.0
- DSCR +3.5/10.0
- Livability +3.5/5.0
- 1% rule +2.9/10.0
- Rent growth +2.5/5.0
- Condition / age +2.5/5.0
- Appreciation +0.0/10.0
$280,000
🖨 Deal sheet 📄 Offer letter ✓ Due diligence
Listing remarks
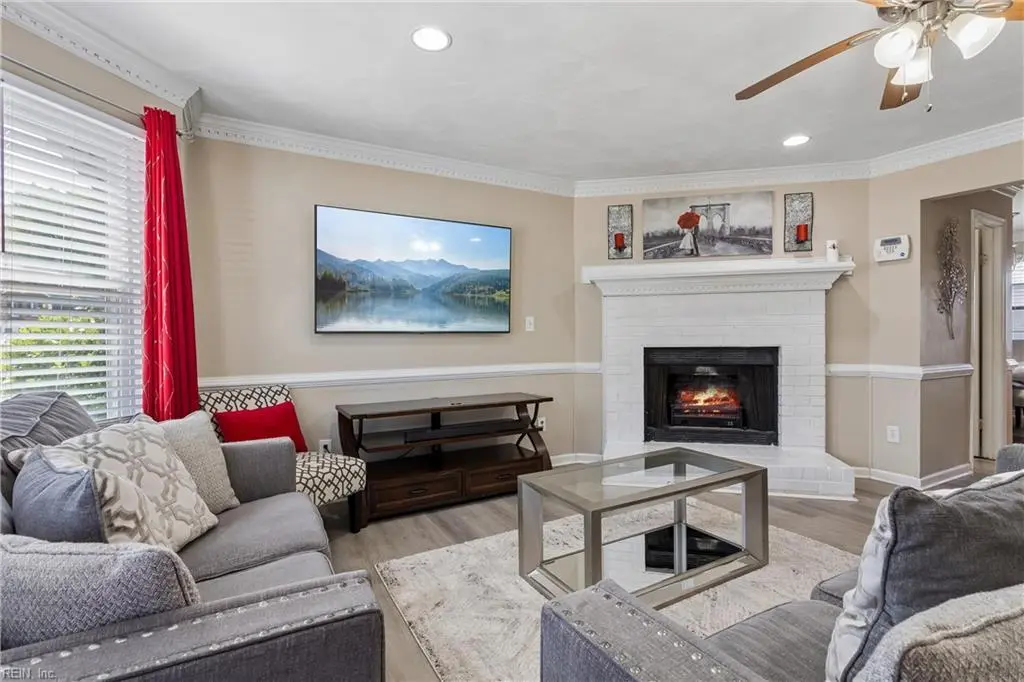
Welcome to your dream home located in the highly sought-after Georgetown section of Chesapeake, one of the most desirable cities in the Hampton Roads area! This charming 3 bedroom, 2.5 bathroom townhouse is suitable for anyone looking to start or restart their family journey. As you step inside, you are greeted by a warm and inviting living room, highlighted by a beautiful brick fireplace that is sure to capture your attention and provide a cozy atmosphere. The thoughtful updates throughout this home include newer stainless-steel appliances in the kitchen! New HVAC installed 2026, Flooring less than 1yr old. (LVP on the 1st floor is an absolute MUST SEE). No HOA fees which allow you the fre
Key facts
- Georgetown section
- Brick fireplace
- Nice-sized backyard
Tags
Property features AI
Finance
- HOA & community: No HOA fees (N/A / zero reported)
Exterior
- Parking: Off-street parking; Driveway spaces (2 total spaces)
- Security: Security system
- Utilities: City/County water; City/County sewer; Electric water heater
- Home design: Attached townhouse; Two stories (2 living levels); Slab foundation
- Construction: Brick and vinyl siding; Asphalt shingle roof
- Exterior features: Patio; Back, full wood fence
Interior
- Kitchen: Dishwasher; Garbage disposal; Microwave; Electric range; Refrigerator; Pantry; Breakfast area
- Bedrooms: One bedroom with ensuite; No bedroom and full bathroom on first floor
- Flooring: Carpet; Laminate
- Bathrooms: Two full bathrooms; One half bathroom
- Heating & cooling: Heat pump (provides heating and cooling); Forced hot air; Electric heating; Central air
- Interior features: Cable hookup; Ceiling fan; Security system; Electric fireplace; Scuttle access; Walk-in closet; Window treatments; One fireplace
- Laundry & utility: Washer; Dryer; Utility room
Neighborhood map
What this means for you Summary
Snapshot
- This is a 3-bed/3.0-bath townhouse listed at $280k.
Deal economics
- At list price, monthly cash flow is $-72 ($-861/yr) — negative.
- To cash-flow at today's rent, offer at most $267k (4.5% below list).
- To meet the 1% rule (rent ≥ 1% of price), the offer needs to be $220k (21.4% below list).
- Recommended offer: $220k (21.4% below list) — sets the bar for 1% rule.
- Cap rate 6.0% vs local median 3.7% in Chesapeake — top-decile yield for the area; either an underpriced asset or a hidden risk that comps aren't pricing in. Stress-test before assuming the spread holds.
Location & tenants
- Location reads 70/100 on livability (#236 in VA) — a middle-class / working-renter tenant base. Strengths: employment A+, housing A+; Watch: crime C-, cost of living C-, amenities F.
- Chesapeake City Public School District (suburban): math 58% / reading 74% proficiency, ranked #31 of 131 in VA (top 24%) — acceptable for families but not a draw, mixed tenant base, ~2y average lease.
- Zoned schools: Georgetown Primary (math 62% / reading 67%, grade B, #416 of 1,108 statewide, top 41%, 780 students, 92% FRL); Indian River High (math 69% / reading 73%, grade B+, #146 of 319 statewide, top 47%, 1,701 students, 71% FRL) — zoned schools average 82% FRL vs 28% district-wide (54 pts higher); higher-poverty schools than district average — tighter screening recommended.
- Market conditions: 62 active listings in the ZIP; 12 comparable units currently listed for rent nearby; rentals at typical pace (median 16d on market — plan ~3-4 weeks tenant-placement turnaround); 597 units permitted in Chesapeake city in 2024 (0 in 5+ unit buildings).
- This rent runs 38% of the median local income ($70k/yr) — at the standard rent-burdened threshold; future hikes will face affordability resistance.
Forward outlook
- Local home prices are declining (-3.0%/yr); year-one equity from $2k of loan paydown is wiped out by about $8k of value loss. Plan a longer hold.
- Chesapeake County population projected at +21% by 2050 — long-run rental-demand tailwind backs the buy-and-hold thesis.
Negotiation context
- It's been on market 19 days — a 2% lower offer ($276k) is reasonable based on typical stale-listing flexibility.
- 5 sale attempts since 10y ago with the ask held roughly flat each time — persistent listings suggest the price (not the market) is what's stuck; bring a comps-based counter.
- Current owner paid $239k; 17% above their basis — modest negotiation headroom, anchor on the comps not their cost.
Risks & watch-outs
- Climate carrying-cost: severe wind risk, 80% chance of damaging wind over 30y; extreme-heat days projected 7→16/yr by 2055 (HVAC capex compounding) — expect insurance premiums to compound above CPI over the hold.
Questions for the listing agent
- What do current leases actually rent for vs. the listed asking? Can we see a recent rent roll and the last 12 months of T-12 income?
- Is there a deadline driving the sale (1031 exchange, divorce, estate, relocation)? That informs how much negotiation room exists.
- Schools are A-rated — typically a magnet for longer-tenancy family renters. What's the average tenant stay here, and is there a school-zone premium baked into asking?
- The area grade is low — what's the realistic commute time and amenity access for the typical tenant pool here? Any planned neighborhood developments (good or bad) we should know about?
- What's the average days-on-market for RENTAL listings here right now (not sales)? A rising rental-DOM trend means longer vacancies and softer asking-rent achievability than the comps imply.
- What's the recent tenant-quality profile in this submarket — average credit score on applications, eviction rate, late-payment / NSF rate, and stable-employment percentage? A property-management company in the area should have these aggregated.
- How much new for-sale + rental construction is in the pipeline within 1–3 miles? Heavy new supply typically softens prices + rents 12–24 months out; constrained supply supports both.
Investment metrics
- 1% rule
- 0.79% ✗
- Cap rate
- 5.99%
- Cash-on-cash
- -1.10%
- DSCR
- 0.95
- GRM
- 10.6
CMA / ARV
- ARV (on-the-fly)
- $297,432
- Comps found
- 12
Show comp detail 12 sales within ~0.75 mi
| Address | Dist | Beds/Ba | Sqft | Sold | Price | $/sf | Match |
|---|---|---|---|---|---|---|---|
| 1922 Candlelight Dr | 0.00mi | 3/2.5 | 1,377 (0%) | 1mo | $290,000 | $211 | 97 |
| 2011 Candlelight Dr | 0.09mi | 3/2.5 | 1,400 (+2%) | 2mo | $310,000 | $221 | 90 |
| 2021 Candlelight Dr | 0.11mi | 3/2.5 | 1,421 (+3%) | 3mo | $280,000 | $197 | 85 |
| 2034 Allison Dr | 0.11mi | 3/2.5 | 1,451 (+5%) | 6mo | $250,000 | $172 | 79 |
| 2053 Allison Dr | 0.16mi | 2/2.5 (-1) | 1,446 (+5%) | 8mo | $239,900 | $166 | 71 |
| 1831 Hearthside Ct | 0.05mi | 3/1.5 | 1,218 (-12%) | 6mo | $268,000 | $220 | 67 |
| 2827 Estella Way | 0.46mi | 3/2.5 | 1,478 (+7%) | 2mo | $325,000 | $220 | 62 |
| 63 Colonial Way | 0.31mi | 3/1.5 | 1,221 (-11%) | 1mo | $180,000 | $147 | 60 |
| 69 Colonial Way | 0.32mi | 3/1.5 | 1,212 (-12%) | 2mo | $279,900 | $231 | 57 |
| 25 King George Quay | 0.41mi | 2/2.5 (-1) | 1,252 (-9%) | 8mo | $271,000 | $216 | 52 |
| 66 King George Quay | 0.51mi | 2/2.5 (-1) | 1,251 (-9%) | 4mo | $280,000 | $224 | 51 |
| 2223 Holly Berry Ln | 0.48mi | 3/2.5 | 1,535 (+12%) | 8mo | $329,000 | $214 | 50 |
Match score weights: distance 35% · size 25% · config 20% · recency 20%. Top-matched comps best support the ARV.
Projected returns pro-forma
-3.0% appreciation · 3.0% rent growth · sell at horizon
- IRR
- -18.1%
- Equity multiple
- 0.36×
- Total profit
- $-49,986
- Equity at exit
- $41,749
- IRR
- -10.4%
- Equity multiple
- 0.37×
- Total profit
- $-49,589
- Equity at exit
- $24,209
Cash invested: $78,400 (down + closing). Projections, not guarantees.
Landlord ↔ Tenant lean methodology
- Overall (STATE)
- 55 Moderately Landlord-Leaning
- State Virginia
- 55 Moderately Landlord-Leaning · D+2
- County
- — inherits STATE
- City
- — inherits STATE
ZIP-level market 23325
- Active inventory
- 62
- Price-to-rent
- 10.6×
Monthly cashflow live
- Estimated rent
- $2,200 high interval (Pro) →
- Mortgage (P&I)
- −$1,468
- Tax from tax record
- −$224 /mo · $2,693/yr
- Insurance
- −$117
- HOA
- −$0
- Vacancy / Maint / Mgmt
- −$462
- Net cashflow
- $-72
Break-even live
UW: 25.0% down · 7.5% · 30yr · 1.5% tax · 5.0% vac · 8.0% maint · 8.0% mgmt
Financing live
Cash to close
- Down payment
- $70,000
- Closing costs
- $8,400
- Reserves months
- —
- Total cash needed
- —
Loan-product check · same deal, 3 products live
Conventional
25% down · 7.5% · 30yr
- Down + closing
- —
- Monthly P&I
- —
- Monthly cashflow
- —
- DSCR
- —
- Eligible?
- —
Personal DTI + credit; lowest rate.
DSCR
20% down · 8.5% · 30yr
- Down + closing
- —
- Monthly P&I
- —
- Monthly cashflow
- —
- DSCR
- —
- Eligible?
- —
No personal income docs; deal must DSCR.
Hard money
10% down · 12.0% · 12mo
- Down + closing
- —
- Monthly P&I
- —
- Monthly cashflow
- —
- DSCR
- —
- Eligible?
- —
Short-term bridge; refi at stabilization.
Rent comps 12 comps
| Address | Beds | Baths | Sqft | Rent | $/sqft | DOM | Units | Dist |
|---|---|---|---|---|---|---|---|---|
| 1947 Candlelight Dr Chesapeake, VA | 3.0 | 2.5 | 1417 | $2,000 | $1.41 | 20d | 1 | 0.06mi |
| 67 King George Quay Chesapeake, VA | 3.0 | 1.5 | 1298 | $1,900 | $1.46 | 4d | 1 | 0.52mi |
| 3000 Waverton Pkwy Chesapeake, VA | 2.0–3.0 | 1.0–2.0 | 1037 | $1,510 | $1.46 | 23d | 1 | 0.71mi |
| 1212 Triple Crown Cir Chesapeake, VA | 1.0–2.0 | 1.0–2.0 | 965 | $2,180 | $2.26 | 2d | 24 | 0.84mi |
| 2540 Holly Point Blvd Chesapeake, VA | 1.0–3.0 | 1.0–2.0 | 1250 | $2,680 | $2.14 | 1d | 20 | 0.98mi |
| 1407 Kay Ave Chesapeake, VA | 3.0 | 1.0 | 1200 | $2,250 | $1.88 | 2d | 1 | 1.05mi |
| 1407 Kay Ave Chesapeake, VA | 3.0 | 1.0 | 1200 | $2,250 | $1.88 | 23d | 1 | 1.05mi |
| 103 Duffield Pl Chesapeake, VA | 3.0 | 2.0 | 1372 | $2,200 | $1.60 | 23d | 1 | 1.30mi |
| 929 Wintercress Way Chesapeake, VA | 3.0 | 1.0–2.0 | 898 | $2,742 | $3.05 | 4d | 17 | 1.36mi |
| 150 Coveside Ln Chesapeake, VA | 1.0–3.0 | 1.0–2.0 | 1120 | $2,779 | $2.48 | 2d | 29 | 1.47mi |
| 2620 Sunrise Ave Chesapeake, VA | 3.0 | 1.5 | 1462 | $1,850 | $1.27 | 23d | 1 | 1.48mi |
| 2001 Angora Dr Chesapeake, VA | 4.0 | 2.0 | 1539 | $2,850 | $1.85 | 16d | 1 | 1.49mi |
Listing history 22 events
-
2026-05-11status Under Contract
-
2026-05-06historical Active Under Contract
-
2026-05-04status Active
-
2026-04-27historical Active Under Contract
-
2026-04-22$280,000 Active
-
2022-10-03soldstatus $239,000
-
2022-09-09status Under Contract
-
2022-09-01historical Active Under Contract
-
2022-08-30$235,000 Active
-
2017-05-01soldstatus $158,000
-
2017-03-20status Under Contract
-
2017-02-03$159,000 Active
-
2017-01-13historical
-
2016-09-26price $159,000
-
2016-08-24price $161,000
-
2016-08-24price $159,900
-
2016-08-24$19,900 Active
-
2011-11-21soldstatus $141,000
-
2011-09-27soldstatus $70,000
-
2002-11-19soldstatus $80,000
-
1999-02-01soldstatus $73,900
-
1995-10-31soldstatus $72,200
ⓘ Source: listings_history table (triggers on properties + properties_extension) + one-shot
backfill from property_details.listing_events for pre-trigger history.
Tax reassessment forecast VA · Resets to sale price
- Current annual tax
- $2,693 · $224/mo
- Projected year-2 tax
- $2,693 · $224/mo
- Expected delta
- $0/yr ($0/mo · 0.0%)
ⓘ Screening estimate from a state-policy table — verify with the county assessor before closing.
Climate risk First Street
- Flood 1/10 Low FEMA zone X (unshaded) · 0% chance over 30 yrs
- Wildfire 1/10 Low
- Heat 9/10 Extreme 7 d/yr ≥105°F today · 16 d/yr by 30 yrs out
- Wind 8/10 Severe 80% chance of damaging wind over 30 yrs
- Air quality 5/10 Major 6 unhealthy d/yr today · 7 by 30 yrs out
Nearby sold comps map
Loading sold comps map…
Walkable amenities ~0.75 mi
Loading nearby amenities…
Taxation est. · year 1
- Rental income
- $26,395
- − Mortgage interest
- −$15,684
- − Property taxes
- −$2,693
- − Insurance
- −$1,400
- − Repairs & maintenance
- −$2,112
- − Management
- −$2,112
- − Depreciation
- −$8,145
- Taxable loss
- −$5,751
- Est. tax savings @ 24.0%
- +$1,380
- After-tax cash flow
- $519/yr
For passive investors: Depreciation is non-cash, so a rental often shows a tax loss while cash-flowing — sheltering income. Rental losses are passive: they offset passive income freely, and up to $25,000/yr can offset ordinary (W-2) income if you actively participate and your MAGI is under $100k (phasing out to $0 by $150k); unused losses carry forward. On sale, claimed depreciation is recaptured at up to 25%, and gains may owe capital-gains tax (a 1031 exchange can defer both). Figures are a year-1 estimate at your 24.0% rate — not tax advice; consult a CPA.
Schools (NCES district)
- District
- Chesapeake City Public School District
- NCES district ID
- 5100810
- Math proficiency
- 58% ▼ -29.00%
- Reading proficiency
- 74% ▼ -7.00%
- Median HH income
- $69,356
- Composite
- 57.84/100
- National rank
- #1047
- State rank
- #31 of 131 in VA
Livability — Chesapeake
- Score
- 70/100
- State rank
- #236
- US rank
- #7942
Category grades
Schools grade is shown separately in the Schools card above.
Census & demographics
- Census place
- Chesapeake, VA
- County
- Chesapeake City · 253,091 people
- City population
- 253,091
- Metro
- Virginia Beach-Norfolk-Newport News, VA-NC
- Population (ZIP)
- 19,138
- Household income
- $69,909
- Rent vs Own
- Severe rent burden
- 755.0
Population outlook (Chesapeake County) Hauer SSP2
- Today (2025)
- 263,804 people
- By 2030
- 276,798 · +4.9%
- By 2040
- 299,906 · +13.7%
- By 2050
- 318,284 · +20.7%
- By 2075
- 362,137 · +37.3%
- By 2100
- 372,225 · +41.1%
Race, ethnicity, and origin ACS 2023
- Neighborhood character
- Diverse neighborhood (Simpson 0.63)
- Race & ethnicity
- Black 45% White 40% Hispanic / Latino 7% Two or more races 7% Asian 4%
- Hispanic origin (detail)
- Mexican 2% Puerto Rican 2%
- Common ancestry
- Lithuanian 2% Italian 2% Serbian 1%
- Foreign-born
- 6% · Canada, China, Vietnam
- Languages at home
- 91% English-only · Spanish 3% Other Indo-European 2% Vietnamese 1%
Political lean MEDSL · Chesapeake
- 2024 margin
- Toss-up / Even · D 51.3% · R 47.5% · Other 1.2%
- 2008→2024 swing
- +2.5pp toward D · 2008: 1.3pp · 2024: 3.8pp
- All cycles
- 2024: D+3.8 2020: D+6.5 2016: R+1.3 2012: D+1.1 2008: D+1.3
Not yet ingested
- Civics
- —
Market trends
- HPI YoY
- ▼ -252.24%
- Current HPI
- 309.2112
- Rent YoY
- —
- Metro
- Virginia Beach-Norfolk-Newport News, VA-NC
- State GDP YoY
- ▲ 2.40%
- F500 in state
- 50
Industry mix (Fortune 500 HQ in VA)
| Industry | F500 HQs | Revenue |
|---|---|---|
| Aerospace / Defense | 4 | $236B |
|
||
| Technology / Defense | 3 | $32B |
|
||
| Financial Services | 2 | $176B |
|
||
| Utilities | 2 | $27B |
|
||
| Insurance | 2 | $25B |
|
||
| Technology | 2 | $15B |
|
||
Price history
+287.8% since first listed22 events — show timeline
- 2026-05-11 Pending — REINMLS
- 2026-05-06 Contingent — REINMLS
- 2026-05-04 Relisted — REINMLS
- 2026-04-27 Contingent — REINMLS
- 2026-04-22 Listed $280,000 REINMLS
- 2022-10-03 Sold (Public Records) $239,000 Public Records
- 2022-09-09 Pending — REINMLS
- 2022-09-01 Contingent — REINMLS
- 2022-08-30 Listed $235,000 REINMLS
- 2017-05-01 Sold (Public Records) $158,000 Public Records
- 2017-03-20 Pending — REINMLS
- 2017-02-03 Listed $159,000 REINMLS
- 2017-01-13 Listing Removed — REINMLS
- 2016-09-26 Price Changed $159,000 REINMLS
- 2016-08-24 Price Changed $161,000 REINMLS
- 2016-08-24 Price Changed $159,900 REINMLS
- 2016-08-24 Listed $19,900 REINMLS
- 2011-11-21 Sold (Public Records) $141,000 Public Records
- 2011-09-27 Sold (Public Records) $70,000 Public Records
- 2002-11-19 Sold (Public Records) $80,000 Public Records
- 1999-02-01 Sold (Public Records) $73,900 Public Records
- 1995-10-31 Sold (Public Records) $72,200 Public Records
Property tax history
+4.9%/yrLatest (2025): $2,693 · +6.3% YoY. Source: county tax records.
Cash-flow waterfall
monthlySold comps — $/sqft
last 12 mo · ≤1 miLoading sold comps…