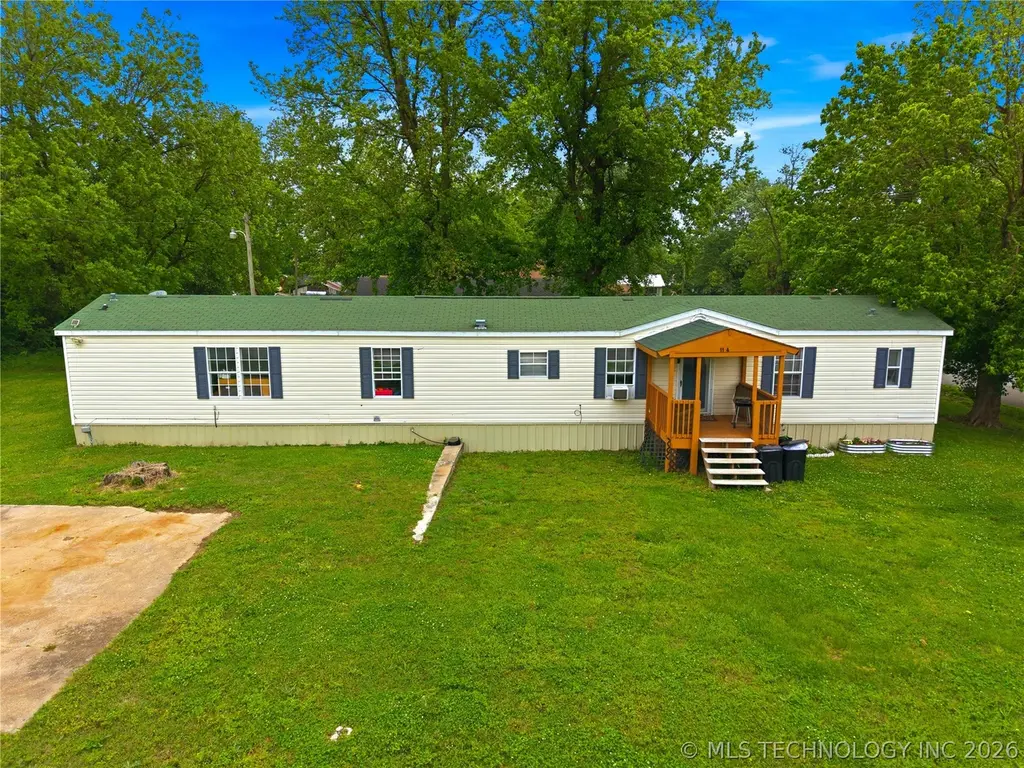
1184 S Lake St · Westville, OK
Flood risk No data
- FEMA flood zone
- —
- Chance of flooding over 30 yrs
- —
- Est. flood insurance / yr
- —
Fire risk No data
- Est. fire insurance / yr
- —
Heat risk No data
- Hot days now (above threshold)
- —
- Hot days in 30 yrs
- —
Wind risk No data
- Chance of severe wind over 30 yrs
- —
Air-quality risk No data
- Unhealthy air days now
- —
- Unhealthy air days in 30 yrs
- —
Risk factors via First Street. Map © Google.
Why this score? — see what drove the D- grade
The composite is a weighted blend of 9 inputs, each scored 0–100. Each bar is that input's sub-score; the figure is the points it added to the 100-point composite (weight × sub-score).
- Cash flow +10.6/30.0
- ARV discount +7.5/15.0
- Appreciation +6.2/10.0
- 1% rule +3.1/10.0
- DSCR +3.1/10.0
- Livability +2.8/5.0
- Rent growth +2.5/5.0
- Condition / age +2.2/5.0
- Schools +1.1/10.0
$130,000
🖨 Deal sheet (PDF) 📄 Offer letter ✓ Due diligence
Listing remarks
Charming and move-in ready! This mobile home offers 3 bedrooms, 2 bathrooms, and an inviting open-concept layout perfect for comfortable living and entertaining. Recently updated HVAC system and all-electric utilities provide efficiency and peace of mind. Situated on a desirable corner lot just 2 blocks from Westville Public Schools, this home is in a prime location with easy access to everything you need. Enjoy being within walking distance to local parks, a splash pad, and just minutes from dining and shopping. Westville is a growing community undergoing exciting revitalization, including new sidewalks, a brand new town square, and continued improvements that make this an increasingly des
Key facts
- Updated hvac system
- New sidewalks
- Corner lot
Tags
Property features AI
Exterior
- Security: No safety shelter
- Utilities: Electricity available; Public water; Public sewer
- Home design: Single-story home; Faces south; Tie down foundation
- Construction: Vinyl siding; Asphalt/fiberglass roof
- Exterior features: Covered porch; Corner lot
Interior
- Kitchen: Electric oven/range connection
- Flooring: Laminate flooring; Vinyl window features
- Bathrooms: 2 full bathrooms
- Heating & cooling: Central heating (electric); Central air conditioning
- Interior features: Ceiling fan(s); Laminate counters; Other interior features
- Laundry & utility: Washer hookup; Electric dryer hookup; Electric water heater
Neighborhood map
What this means for you Summary
Snapshot
- This is a 3-bed/2.0-bath manufactured listed at $130k. Condition is rated fair.
Deal economics
- At list price, monthly cash flow is $-63 ($-759/yr) — negative.
- To cash-flow at today's rent, offer at most $121k (7.0% below list).
- To meet the 1% rule (rent ≥ 1% of price), the offer needs to be $106k (18.7% below list).
- Recommended offer: $106k (18.7% below list) — sets the bar for 1% rule.
Location & tenants
- Location reads 56/100 on livability (#500 in OK) — a working-class tenant base; expect higher turnover. Strengths: cost of living A+, housing A+; Watch: crime F, amenities F, commute F.
- Westville (rural): math 10% / reading 16% proficiency, ranked #244 of 270 in OK (top 90%) — low school quality limits family demand, transient renter base, plan for 1-2y turnover; 69% free/reduced lunch — lower-income household profile, screen leases tightly.
- Zoned schools: Westville Es (math 12% / reading 16%, grade F, #640 of 845 statewide, top 76%, 493 students, 0% FRL); Westville Jhs (math 8% / reading 12%, grade F, #288 of 345 statewide, top 86%, 132 students, 0% FRL); Westville Hs (math 8% / reading 17%, grade F, #355 of 447 statewide, top 80%, 346 students, 0% FRL) — zoned schools average 0% FRL vs 69% district-wide (69 pts lower); this property's tenant base skews higher-income than the district average.
- Market conditions: 60 active listings in the ZIP; 30 units permitted in Adair County in 2024 (0 in 5+ unit buildings).
Forward outlook
- In year one you build about $4k of equity ($899 loan paydown + $3k appreciation (2.4% local appreciation)).
- Adair County population projected at -18% by 2050 — secular population decline; favor cash flow + early exit over multi-decade hold.
- At projected returns (2.4% appreciation + 3.0% rent growth), your $36k cash investment doubles in ~8 years — after that, you're playing with house money.
- By year 8, paydown + projected appreciation supports a ~$30k cash-out refi (75% LTV) — recoverable capital for the next deal without selling this one.
Negotiation context
- It's been on market 52 days — a 3% lower offer ($126k) is reasonable based on typical stale-listing flexibility.
Questions for the listing agent
- What do current leases actually rent for vs. the listed asking? Can we see a recent rent roll and the last 12 months of T-12 income?
- It's been on market 52 days. Have you received any prior offers? Is the seller open to a 19% concession, seller financing, or rate buy-down credit?
- Have any recent inspections been done? Can we get a copy of the seller's disclosures and any deferred-maintenance estimates?
- Is there a deadline driving the sale (1031 exchange, divorce, estate, relocation)? That informs how much negotiation room exists.
- Schools are F-rated, which usually means shorter tenancies and higher turnover. Who's the typical renter profile here, and what's been the actual vacancy rate?
- Crime grade is F in this area — have there been break-ins, vandalism, or insurance claims at this property in the last 3 years? What carrier currently insures it and at what premium?
- The area grade is low — what's the realistic commute time and amenity access for the typical tenant pool here? Any planned neighborhood developments (good or bad) we should know about?
- What's the average days-on-market for RENTAL listings here right now (not sales)? A rising rental-DOM trend means longer vacancies and softer asking-rent achievability than the comps imply.
- What's the recent tenant-quality profile in this submarket — average credit score on applications, eviction rate, late-payment / NSF rate, and stable-employment percentage? A property-management company in the area should have these aggregated.
- How much new for-sale + rental construction is in the pipeline within 1–3 miles? Heavy new supply typically softens prices + rents 12–24 months out; constrained supply supports both.
Investment metrics
- 1% rule
- 0.81% ✗
- Cap rate
- 5.71%
- Cash-on-cash
- -2.08%
- DSCR
- 0.91
- GRM
- 10.2
CMA / ARV
No comps found within radius.
Projected returns pro-forma
2.44% appreciation · 3.0% rent growth · sell at horizon
- IRR
- 3.9%
- Equity multiple
- 1.21×
- Total profit
- $7,809
- Equity at exit
- $54,369
- IRR
- 7.4%
- Equity multiple
- 2.05×
- Total profit
- $38,372
- Equity at exit
- $80,742
Cash invested: $36,400 (down + closing). Projections, not guarantees.
Landlord ↔ Tenant lean methodology
- Overall (STATE)
- 83 Strongly Landlord-Friendly
- State Oklahoma
- 83 Strongly Landlord-Friendly · R+20
- County
- — inherits STATE
- City
- — inherits STATE
ZIP-level market 74965
- Home prices YoY
- 0.8%
- Active inventory
- 60
- Price-to-rent
- 10.2×
Monthly cashflow live
- Estimated rent
- $1,057 medium interval (Pro) →
- Mortgage (P&I)
- −$682
- Tax est. 1.5%
- −$162 /mo · $1,950/yr
- Insurance
- −$54
- HOA
- −$0
- Vacancy / Maint / Mgmt
- −$222
- Net cashflow
- $-63
Break-even live
Sensitivity live
| Price | -10% $27 | -5% $-18 | +0% $-63 | +5% $-108 | +10% $-153 |
|---|---|---|---|---|---|
| Rent | -10% $-147 | -5% $-105 | +0% $-63 | +5% $-21 | +10% $20 |
| Rate | -1.0pp $2 | -0.5pp $-30 | base $-63 | +0.5pp $-97 | +1.0pp $-131 |
UW: 25.0% down · 7.5% · 30yr · 1.5% tax · 5.0% vac · 8.0% maint · 8.0% mgmt
Financing live
Cash to close
- Down payment
- $32,500
- Closing costs
- $3,900
- Reserves months
- —
- Total cash needed
- —
Loan-product check · same deal, 3 products live
Conventional
25% down · 7.5% · 30yr
- Down + closing
- —
- Monthly P&I
- —
- Monthly cashflow
- —
- DSCR
- —
- Eligible?
- —
Personal DTI + credit; lowest rate.
DSCR
20% down · 8.5% · 30yr
- Down + closing
- —
- Monthly P&I
- —
- Monthly cashflow
- —
- DSCR
- —
- Eligible?
- —
No personal income docs; deal must DSCR.
Hard money
10% down · 12.0% · 12mo
- Down + closing
- —
- Monthly P&I
- —
- Monthly cashflow
- —
- DSCR
- —
- Eligible?
- —
Short-term bridge; refi at stabilization.
Listing history 17 events
-
2026-06-21days on market $130,000 Active 52 DOM
-
2026-06-19days on market $130,000 Active 50 DOM
-
2026-06-18days on market $130,000 Active 49 DOM
-
2026-06-17days on market $130,000 Active 48 DOM
-
2026-06-16days on market $130,000 Active 47 DOM
-
2026-06-16price $130,000 Active 46 DOM
-
2026-06-15days on market $150,000 Active 46 DOM
-
2026-06-14days on market $150,000 Active 44 DOM
-
2026-06-12days on market $150,000 Active 43 DOM
-
2026-06-09days on market $150,000 Active 40 DOM
-
2026-06-08days on market $150,000 Active 39 DOM
-
2026-06-07days on market $150,000 Active 38 DOM
-
2026-06-02days on market $150,000 Active 33 DOM
-
2026-06-01days on market $150,000 Active 32 DOM
-
2026-05-31days on market $150,000 Active 31 DOM
-
2026-05-30days on market $150,000 Active 30 DOM
-
2026-04-30$150,000 Active
ⓘ Source: listings_history table (triggers on properties + properties_extension) + one-shot
backfill from property_details.listing_events for pre-trigger history.
Nearby sold comps map
Loading sold comps map…
Walkable amenities ~0.75 mi
Loading nearby amenities…
Taxation est. · year 1
- Rental income
- $12,686
- − Mortgage interest
- −$7,282
- − Property taxes
- −$1,950
- − Insurance
- −$650
- − Repairs & maintenance
- −$1,015
- − Management
- −$1,015
- − Depreciation
- −$3,782
- Taxable loss
- −$3,008
- Est. tax savings @ 24.0%
- +$722
- After-tax cash flow
- $-37/yr
For passive investors: Depreciation is non-cash, so a rental often shows a tax loss while cash-flowing — sheltering income. Rental losses are passive: they offset passive income freely, and up to $25,000/yr can offset ordinary (W-2) income if you actively participate and your MAGI is under $100k (phasing out to $0 by $150k); unused losses carry forward. On sale, claimed depreciation is recaptured at up to 25%, and gains may owe capital-gains tax (a 1031 exchange can defer both). Figures are a year-1 estimate at your 24.0% rate — not tax advice; consult a CPA.
Condition & rehab AI · 13 photos
This mobile home is move-in ready with recent updates, but minor repairs and maintenance are needed to enhance its curb appeal and value.
Repairs flagged
- Minor wooden deck — slight wear
- Minor carpeted floors — slight wear
Value-add opportunities
- Both paint exterior siding — enhances curb appeal and value
- Both replace shower curtain — improves aesthetics and functionality
Renovation cost estimate screening
| Repair item | Severity | Est. cost |
|---|---|---|
| wooden deck · slight wear | Minor | $500–3,000 |
| carpeted floors · slight wear | Minor | $500–3,000 |
| Total estimated repair cost · 2 items | $1,000–6,000 |
Value-add ROI direction
- Both paint exterior siding — enhances curb appeal and value ↑
- Both replace shower curtain — improves aesthetics and functionality ↑
ⓘ Cost ranges are severity-bucket heuristics (US national rule-of-thumb). Get contractor quotes + a written scope before underwriting a rehab budget.
Schools (NCES district)
- District
- Westville
- NCES district ID
- 4032400
- Math proficiency
- 10% ▼ -17.00%
- Reading proficiency
- 16% ▼ -11.00%
- Median HH income
- $35,223
- Composite
- 10.68/100
- National rank
- #9771
- State rank
- #244 of 270 in OK
Livability — Westville
- Score
- 56/100
- State rank
- #500
- US rank
- #22420
Category grades
Schools grade is shown separately in the Schools card above.
Census & demographics
- Census place
- Westville, OK
- Population (ZIP)
- 4,964
Population outlook (Adair County) Hauer SSP2
- Today (2025)
- 20,805 people
- By 2030
- 20,073 · -3.5%
- By 2040
- 18,496 · -11.1%
- By 2050
- 16,970 · -18.4%
- By 2075
- 14,011 · -32.7%
- By 2100
- 12,211 · -41.3%
Race, ethnicity, and origin ACS 2023
- Neighborhood character
- Highly diverse neighborhood (Simpson 0.71)
- Race & ethnicity
- White 53% Native American 27% Two or more races 10% Hispanic / Latino 8% Asian 2%
- Hispanic origin (detail)
- Mexican 8%
- Common ancestry
- Portuguese 1% European 1% Lithuanian 1%
- Foreign-born
- 2% · Canada
- Languages at home
- 96% English-only · Spanish 2% Other Asian/Pacific 1%
Political lean MEDSL · Adair
- 2024 margin
- Solid R (+63.0) · D 17.8% · R 80.8% · Other 1.5%
- 2008→2024 swing
- -24.3pp toward R · 2008: -38.7pp · 2024: -63.0pp
- All cycles
- 2024: R+63.0 2020: R+59.1 2016: R+52.2 2012: R+34.8 2008: R+38.7
Not yet ingested
- Civics
- —
Market trends
- HPI YoY
- ▲ 2.44%
- Current HPI
- 317.0133
- Rent YoY
- —
- Metro
- —
- State GDP YoY
- ▲ 1.55%
- F500 in state
- 6
Industry mix (Fortune 500 HQ in OK)
| Industry | F500 HQs | Revenue |
|---|---|---|
| Energy | 3 | $48B |
|
||
Price history
1 event — show timeline
- 2026-04-30 Listed $150,000 MLS Technology, Inc.
Cash-flow waterfall
monthlySold comps — $/sqft
last 12 mo · ≤1 miLoading sold comps…