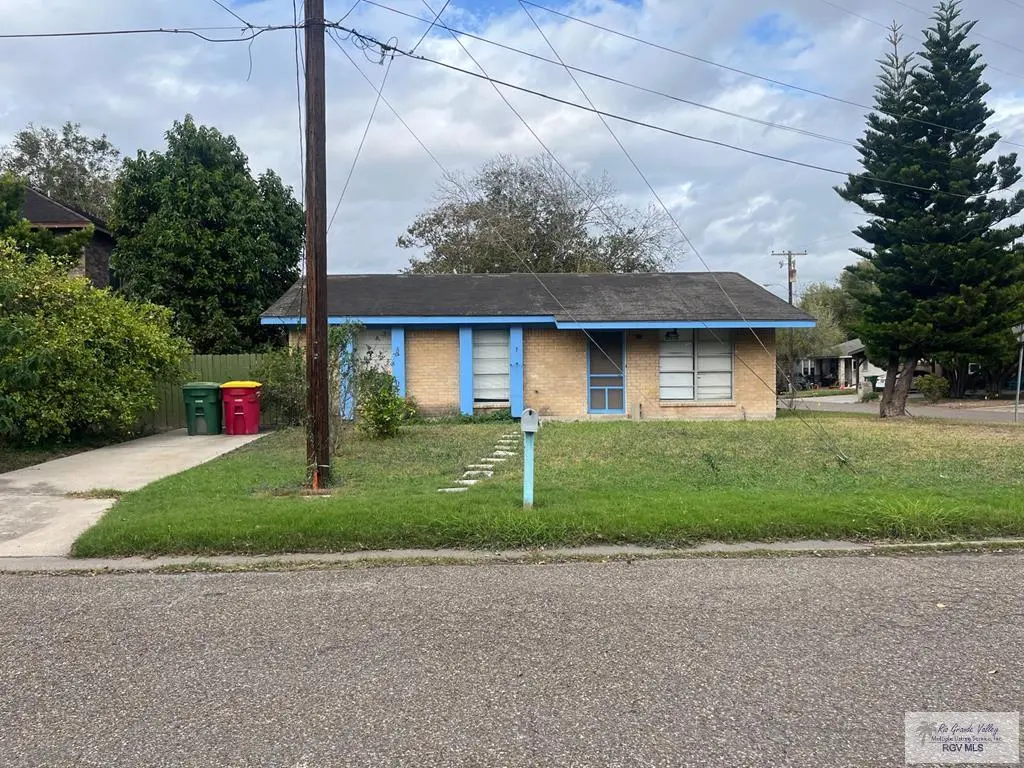
4 Calle Princesa · Brownsville, TX
Flood risk 1/10 · Minimal
- FEMA flood zone
- X (unshaded)
- Chance of flooding over 30 yrs
- 0.0%
- Est. flood insurance / yr
- $507 – $1,088
Fire risk 1/10 · Minimal
- Est. fire insurance / yr
- $1,222 – $2,270
Heat risk 9/10 · Severe
- Hot days now (above 111°F)
- 7 days/yr
- Hot days in 30 yrs
- 23 days/yr
Wind risk 9/10 · Severe
- Chance of severe wind over 30 yrs
- 99.0%
Air-quality risk 3/10 · Minor
- Unhealthy air days now
- 2 days/yr
- Unhealthy air days in 30 yrs
- 3 days/yr
Risk factors via First Street. Map © Google.
Why this score? — see what drove the C- grade
The composite is a weighted blend of 9 inputs, each scored 0–100. Each bar is that input's sub-score; the figure is the points it added to the 100-point composite (weight × sub-score).
- Cash flow +25.3/30.0
- DSCR +8.3/10.0
- 1% rule +6.0/10.0
- Rent growth +5.0/5.0
- Livability +4.0/5.0
- Condition / age +2.5/5.0
- Schools +2.2/10.0
- ARV discount +0.0/15.0
- Appreciation +0.0/10.0
$150,000
🖨 Deal sheet 📄 Offer letter ✓ Due diligence
Listing remarks MLS
Conveniently located starter home on a spacious corner lot. This 3 bedroom 1 bath house needs a little TLC to make a perfect home for a small family.
Key facts
- Corner lot
- 7,223 sq ft lot
- Built 1991
Tags
Neighborhood map
What this means for you Summary
Snapshot
- This is a 3-bed/1.0-bath single-family listed at $150k.
Deal economics
- At list price, monthly cash flow is $341 ($4k/yr) — positive.
- The deal already cash-flows at list — no discount required.
- Meets the 1% rule at list price ($2k rent vs $150k).
- Recommended offer: $132k (12.0% below list) — sets the bar for market timing.
- Cap rate 9.0% vs local median 5.0% in Brownsville — top-decile yield for the area; either an underpriced asset or a hidden risk that comps aren't pricing in. Stress-test before assuming the spread holds.
Location & tenants
- Location reads 79/100 on livability (#62 in TX, #2,311 nationally) — a middle-class / working-renter tenant base. Strengths: commute A+, cost of living A+, housing A+; Watch: schools C-, amenities D, crime D-.
- Brownsville ISD (urban): math 20% / reading 34% proficiency, ranked #710 of 826 in TX (top 86%) — low school quality limits family demand, transient renter base, plan for 1-2y turnover; 83% free/reduced lunch — lower-income household profile, screen leases tightly.
- Market conditions: Rents rising fast (+11.4%/yr); 346 active listings in the ZIP; 30 comparable units currently listed for rent nearby; rentals at typical pace (median 21d on market — plan ~3-4 weeks tenant-placement turnaround); 47% of comp listings sitting > 30 days — soft ceiling on asking rent; 2,326 units permitted in Cameron County in 2024 (503 in 5+ unit buildings).
- This rent runs 39% of the median local income ($50k/yr) — at the standard rent-burdened threshold; future hikes will face affordability resistance.
Forward outlook
- Local home prices are declining (-3.0%/yr); year-one equity from $1k of loan paydown is wiped out by about $4k of value loss. Plan a longer hold.
- Cameron County population projected at +3% by 2050 — modest demand growth; plan on rents tracking national, not racing it.
- At projected returns (-3.0% appreciation + 8.0% rent growth), your $42k cash investment doubles in ~8 years — after that, you're playing with house money.
Negotiation context
- It's been on market 139 days — a 12% lower offer ($132k) is reasonable based on typical stale-listing flexibility.
Risks & watch-outs
- Climate carrying-cost: severe wind risk, 99% chance of damaging wind over 30y; extreme-heat days projected 7→23/yr by 2055 (HVAC capex compounding) — expect insurance premiums to compound above CPI over the hold.
Questions for the listing agent
- It's been on market 139 days. Have you received any prior offers? Is the seller open to a 12% concession, seller financing, or rate buy-down credit?
- Why hasn't it sold? Are there any deal-killer items the seller is aware of (foundation, flood, title, zoning, code violations)?
- Is there a deadline driving the sale (1031 exchange, divorce, estate, relocation)? That informs how much negotiation room exists.
- Crime grade is D in this area — have there been break-ins, vandalism, or insurance claims at this property in the last 3 years? What carrier currently insures it and at what premium?
- What's the average days-on-market for RENTAL listings here right now (not sales)? A rising rental-DOM trend means longer vacancies and softer asking-rent achievability than the comps imply.
- What's the recent tenant-quality profile in this submarket — average credit score on applications, eviction rate, late-payment / NSF rate, and stable-employment percentage? A property-management company in the area should have these aggregated.
- How much new for-sale + rental construction is in the pipeline within 1–3 miles? Heavy new supply typically softens prices + rents 12–24 months out; constrained supply supports both.
Investment metrics
- 1% rule
- 1.10% ✓
- Cap rate
- 9.02%
- Cash-on-cash
- 9.75%
- DSCR
- 1.43
- GRM
- 7.6
CMA / ARV
- ARV (median comp)
- $125,945
- List price
- $150,000
- Delta
- 19.10%
- Verdict
- OVERPRICED
- Comps
- 6 within 1.0 mi
Show comp detail 1 sale within ~0.75 mi
| Address | Dist | Beds/Ba | Sqft | Sold | Price | $/sf | Match |
|---|---|---|---|---|---|---|---|
| 124 Calle Princesa St | 0.09mi | 3/2.0 | 1,125 (+10%) | 20mo | $125,000 | $111 | 59 |
Match score weights: distance 35% · size 25% · config 20% · recency 20%. Top-matched comps best support the ARV.
Projected returns pro-forma
-3.0% appreciation · 8.0% rent growth · sell at horizon
- IRR
- 3.6%
- Equity multiple
- 1.15×
- Total profit
- $6,093
- Equity at exit
- $22,365
- IRR
- 17.2%
- Equity multiple
- 2.73×
- Total profit
- $72,775
- Equity at exit
- $12,969
Cash invested: $42,000 (down + closing). Projections, not guarantees.
Landlord ↔ Tenant lean methodology
- Overall (STATE)
- 87 Strongly Landlord-Friendly
- State Texas
- 87 Strongly Landlord-Friendly · R+5
- County
- — inherits STATE
- City
- — inherits STATE
ZIP-level market 78520
- Home prices YoY
- -19.8%
- Rents YoY
- 11.4%
- Active inventory
- 346
- Price-to-rent
- 7.6×
Monthly cashflow live
- Estimated rent
- $1,646 high interval (Pro) →
- Mortgage (P&I)
- −$787
- Tax from tax record
- −$110 /mo · $1,321/yr
- Insurance
- −$62
- HOA
- −$0
- Vacancy / Maint / Mgmt
- −$346
- Net cashflow
- $341
Break-even live
UW: 25.0% down · 7.5% · 30yr · 1.5% tax · 5.0% vac · 8.0% maint · 8.0% mgmt
Financing live
Cash to close
- Down payment
- $37,500
- Closing costs
- $4,500
- Reserves months
- —
- Total cash needed
- —
Loan-product check · same deal, 3 products live
Conventional
25% down · 7.5% · 30yr
- Down + closing
- —
- Monthly P&I
- —
- Monthly cashflow
- —
- DSCR
- —
- Eligible?
- —
Personal DTI + credit; lowest rate.
DSCR
20% down · 8.5% · 30yr
- Down + closing
- —
- Monthly P&I
- —
- Monthly cashflow
- —
- DSCR
- —
- Eligible?
- —
No personal income docs; deal must DSCR.
Hard money
10% down · 12.0% · 12mo
- Down + closing
- —
- Monthly P&I
- —
- Monthly cashflow
- —
- DSCR
- —
- Eligible?
- —
Short-term bridge; refi at stabilization.
Rent comps 30 comps
| Address | Beds | Baths | Sqft | Rent | $/sqft | DOM | Units | Dist |
|---|---|---|---|---|---|---|---|---|
| 34 W Hawthorne Ave Brownsville, TX | 3.0 | 2.0 | 940 | $1,400 | $1.49 | 43d | 1 | 0.31mi |
| 234 Emerald Ln Lot 4 Brownsville, TX | 3.0 | 2.0 | 1170 | $1,850 | $1.58 | 21d | 1 | 0.31mi |
| 234 Emerald Ln Lot 4 Brownsville, TX | 4.0 | 2.0 | 1170 | $1,850 | $1.58 | 13d | 1 | 0.31mi |
| 15 Sunnyside Ln Brownsville, TX | 4.0 | 2.0 | 1436 | $2,000 | $1.39 | 13d | 1 | 0.49mi |
| 401 Boca Chica Blvd Unit 505 Brownsville, TX | 2.0 | 1.5 | 1152 | $1,200 | $1.04 | 43d | 1 | 0.49mi |
| 158 Garden St Brownsville, TX | 2.0 | 1.0 | 868 | $900 | $1.04 | 43d | 1 | 0.58mi |
| 3055 El Paso Rd Unit H-1 Brownsville, TX | 2.0 | 2.0 | 900 | $1,050 | $1.17 | 43d | 1 | 0.69mi |
| 1904 Central Blvd Brownsville, TX | 1.0–3.0 | 1.0–2.0 | 1046 | $1,035 | $0.99 | 43d | 9 | 0.70mi |
| 600 Lakeside Blvd Brownsville, TX | 1.0–2.0 | 1.0–2.0 | 763 | $950 | $1.25 | 13d | 2 | 0.78mi |
| 42 Fairway Dr Brownsville, TX | 2.0 | 2.0 | 1300 | $2,500 | $1.92 | 21d | 1 | 0.89mi |
| 11 Country Club Rd Brownsville, TX | 2.0 | 2.0 | 1200 | $1,600 | $1.33 | 21d | 1 | 0.94mi |
| 10 Country Club Rd Unit A Brownsville, TX | 2.0 | 2.0 | 1200 | $1,450 | $1.21 | 43d | 1 | 0.95mi |
| 2901 Central Blvd Unit 202 Brownsville, TX | 2.0 | 2.0 | 1176 | $1,400 | $1.19 | 21d | 1 | 0.98mi |
| 402 Champions Dr Brownsville, TX | 2.0 | 1.5 | 814 | $1,300 | $1.60 | 21d | 1 | 1.00mi |
| 2100 Laredo Rd Brownsville, TX | 1.0–2.0 | 1.0–2.0 | 976 | $1,540 | $1.58 | 13d | 6 | 1.02mi |
| 1234 W Levee St Brownsville, TX | 2.0 | 1.0 | 1281 | $1,500 | $1.17 | 21d | 1 | 1.04mi |
| 2425 Barnard Rd Unit A-13 Brownsville, TX | 2.0 | 2.0 | 1137 | $1,250 | $1.10 | 43d | 1 | 1.11mi |
| 2425 Barnard Rd Unit ujnit 1-A Brownsville, TX | 3.0 | 1.5 | 1300 | $1,600 | $1.23 | 43d | 1 | 1.11mi |
| 2425 Barnard Rd Brownsville, TX | 1.0–2.0 | 1.0–2.0 | 886 | $1,165 | $1.31 | 13d | 12 | 1.11mi |
| 801 Tropical Dr Unit 3 Brownsville, TX | 2.0 | 1.5 | 1000 | $1,500 | $1.50 | 43d | 1 | 1.17mi |
| 1405 Harvard Ave Brownsville, TX | 3.0 | 2.0 | 1426 | $1,700 | $1.19 | 43d | 1 | 1.23mi |
| 714 Continental Dr #3 Brownsville, TX | 3.0 | 2.5 | 1482 | $2,400 | $1.62 | 43d | 1 | 1.24mi |
| 142 Country Club Rd Brownsville, TX | 3.0 | 2.5 | 1460 | $1,800 | $1.23 | 43d | 1 | 1.25mi |
| 1150 Quail Hollow Dr Brownsville, TX | 3.0 | 2.5 | 1333 | $1,950 | $1.46 | 21d | 1 | 1.34mi |
| 35 Cenizo Brownsville, TX | 2.0 | 3.5 | 1404 | $2,500 | $1.78 | 43d | 1 | 1.37mi |
| 2393 McAllen Rd Unit D1-7 Brownsville, TX | 2.0 | 1.5 | 1040 | $1,400 | $1.35 | 21d | 1 | 1.41mi |
| 1604 Yale Ave Brownsville, TX | 3.0 | 1.0 | 1316 | $1,800 | $1.37 | 21d | 1 | 1.41mi |
| 1618 E Los Ebanos Blvd Brownsville, TX | 3.0 | 2.0 | 1073 | $1,700 | $1.58 | 43d | 1 | 1.45mi |
| 1617 E Los Ebanos Blvd Brownsville, TX | 3.0 | 2.0 | 1179 | $1,900 | $1.61 | 21d | 1 | 1.45mi |
| 375 Media Luna Rd Brownsville, TX | 1.0–3.0 | 1.0–2.0 | 940 | $1,404 | $1.49 | 13d | 2 | 1.50mi |
Listing history 4 events
-
2026-05-11status Pending 151-char remark
Show marketing remark (151 chars)
Conveniently located starter home on a spacious corner lot. This 3 bedroom 1 bath house needs a little TLC to make a perfect home for a small family.
-
2026-02-13price $150,000 151-char remark
Show marketing remark (151 chars)
Conveniently located starter home on a spacious corner lot. This 3 bedroom 1 bath house needs a little TLC to make a perfect home for a small family.
-
2025-12-15$164,500 Active 151-char remark
Show marketing remark (151 chars)
Conveniently located starter home on a spacious corner lot. This 3 bedroom 1 bath house needs a little TLC to make a perfect home for a small family.
-
2024-06-18soldstatus
ⓘ Source: listings_history table (triggers on properties + properties_extension) + one-shot
backfill from property_details.listing_events for pre-trigger history.
Tax reassessment forecast TX · Resets to sale price
- Current annual tax
- $1,321 · $110/mo
- Projected year-2 tax
- $2,745 · $229/mo
- Expected delta
- +$1,424/yr (+$119/mo · 107.8%)
ⓘ Screening estimate from a state-policy table — verify with the county assessor before closing.
Climate risk First Street
- Flood 1/10 Low FEMA zone X (unshaded) · 0% chance over 30 yrs
- Wildfire 1/10 Low
- Heat 9/10 Extreme 7 d/yr ≥111°F today · 23 d/yr by 30 yrs out
- Wind 9/10 Extreme 99% chance of damaging wind over 30 yrs
- Air quality 3/10 Moderate 2 unhealthy d/yr today · 3 by 30 yrs out
Nearby sold comps map
Loading sold comps map…
Walkable amenities ~0.75 mi
Loading nearby amenities…
Taxation est. · year 1
- Rental income
- $19,751
- − Mortgage interest
- −$8,402
- − Property taxes
- −$1,321
- − Insurance
- −$750
- − Repairs & maintenance
- −$1,580
- − Management
- −$1,580
- − Depreciation
- −$4,364
- Taxable income
- $1,754
- Est. tax owed @ 24.0%
- −$421
- After-tax cash flow
- $3,672/yr
For passive investors: Depreciation is non-cash, so a rental often shows a tax loss while cash-flowing — sheltering income. Rental losses are passive: they offset passive income freely, and up to $25,000/yr can offset ordinary (W-2) income if you actively participate and your MAGI is under $100k (phasing out to $0 by $150k); unused losses carry forward. On sale, claimed depreciation is recaptured at up to 25%, and gains may owe capital-gains tax (a 1031 exchange can defer both). Figures are a year-1 estimate at your 24.0% rate — not tax advice; consult a CPA.
Schools (NCES district)
- District
- Brownsville ISD
- NCES district ID
- 4811680
- Math proficiency
- 20% ▼ -36.00%
- Reading proficiency
- 34% ▼ -13.00%
- Median HH income
- $30,490
- Composite
- 21.8/100
- National rank
- #8249
- State rank
- #710 of 826 in TX
Livability — Brownsville
- Score
- 79/100
- State rank
- #62
- US rank
- #2311
Category grades
Schools grade is shown separately in the Schools card above.
Census & demographics
- Census place
- Brownsville, TX
- County
- Cameron County · 310,734 people
- City population
- 212,132
- Metro
- Brownsville-Harlingen, TX
- Population (ZIP)
- 64,740
- Household income
- $50,116
- Rent vs Own
- Severe rent burden
- 1800.0
Population outlook (Cameron County) Hauer SSP2
- Today (2025)
- 441,603 people
- By 2030
- 448,113 · +1.5%
- By 2040
- 456,385 · +3.3%
- By 2050
- 456,294 · +3.3%
- By 2075
- 423,851 · -4.0%
- By 2100
- 342,787 · -22.4%
Race, ethnicity, and origin ACS 2023
- Neighborhood character
- Predominantly Hispanic (93%)
- Race & ethnicity
- Hispanic / Latino 93% Two or more races 44% White 6%
- Hispanic origin (detail)
- Mexican 88%
- Foreign-born
- 26% · Canada
- Languages at home
- 18% English-only · Spanish 82%
Political lean MEDSL · Cameron
- 2024 margin
- Lean R (+5.8) · D 46.7% · R 52.5%
- 2008→2024 swing
- -34.6pp toward R · 2008: 28.8pp · 2024: -5.8pp
- All cycles
- 2024: R+5.8 2020: D+13.2 2016: D+32.5 2012: D+32.4 2008: D+28.8
Not yet ingested
- Civics
- —
Market trends
- HPI YoY
- ▼ -52.91%
- Current HPI
- 214.4335
- Rent YoY
- ▲ 11.41%
- Metro
- Brownsville-Harlingen, TX
- State GDP YoY
- ▲ 3.95%
- F500 in state
- 110
Industry mix (Fortune 500 HQ in TX)
| Industry | F500 HQs | Revenue |
|---|---|---|
| Energy | 16 | $1,198B |
|
||
| Technology | 5 | $198B |
|
||
| Engineering / Construction | 4 | $72B |
|
||
| Energy Services | 3 | $60B |
|
||
| Utilities | 3 | $41B |
|
||
| Healthcare | 2 | $330B |
|
||
Price history
-8.8% since first listed4 events — show timeline
- 2026-05-11 Pending — RGVMLS
- 2026-02-13 Price Changed $150,000 RGVMLS
- 2025-12-15 Listed $164,500 RGVMLS
- 2024-06-18 Sold (Public Records) — Public Records
Property tax history
+1.7%/yrLatest (2025): $1,321 · +0.1% YoY. Source: county tax records.
Cash-flow waterfall
monthlySold comps — $/sqft
last 12 mo · ≤1 miLoading sold comps…