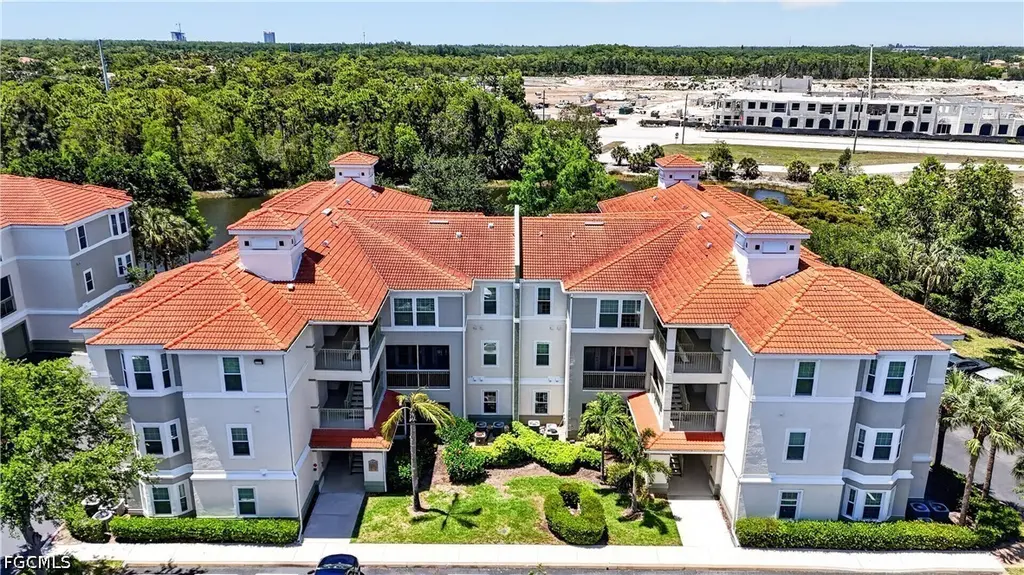
23560 Walden Center Dr #308 · Estero, FL
Flood risk 3/10 · Minor
- FEMA flood zone
- X (unshaded)
- Chance of flooding over 30 yrs
- 0.13%
- Est. flood insurance / yr
- $507 – $1,088
Fire risk 3/10 · Minor
- Est. fire insurance / yr
- $947 – $1,759
Heat risk 10/10 · Severe
- Hot days now (above 107°F)
- 7 days/yr
- Hot days in 30 yrs
- 31 days/yr
Wind risk 10/10 · Severe
- Chance of severe wind over 30 yrs
- 99.0%
Air-quality risk 3/10 · Minor
- Unhealthy air days now
- 2 days/yr
- Unhealthy air days in 30 yrs
- 2 days/yr
Risk factors via First Street. Map © Google.
Why this score? — see what drove the D- grade
The composite is a weighted blend of 9 inputs, each scored 0–100. Each bar is that input's sub-score; the figure is the points it added to the 100-point composite (weight × sub-score).
- Cash flow +10.0/30.0
- ARV discount +7.5/15.0
- 1% rule +4.4/10.0
- Schools +4.1/10.0
- Livability +4.0/5.0
- Rent growth +3.2/5.0
- DSCR +2.9/10.0
- Condition / age +2.5/5.0
- Appreciation +0.0/10.0
$274,900
🖨 Deal sheet (PDF) 📄 Offer letter ✓ Due diligence
Listing remarks
Turn key furnished condo previously used as a successful income producing rental property, offering an excellent investment opportunity, seasonal retreat, or full time residence in the heart of Estero, Florida. Ideally located just 12 minutes from Florida Gulf Coast University, directly across the street from Coconut Point, and only 18 minutes to Naples. This well maintained unit features a bright kitchen with white cabinetry, stainless steel appliances, smooth-top stove, side-by-side refrigerator, built in pantry, and upgraded lighting. The spacious primary suite includes a walk-in closet, upgraded vanity, tile shower/tub combo, ceiling fan, and neutral finishes throughout. Additional high
Key facts
- Bright kitchen
- Turn key furnished
- Smooth-top stove
Tags
Property features AI
Finance
- Financial info: Pets allowed: conditional (call for details)
- HOA & community: Homeowners association with quarterly fee; Association fee includes management, grounds maintenance, pest control, reserve fund, road maintenance and street lights; Community amenities: clubhouse, pool, basketball court, pickleball, barbecue and picnic area, on-site management; Condo-hotel community in a gated community, near hotel/motel
Exterior
- Security: Fire sprinkler system; Smoke detectors
- Utilities: Public water; Public sewer
- Home design: 3 total stories; Entry level 3; Resale property
- Construction: Block, concrete and stucco construction; Tile roof
- Exterior features: Community pool; Pond on lot; Rectangular lot; Zero lot line; Paved road; East exposures; Has view; Faces west; Waterfront on lake
Interior
- Kitchen: Range; Refrigerator; Dishwasher
- Bedrooms: Entry level: 3
- Flooring: Carpet; Tile
- Bathrooms: 2 full bathrooms
- Heating & cooling: Central heating (electric); Central air; Ceiling fans; Electric cooling
- Interior features: Built-in features; Breakfast area; Tub with shower; Cable TV; Walk-in closet(s); High-speed internet; Split bedrooms; Single hung windows; Impact glass windows; Furnished
- Laundry & utility: Washer; Dryer (inside)
Neighborhood map
What this means for you Summary
Snapshot
- This is a 2-bed/2.0-bath condo listed at $275k.
Deal economics
- At list price, monthly cash flow is $-164 ($-2k/yr) — negative.
- To cash-flow at today's rent, offer at most $246k (10.6% below list).
- To meet the 1% rule (rent ≥ 1% of price), the offer needs to be $258k (6.1% below list).
- Recommended offer: $246k (10.6% below list) — sets the bar for cash-flow.
- Cap rate 5.6% vs local median 3.4% in Estero — top-decile yield for the area; either an underpriced asset or a hidden risk that comps aren't pricing in. Stress-test before assuming the spread holds.
Location & tenants
- Location reads 79/100 on livability (#149 in FL, #2,242 nationally) — a middle-class / working-renter tenant base. Strengths: crime A+, employment A+, housing A+; Watch: amenities F, commute F, cost of living D-.
- Lee (suburban): math 47% / reading 50% proficiency, ranked #42 of 73 in FL (top 58%) — families likely to look elsewhere, expect single-tenant / working-renter base with shorter leases.
- Zoned schools: Pinewoods Elementary School (math 81% / reading 74%, grade A, #163 of 2,144 statewide, top 8%, 1,089 students, 25% FRL); Lexington Middle School (math 55% / reading 54%, grade B-, #183 of 571 statewide, top 34%, 1,138 students, 44% FRL); South Fort Myers High School (math 23% / reading 30%, grade F, #489 of 667 statewide, top 74%, 1,917 students, 50% FRL) — zoned schools average 39% FRL vs 57% district-wide (18 pts lower); this property's tenant base skews higher-income than the district average.
- Market conditions: Rents rising (+2.9%/yr); 699 active listings in the ZIP; 40 comparable units currently listed for rent nearby; rentals at typical pace (median 26d on market — plan ~3-4 weeks tenant-placement turnaround); high-income renter base; 15,411 units permitted in Lee County in 2024 (4,686 in 5+ unit buildings).
Forward outlook
- Local home prices are declining (-3.0%/yr); year-one equity from $2k of loan paydown is wiped out by about $8k of value loss. Plan a longer hold.
- Lee County population projected at +44% by 2050 — long-run rental-demand tailwind backs the buy-and-hold thesis.
Negotiation context
- It's been on market 34 days — a 3% lower offer ($267k) is reasonable based on typical stale-listing flexibility.
- 5 sale attempts since 9y ago with the ask held roughly flat each time — persistent listings suggest the price (not the market) is what's stuck; bring a comps-based counter.
- Current owner paid $150k; list at $275k implies a 83% gain — meaningful room to come down on a strong offer.
Risks & watch-outs
- Climate carrying-cost: severe wind risk, 99% chance of damaging wind over 30y; extreme-heat days projected 7→31/yr by 2055 (HVAC capex compounding) — expect insurance premiums to compound above CPI over the hold.
Questions for the listing agent
- What do current leases actually rent for vs. the listed asking? Can we see a recent rent roll and the last 12 months of T-12 income?
- It's been on market 34 days. Have you received any prior offers? Is the seller open to a 11% concession, seller financing, or rate buy-down credit?
- What does the HOA fee cover, when was the last increase, and are there any pending special assessments or reserve-fund shortfalls?
- Any open or pending special assessments — roof, HVAC, plumbing, elevator, façade? What's the per-unit balance and payoff schedule, and is the seller paying it off at close or rolling it to the buyer?
- Is there a deadline driving the sale (1031 exchange, divorce, estate, relocation)? That informs how much negotiation room exists.
- Schools are A-rated — typically a magnet for longer-tenancy family renters. What's the average tenant stay here, and is there a school-zone premium baked into asking?
- The area grade is low — what's the realistic commute time and amenity access for the typical tenant pool here? Any planned neighborhood developments (good or bad) we should know about?
- What's the average days-on-market for RENTAL listings here right now (not sales)? A rising rental-DOM trend means longer vacancies and softer asking-rent achievability than the comps imply.
- What's the recent tenant-quality profile in this submarket — average credit score on applications, eviction rate, late-payment / NSF rate, and stable-employment percentage? A property-management company in the area should have these aggregated.
- How much new apartment / multifamily construction is in the pipeline within 1–3 miles? Heavy new supply (>2% of stock underway) typically softens rents 12–24 months out; light construction supports rent growth.
Investment metrics
- 1% rule
- 0.94% ✗
- Cap rate
- 5.58%
- Cash-on-cash
- -2.56%
- DSCR
- 0.89
- GRM
- 8.9
CMA / ARV
No comps found within radius.
Projected returns pro-forma
-3.0% appreciation · 2.85% rent growth · sell at horizon
- IRR
- -20.6%
- Equity multiple
- 0.28×
- Total profit
- $-55,178
- Equity at exit
- $40,988
- IRR
- -14.1%
- Equity multiple
- 0.19×
- Total profit
- $-62,205
- Equity at exit
- $23,768
Cash invested: $76,972 (down + closing). Projections, not guarantees.
Landlord ↔ Tenant lean methodology
- Overall (STATE)
- 87 Strongly Landlord-Friendly
- State Florida
- 87 Strongly Landlord-Friendly · R+3
- County
- — inherits STATE
- City
- — inherits STATE
ZIP-level market 34134
- Rents YoY
- 2.9%
- Active inventory
- 699
- Price-to-rent
- 8.9×
Monthly cashflow live
- Estimated rent
- $2,580 high interval (Pro) →
- Mortgage (P&I)
- −$1,442
- Tax from tax record
- −$209 /mo · $2,503/yr
- Insurance
- −$115
- HOA
- −$438
- Vacancy / Maint / Mgmt
- −$542
- Net cashflow
- $-164
Break-even live
Sensitivity live
| Price | -10% $-9 | -5% $-87 | +0% $-164 | +5% $-242 | +10% $-320 |
|---|---|---|---|---|---|
| Rent | -10% $-368 | -5% $-266 | +0% $-164 | +5% $-62 | +10% $39 |
| Rate | -1.0pp $-26 | -0.5pp $-94 | base $-164 | +0.5pp $-236 | +1.0pp $-308 |
UW: 25.0% down · 7.5% · 30yr · 1.5% tax · 5.0% vac · 8.0% maint · 8.0% mgmt
Financing live
Cash to close
- Down payment
- $68,725
- Closing costs
- $8,247
- Reserves months
- —
- Total cash needed
- —
Loan-product check · same deal, 3 products live
Conventional
25% down · 7.5% · 30yr
- Down + closing
- —
- Monthly P&I
- —
- Monthly cashflow
- —
- DSCR
- —
- Eligible?
- —
Personal DTI + credit; lowest rate.
DSCR
20% down · 8.5% · 30yr
- Down + closing
- —
- Monthly P&I
- —
- Monthly cashflow
- —
- DSCR
- —
- Eligible?
- —
No personal income docs; deal must DSCR.
Hard money
10% down · 12.0% · 12mo
- Down + closing
- —
- Monthly P&I
- —
- Monthly cashflow
- —
- DSCR
- —
- Eligible?
- —
Short-term bridge; refi at stabilization.
Rent comps 40 comps
| Address | Beds | Baths | Sqft | Rent | $/sqft | DOM | Units | Dist |
|---|---|---|---|---|---|---|---|---|
| 23580 Walden Center Dr #209 Estero, FL | 1.0 | 1.0 | 742 | $1,550 | $2.09 | 21d | 1 | 0.07mi |
| 23520 Walden Center Dr #308 Estero, FL | 2.0 | 2.0 | 1239 | $2,000 | $1.61 | 5d | 1 | 0.10mi |
| 23520 Walden Center Dr #308 Estero, FL | 2.0 | 2.0 | 1239 | $2,000 | $1.61 | 25d | 1 | 0.10mi |
| 23640 Walden Center Dr #106 Estero, FL | 2.0 | 2.0 | 1052 | $1,850 | $1.76 | 3d | 1 | 0.14mi |
| 23500 Walden Center Dr Estero, FL | 1.0–2.0 | 1.0–2.0 | 803 | $2,800 | $3.48 | 17d | 3 | 0.14mi |
| 23660 Walden Center Dr Estero, FL | 1.0 | 1.0 | 649 | $1,522 | $2.34 | 16d | 1 | 0.17mi |
| 23680 Walden Center Dr #107 Estero, FL | 2.0 | 2.0 | 1052 | $1,900 | $1.81 | 5d | 1 | 0.20mi |
| 23710 Walden Center Dr #308 Estero, FL | 3.0 | 2.0 | 1355 | $3,000 | $2.21 | 25d | 1 | 0.21mi |
| 8010 Via Sardinia Way Estero, FL | 1.0–2.0 | 1.5–2.0 | 1202 | $2,300 | $1.91 | 25d | 2 | 0.44mi |
| 8010 Via Sardinia Way #4112 Estero, FL | 1.0 | 1.5 | 925 | $2,200 | $2.38 | 25d | 1 | 0.44mi |
| 8010 Via Sardinia Way #4208 Estero, FL | 3.0 | 2.0 | 1351 | $3,800 | $2.81 | 25d | 1 | 0.44mi |
| 8010 Via Sardinia St #202 Estero, FL | 2.0 | 2.0 | 1480 | $2,200 | $1.49 | 17d | 1 | 0.44mi |
| 8010 Via Sardinia Way #4112 Estero, FL | 1.0 | 1.5 | 925 | $1,995 | $2.16 | 23d | 1 | 0.44mi |
| 8000 Via Sardinia Way #5301 Estero, FL | 3.0 | 2.0 | 1351 | $2,500 | $1.85 | 5d | 1 | 0.47mi |
| 8000 Via Sardinia Way #5207 Estero, FL | 2.0 | 2.0 | 1380 | $5,500 | $3.99 | 25d | 1 | 0.47mi |
| 8540 Violeta St #202 Estero, FL | 3.0 | 2.0 | 1440 | $2,495 | $1.73 | 25d | 1 | 0.48mi |
| 8560 Evernia Ct #204 Estero, FL | 3.0 | 2.0 | 1440 | $2,100 | $1.46 | 23d | 1 | 0.48mi |
| 8561 Evernia Ct #101 Estero, FL | 2.0 | 2.0 | 1068 | $2,000 | $1.87 | 25d | 1 | 0.49mi |
| 8560 Violeta St #101 Estero, FL | 2.0 | 3.0 | 1261 | $2,200 | $1.74 | 25d | 1 | 0.49mi |
| 8561 Violeta St #202 Bonita Springs, FL | 3.0 | 2.0 | 1440 | $2,950 | $2.05 | 25d | 1 | 0.50mi |
| 23161 Fashion Dr #7109 Estero, FL | 2.0 | 2.0 | 1444 | $4,000 | $2.77 | 25d | 1 | 0.51mi |
| 23159 Amgci Way #3314 Estero, FL | 2.0 | 2.0 | 1226 | $2,400 | $1.96 | 25d | 1 | 0.52mi |
| 23159 Amgci Way Estero, FL | 1.0–2.0 | 1.5–2.0 | 1164 | $4,500 | $3.87 | 23d | 2 | 0.52mi |
| 8510 Violeta St #201 Estero, FL | 2.0 | 2.0 | 1152 | $2,400 | $2.08 | 25d | 1 | 0.53mi |
| 23520 Alamanda Dr #203 Estero, FL | 2.0 | 2.0 | 1244 | $2,200 | $1.77 | 5d | 1 | 0.54mi |
| 23520 Alamanda Dr #202 Estero, FL | 3.0 | 2.0 | 1452 | $5,500 | $3.79 | 25d | 1 | 0.54mi |
| 8011 Via Monte Carlo Way #2213 Estero, FL | 2.0 | 2.0 | 1226 | $2,450 | $2.00 | 13d | 1 | 0.55mi |
| 8500 Violeta St #102 Estero, FL | 2.0 | 2.0 | 1468 | $5,200 | $3.54 | 3d | 1 | 0.56mi |
| 23550 Alamanda Dr #203 Estero, FL | 2.0 | 2.0 | 1152 | $5,000 | $4.34 | 25d | 1 | 0.57mi |
| 8001 Via Monte Carlo Way Unit 103 Estero, FL | 3.0 | 2.0 | 1351 | $2,800 | $2.07 | 20d | 1 | 0.59mi |
| 23611 Alamanda Dr #202 Estero, FL | 3.0 | 2.0 | 1440 | $2,900 | $2.01 | 25d | 1 | 0.65mi |
| 21715 Bridgegate Ct Estero, FL | 3.0 | 2.0 | 1407 | $2,750 | $1.95 | 25d | 1 | 0.85mi |
| 23526 Sandycreek Ter #304 Estero, FL | 2.0 | 2.0 | 1368 | $6,500 | $4.75 | 25d | 1 | 0.88mi |
| 23591 Sandycreek Ter #1006 Estero, FL | 2.0 | 2.0 | 1209 | $6,000 | $4.96 | 25d | 1 | 0.89mi |
| 23601 Sandycreek Ter #903 Estero, FL | 2.0 | 2.0 | 1246 | $6,000 | $4.82 | 25d | 1 | 0.91mi |
| 22201 Fountain Lakes Blvd Estero, FL | 1.0–3.0 | 1.0–2.0 | 1000 | $1,600 | $1.60 | 25d | 1 | 0.95mi |
| 3685 Stone Way Estero, FL | 2.0 | 2.0 | 1115 | $1,500 | $1.35 | 25d | 1 | 0.98mi |
| 3728 Stone Way Estero, FL | 2.0 | 2.0 | 1275 | $2,000 | $1.57 | 25d | 1 | 1.07mi |
| 24821 Lakemont Cove Ln #101 Bonita Springs, FL | 2.0 | 2.0 | 1203 | $6,500 | $5.40 | 25d | 1 | 1.14mi |
| 9030 Spring Run Blvd #508 Estero, FL | 2.0 | 2.0 | 1333 | $6,500 | $4.88 | 25d | 1 | 1.14mi |
HOA detail condo
- Monthly dues
- $438 · $5,256/yr
- Assessments
- None detected in remarks — confirm with the listing agent.
Listing history 32 events
-
2026-06-22days on market $274,900 Active 34 DOM
-
2026-06-17days on market $274,900 Active 30 DOM
-
2026-06-16days on market $274,900 Active 29 DOM
-
2026-06-15days on market $274,900 Active 28 DOM
-
2026-06-13days on market $274,900 Active 26 DOM
-
2026-06-10days on market $274,900 Active 23 DOM
-
2026-06-09days on market $274,900 Active 22 DOM
-
2026-06-08days on market $274,900 Active 21 DOM
-
2026-06-07days on market $274,900 Active 20 DOM
-
2026-06-03days on market $274,900 Active 16 DOM
-
2026-06-02days on market $274,900 Active 15 DOM
-
2026-06-01days on market $274,900 Active 14 DOM
-
2026-05-31days on market $274,900 Active 13 DOM
-
2026-05-14$274,900 Active
-
2024-12-31historical
-
2024-11-01historical $3,495
-
2024-10-17$285,000 Active
-
2024-09-05price $3,495
-
2024-08-01$3,795
-
2020-12-29soldstatus $150,000
-
2020-10-14price $153,500
-
2019-10-19status Pending
-
2018-10-15soldstatus $142,000 Closed
-
2018-09-17status Pending With Contingencies
-
2018-06-21price $143,900
-
2018-05-22$145,000 Active
-
2018-05-17historical
-
2018-04-10price $147,500
-
2017-12-22$149,900 Active
-
2015-03-02price $52,500
-
2010-06-17soldstatus $53,000
-
2004-09-30soldstatus $27,500,000
ⓘ Source: listings_history table (triggers on properties + properties_extension) + one-shot
backfill from property_details.listing_events for pre-trigger history.
Tax reassessment forecast FL · Resets to sale price
- Current annual tax
- $2,503 · $209/mo
- Projected year-2 tax
- $2,503 · $209/mo
- Expected delta
- $0/yr ($0/mo · 0.0%)
ⓘ Screening estimate from a state-policy table — verify with the county assessor before closing.
Climate risk First Street
- Flood 3/10 Moderate FEMA zone X (unshaded) · 13% chance over 30 yrs
- Wildfire 3/10 Moderate
- Heat 10/10 Extreme 7 d/yr ≥107°F today · 31 d/yr by 30 yrs out
- Wind 10/10 Extreme 99% chance of damaging wind over 30 yrs
- Air quality 3/10 Moderate 2 unhealthy d/yr today · 2 by 30 yrs out
Nearby sold comps map
Loading sold comps map…
Walkable amenities ~0.75 mi
Loading nearby amenities…
Taxation est. · year 1
- Rental income
- $30,962
- − Mortgage interest
- −$15,399
- − Property taxes
- −$2,503
- − Insurance
- −$1,374
- − Repairs & maintenance
- −$2,477
- − Management
- −$2,477
- − HOA
- −$5,256
- − Depreciation
- −$7,997
- Taxable loss
- −$6,521
- Est. tax savings @ 24.0%
- +$1,565
- After-tax cash flow
- $-407/yr
For passive investors: Depreciation is non-cash, so a rental often shows a tax loss while cash-flowing — sheltering income. Rental losses are passive: they offset passive income freely, and up to $25,000/yr can offset ordinary (W-2) income if you actively participate and your MAGI is under $100k (phasing out to $0 by $150k); unused losses carry forward. On sale, claimed depreciation is recaptured at up to 25%, and gains may owe capital-gains tax (a 1031 exchange can defer both). Figures are a year-1 estimate at your 24.0% rate — not tax advice; consult a CPA.
Schools (NCES district)
- District
- Lee
- NCES district ID
- 1201080
- Math proficiency
- 47% ▼ -11.00%
- Reading proficiency
- 50% ▼ -4.00%
- Median HH income
- $49,518
- Composite
- 41.49/100
- National rank
- #3458
- State rank
- #42 of 73 in FL
Livability — Estero
- Score
- 79/100
- State rank
- #149
- US rank
- #2242
Category grades
Schools grade is shown separately in the Schools card above.
Census & demographics
- Census place
- Estero, FL
- County
- Lee County · 788,662 people
- City population
- 31,926
- Metro
- Cape Coral-Fort Myers, FL
- Population (ZIP)
- 16,475
- Household income
- $130,719
- Rent vs Own
- Severe rent burden
- 554.0
Population outlook (Lee County) Hauer SSP2
- Today (2025)
- 871,946 people
- By 2030
- 955,468 · +9.6%
- By 2040
- 1,113,587 · +27.7%
- By 2050
- 1,256,891 · +44.1%
- By 2075
- 1,560,270 · +78.9%
- By 2100
- 1,726,848 · +98.0%
Race, ethnicity, and origin ACS 2023
- Neighborhood character
- Predominantly White (91%)
- Race & ethnicity
- White 91% Hispanic / Latino 5% Two or more races 3% Asian 1%
- Common ancestry
- Slovak 5% Romanian 4% Serbian 2%
- Foreign-born
- 10% · Canada, Jamaica
- Languages at home
- 91% English-only · Spanish 4% German/W. Germanic 1% Other Indo-European 1%
Political lean MEDSL · Lee
- 2024 margin
- Strong R (+28.4) · D 35.5% · R 63.9%
- 2008→2024 swing
- -18.0pp toward R · 2008: -10.4pp · 2024: -28.4pp
- All cycles
- 2024: R+28.4 2020: R+19.2 2016: R+20.4 2012: R+16.6 2008: R+10.4
Not yet ingested
- Civics
- —
Market trends
- HPI YoY
- ▼ -236.48%
- Current HPI
- 237.4416
- Rent YoY
- ▲ 2.85%
- Metro
- Cape Coral-Fort Myers, FL
- State GDP YoY
- ▲ 3.28%
- F500 in state
- 36
Industry mix (Fortune 500 HQ in FL)
| Industry | F500 HQs | Revenue |
|---|---|---|
| Industrial Technology | 2 | $29B |
|
||
| Insurance | 2 | $17B |
|
||
| Retail | 1 | $60B |
|
||
| Technology Distribution | 1 | $58B |
|
||
| Homebuilding | 1 | $35B |
|
||
| Technology Manufacturing | 1 | $35B |
|
||
Price history
-99.0% since first listed19 events — show timeline
- 2026-05-14 Listed $274,900 FORTMLS
- 2024-12-31 Listing Removed — NAPLESMLS
- 2024-11-01 Rental Removed $3,495 NAPLESMLS
- 2024-10-17 Listed $285,000 NAPLESMLS
- 2024-09-05 Price Changed $3,495 NAPLESMLS
- 2024-08-01 Listed for Rent $3,795 NAPLESMLS
- 2020-12-29 Sold (Public Records) $150,000 Public Records
- 2020-10-14 Price Changed $153,500 BEARMLS
- 2019-10-19 Pending — FORTMLS
- 2018-10-15 Sold (MLS) $142,000 FORTMLS
- 2018-09-17 Pending — FORTMLS
- 2018-06-21 Price Changed $143,900 FORTMLS
- 2018-05-22 Listed $145,000 FORTMLS
- 2018-05-17 Listing Removed — FORTMLS
- 2018-04-10 Price Changed $147,500 FORTMLS
- 2017-12-22 Listed $149,900 FORTMLS
- 2015-03-02 Price Changed $52,500 FORTMLS
- 2010-06-17 Sold (MLS) $53,000 FORTMLS
- 2004-09-30 Sold (Public Records) $27,500,000 Public Records
Property tax history
+4.4%/yrLatest (2025): $2,503 · +4.9% YoY. Source: county tax records.
Cash-flow waterfall
monthlySold comps — $/sqft
last 12 mo · ≤1 miLoading sold comps…