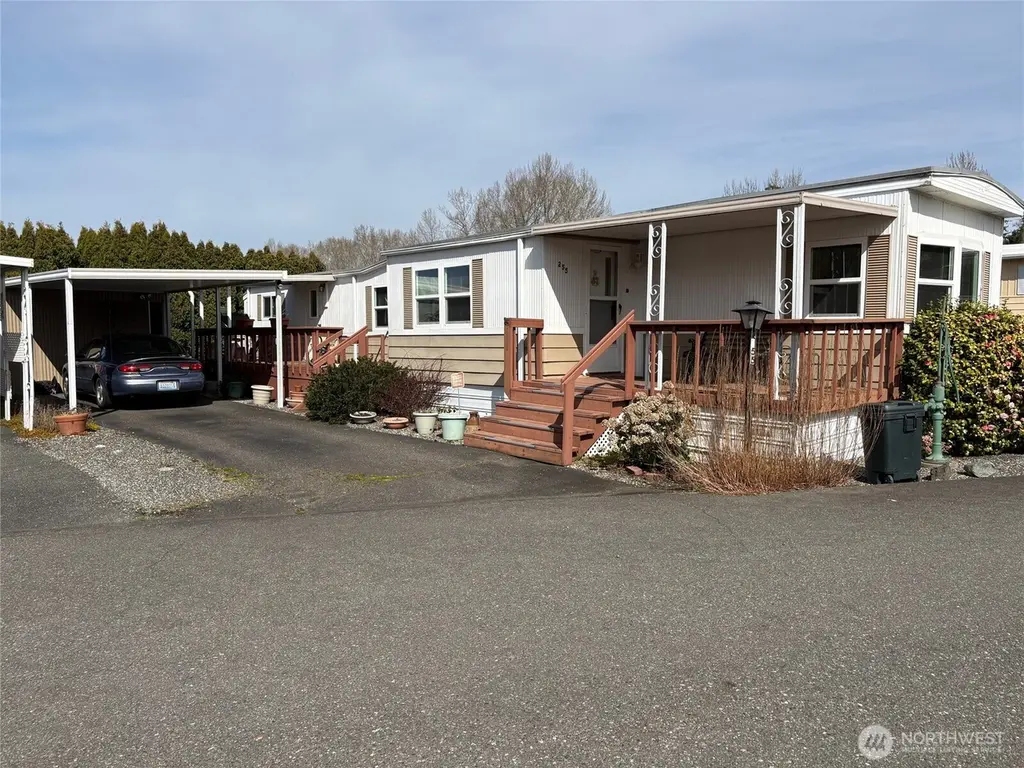
1200 Lincoln St #255 · Bellingham, WA
Flood risk 1/10 · Minimal
- FEMA flood zone
- X (unshaded)
- Chance of flooding over 30 yrs
- 0.0%
- Est. flood insurance / yr
- $507 – $1,088
Fire risk 2/10 · Minimal
- Est. fire insurance / yr
- $604 – $1,122
Heat risk 3/10 · Minor
- Hot days now (above 83°F)
- 7 days/yr
- Hot days in 30 yrs
- 17 days/yr
Wind risk 1/10 · Minimal
- Chance of severe wind over 30 yrs
- —
Air-quality risk 6/10 · Moderate
- Unhealthy air days now
- 9 days/yr
- Unhealthy air days in 30 yrs
- 10 days/yr
Risk factors via First Street. Map © Google.
Why this score? — see what drove the B grade
The composite is a weighted blend of 9 inputs, each scored 0–100. Each bar is that input's sub-score; the figure is the points it added to the 100-point composite (weight × sub-score).
- Cash flow +30.0/30.0
- 1% rule +10.0/10.0
- DSCR +10.0/10.0
- ARV discount +7.5/15.0
- Schools +4.8/10.0
- Livability +4.0/5.0
- Rent growth +3.3/5.0
- Condition / age +2.5/5.0
- Appreciation +0.0/10.0
$64,800
🖨 Deal sheet 📄 Offer letter ✓ Due diligence
Listing remarks
A charming, bright, remodeled and well-cared single-wide home conveniently located in the 55+ Lakeway Estates Mobile Home Park with community club house. Walking distance to Fred Meyer, Whole Foods, shopping, restaurants, bus lines and trail systems. Two bedroom/one full bath & one 3/4 bath. Many newly updated features including new interior painting, newly painted kitchen cabinets & bathrooms, new furnace with central air, windows, blinds, kitchen hood, plumbing for bathrooms and many more for low maintenance and comfortable living. Spacious carport and a separate storage shed.
Key facts
- Community club house
- Remodeled
- Walkable access
Tags
Property features AI
Finance
- Financial info: Land lease: $1,495; Cash sale only
- HOA & community: Located in Lakeway Mobile Estate Park (senior community); Park amenities include BBQs and clubhouse; Approximately 218 homes in the park; Senior exemption
Exterior
- Parking: Carport
- Utilities: Public water (COB); Public sewer (COB); Electricity by PSE
- Home design: Manufactured single-wide; One level; Manufactured house (Marlette); West-facing; Has view
- Construction: Metal/vinyl construction; Tie down foundation
- Exterior features: Metal/vinyl exterior; Corner lot; Paved lot
Interior
- Kitchen: Dishwasher; Garbage disposal; Refrigerator; Stove/Range
- Bedrooms: 2 bedrooms
- Bathrooms: 1 full bath; 1 three-quarter bath; 1 shower
- Interior features: Dishwasher; Garbage disposal; Refrigerator; Stove/Range
- Laundry & utility: Washer; Dryer
Neighborhood map
What this means for you Summary
Snapshot
- This is a 2-bed/1.5-bath manufactured listed at $65k.
Deal economics
- At list price, monthly cash flow is $1k ($15k/yr) — positive.
- The deal already cash-flows at list — no discount required.
- Meets the 1% rule at list price ($2k rent vs $65k).
- Recommended offer: $61k (6.0% below list) — sets the bar for market timing.
- Cap rate 28.9% vs local median 2.0% in Bellingham — top-decile yield for the area; either an underpriced asset or a hidden risk that comps aren't pricing in. Stress-test before assuming the spread holds.
Location & tenants
- Location reads 80/100 on livability (#102 in WA, #1,947 nationally) — a professional / high-income tenant draw. Strengths: amenities A+, commute A+, health & safety A+; Watch: crime F, cost of living F.
- Bellingham School District (urban): math 47% / reading 63% proficiency, ranked #106 of 291 in WA (top 36%) — acceptable for families but not a draw, mixed tenant base, ~2y average lease.
- Market conditions: Rents rising (+3.4%/yr); 270 active listings in the ZIP; 40 comparable units currently listed for rent nearby; rentals at typical pace (median 21d on market — plan ~3-4 weeks tenant-placement turnaround); solid renter incomes; 1,190 units permitted in Whatcom County in 2024 (327 in 5+ unit buildings).
Forward outlook
- Local home prices are declining (-3.0%/yr); year-one equity from $448 of loan paydown is wiped out by about $2k of value loss. Plan a longer hold.
- Whatcom County population projected at +28% by 2050 — long-run rental-demand tailwind backs the buy-and-hold thesis.
- At projected returns (-3.0% appreciation + 3.4% rent growth), your $18k cash investment doubles in ~2 years — after that, you're playing with house money.
Negotiation context
- It's been on market 76 days — a 6% lower offer ($61k) is reasonable based on typical stale-listing flexibility.
- 2 sale attempts since 15y ago; this cycle's ask has dropped $4k (5%) from the opening price — seller is motivated, your offer sets the floor, not the list.
- Current owner paid $5k; list at $65k implies a 1196% gain — meaningful room to come down on a strong offer.
Questions for the listing agent
- It's been on market 76 days. Have you received any prior offers? Is the seller open to a 6% concession, seller financing, or rate buy-down credit?
- Built in 1970 — when were the roof, HVAC, electrical panel, plumbing, and water heater last replaced?
- Why hasn't it sold? Are there any deal-killer items the seller is aware of (foundation, flood, title, zoning, code violations)?
- Is there a deadline driving the sale (1031 exchange, divorce, estate, relocation)? That informs how much negotiation room exists.
- Schools are B-rated — typically a magnet for longer-tenancy family renters. What's the average tenant stay here, and is there a school-zone premium baked into asking?
- Crime grade is F in this area — have there been break-ins, vandalism, or insurance claims at this property in the last 3 years? What carrier currently insures it and at what premium?
- What's the average days-on-market for RENTAL listings here right now (not sales)? A rising rental-DOM trend means longer vacancies and softer asking-rent achievability than the comps imply.
- What's the recent tenant-quality profile in this submarket — average credit score on applications, eviction rate, late-payment / NSF rate, and stable-employment percentage? A property-management company in the area should have these aggregated.
- How much new for-sale + rental construction is in the pipeline within 1–3 miles? Heavy new supply typically softens prices + rents 12–24 months out; constrained supply supports both.
Investment metrics
- 1% rule
- 3.13% ✓
- Cap rate
- 28.85%
- Cash-on-cash
- 80.57%
- DSCR
- 4.58
- GRM
- 2.7
CMA / ARV
- ARV (on-the-fly)
- $23,400
- Comps found
- 8
Show comp detail 8 sales within ~0.75 mi
| Address | Dist | Beds/Ba | Sqft | Sold | Price | $/sf | Match |
|---|---|---|---|---|---|---|---|
| 1200 Lincoln St #402 | 0.05mi | 2/1.0 | 763 (-2%) | 13mo | $19,000 | $25 | 81 |
| 1200 Lincoln St #267 | 0.03mi | 2/1.0 | 720 (-8%) | 10mo | $3,000 | $4 | 76 |
| 1200 Lincoln St #253 | 0.03mi | 2/1.0 | 840 (+8%) | 10mo | $30,000 | $36 | 75 |
| 1200 Lincoln St #410 | 0.07mi | 2/1.0 | 840 (+8%) | 11mo | $25,500 | $30 | 73 |
| 1200 Lincoln St #121 | 0.10mi | 2/1.0 | 728 (-7%) | 20mo | $57,500 | $79 | 66 |
| 1200 Lincoln St #139 | 0.06mi | 2/1.5 | 672 (-14%) | 12mo | $8,000 | $12 | 64 |
| 1200 Lincoln St #132 | 0.07mi | 2/1.0 | 728 (-7%) | 23mo | $26,000 | $36 | 64 |
| 1200 Lincoln St #195 | 0.16mi | 2/1.0 | 840 (+8%) | 20mo | $25,000 | $30 | 61 |
Match score weights: distance 35% · size 25% · config 20% · recency 20%. Top-matched comps best support the ARV.
Projected returns pro-forma
-3.0% appreciation · 3.38% rent growth · sell at horizon
- IRR
- 81.2%
- Equity multiple
- 4.74×
- Total profit
- $67,860
- Equity at exit
- $9,662
- IRR
- 84.6%
- Equity multiple
- 9.94×
- Total profit
- $162,187
- Equity at exit
- $5,603
Cash invested: $18,144 (down + closing). Projections, not guarantees.
Landlord ↔ Tenant lean methodology
- Overall (STATE)
- 28 Tenant-Leaning
- State Washington
- 28 Tenant-Leaning · D+8
- County
- — inherits STATE
- City
- — inherits STATE
ZIP-level market 98229
- Rents YoY
- 3.4%
- Active inventory
- 270
- Price-to-rent
- 2.7×
Monthly cashflow live
- Estimated rent
- $2,028 high interval (Pro) →
- Mortgage (P&I)
- −$340
- Tax from tax record
- −$17 /mo · $209/yr
- Insurance
- −$27
- HOA
- −$0
- Vacancy / Maint / Mgmt
- −$426
- Net cashflow
- $1,218
Break-even live
UW: 25.0% down · 7.5% · 30yr · 1.5% tax · 5.0% vac · 8.0% maint · 8.0% mgmt
Financing live
Cash to close
- Down payment
- $16,200
- Closing costs
- $1,944
- Reserves months
- —
- Total cash needed
- —
Loan-product check · same deal, 3 products live
Conventional
25% down · 7.5% · 30yr
- Down + closing
- —
- Monthly P&I
- —
- Monthly cashflow
- —
- DSCR
- —
- Eligible?
- —
Personal DTI + credit; lowest rate.
DSCR
20% down · 8.5% · 30yr
- Down + closing
- —
- Monthly P&I
- —
- Monthly cashflow
- —
- DSCR
- —
- Eligible?
- —
No personal income docs; deal must DSCR.
Hard money
10% down · 12.0% · 12mo
- Down + closing
- —
- Monthly P&I
- —
- Monthly cashflow
- —
- DSCR
- —
- Eligible?
- —
Short-term bridge; refi at stabilization.
Rent comps 40 comps
| Address | Beds | Baths | Sqft | Rent | $/sqft | DOM | Units | Dist |
|---|---|---|---|---|---|---|---|---|
| 1212 Nevada St Unit 1 Bellingham, WA | 2.0 | 1.0 | 975 | $1,750 | $1.79 | 21d | 1 | 0.19mi |
| 1743 E Maple St Bellingham, WA | 1.0–3.0 | 1.0–2.0 | 910 | $2,108 | $2.32 | 13d | 12 | 0.31mi |
| 208 N Samish Way Bellingham, WA | 2.0 | 1.0–2.0 | 875 | $2,769 | $3.16 | 13d | 8 | 0.41mi |
| 1015 Otis St Bellingham, WA | 1.0 | 1.0 | 525 | $1,150 | $2.19 | 21d | 1 | 0.42mi |
| 1338 Puget St Unit 1 Bellingham, WA | 2.0 | 1.0 | 801 | $1,800 | $2.25 | 13d | 1 | 0.46mi |
| 3613 Consolidation Ave Bellingham, WA | 3.0 | 2.0 | 1017 | $2,378 | $2.34 | 13d | 8 | 0.47mi |
| 1223 E Laurel St Unit 1223 Bellingham, WA | 2.0 | 1.0 | 800 | $2,150 | $2.69 | 21d | 1 | 0.48mi |
| 935 Otis St Bellingham, WA | 3.0 | 2.0 | 1000 | $2,500 | $2.50 | 21d | 1 | 0.48mi |
| 1471 Moore St Bellingham, WA | 2.0–3.0 | 2.0 | 860 | $1,675 | $1.95 | 21d | 6 | 0.53mi |
| 1211 Jersey St Bellingham, WA | 3.0 | 1.0 | 871 | $2,411 | $2.77 | 13d | 12 | 0.56mi |
| 3966 Byron Ave Unit 105 Bellingham, WA | 2.0 | 2.0 | 995 | $1,650 | $1.66 | 21d | 1 | 0.62mi |
| 3966 Byron Ave Bellingham, WA | 1.0 | 1.0 | 711 | $1,450 | $2.04 | 21d | 1 | 0.62mi |
| 1213 Billy Frank Jr. St Unit 2 Bellingham, WA | 2.0 | 1.0 | 719 | $1,750 | $2.43 | 21d | 1 | 0.63mi |
| 1316 High St Bellingham, WA | 3.0 | 1.0–2.0 | 909 | $2,410 | $2.65 | 21d | 5 | 0.64mi |
| 1024 Billy Frank Jr St #301 Bellingham, WA | 2.0 | 1.0 | 740 | $2,300 | $3.11 | 21d | 1 | 0.66mi |
| 1113 Billy Frank Jr. St Unit 3 Bellingham, WA | 2.0 | 1.0 | 900 | $1,795 | $1.99 | 21d | 1 | 0.66mi |
| 1010 Billy Frank Jr St Bellingham, WA | 2.0 | 1.0 | 850 | $1,765 | $2.08 | 13d | 11 | 0.68mi |
| 3805 Elwood Ave Bellingham, WA | 4.0 | 1.0–2.5 | 1213 | $2,418 | $1.99 | 13d | 49 | 0.71mi |
| 800 Liberty St Unit 17 Bellingham, WA | 2.0 | 1.0 | 950 | $1,795 | $1.89 | 21d | 1 | 0.72mi |
| 1205 N Garden St Bellingham, WA | 2.0–4.0 | 1.0–1.5 | 830 | $2,150 | $2.59 | 21d | 9 | 0.76mi |
| 230 32nd St Unit 250-106 (ADA) Bellingham, WA | 2.0 | 1.0 | 738 | $1,725 | $2.34 | 13d | 1 | 0.76mi |
| 1117 N Garden St Bellingham, WA | 3.0–4.0 | 2.0 | 1100 | $2,233 | $2.03 | 13d | 3 | 0.78mi |
| 421 E Maple St Bellingham, WA | 1.0 | 1.0 | 875 | $900 | $1.03 | 21d | 2 | 0.79mi |
| 921 High St #7 Bellingham, WA | 1.0 | 1.0 | 734 | $2,300 | $3.13 | 21d | 1 | 0.80mi |
| 1100 N Forest St Bellingham, WA | 1.0 | 1.0 | 600 | $1,650 | $2.75 | 21d | 1 | 0.82mi |
| 1111 N Forest St Bellingham, WA | 3.0 | 1.0–1.5 | 770 | $2,375 | $3.08 | 13d | 4 | 0.85mi |
| 1745 James St Unit 1745-A Bellingham, WA | 2.0 | 1.0 | 728 | $1,950 | $2.68 | 13d | 1 | 0.86mi |
| 819 High St #102 Bellingham, WA | 1.0 | 1.0 | 616 | $1,800 | $2.92 | 21d | 1 | 0.87mi |
| 202 E Holly St Bellingham, WA | 1.0 | 1.0 | 397 | $1,650 | $4.15 | 21d | 9 | 0.91mi |
| 508 E Ivy St Unit 104 Bellingham, WA | 2.0 | 1.0 | 704 | $1,850 | $2.63 | 21d | 1 | 0.93mi |
| 508 E Ivy St Apt 101 Bellingham, WA | 2.0 | 1.0 | 704 | $1,795 | $2.55 | 21d | 1 | 0.93mi |
| 112 E Maple St Bellingham, WA | 1.0 | 1.0 | 555 | $1,725 | $3.11 | 13d | 1 | 0.99mi |
| 112 E Maple St Bellingham, WA | 1.0 | 1.0 | 602 | $1,712 | $2.84 | 21d | 2 | 1.00mi |
| 1015 Railroad Ave #303 Bellingham, WA | 1.0 | 1.0 | 640 | $1,800 | $2.81 | 13d | 1 | 1.00mi |
| 487 31st St Bellingham, WA | 1.0–2.0 | 1.0 | 697 | $1,890 | $2.71 | 21d | 33 | 1.01mi |
| 524 32nd St Bellingham, WA | 3.0 | 2.0 | 1100 | $2,480 | $2.25 | 21d | 3 | 1.06mi |
| 705 32nd St Bellingham, WA | 3.0 | 1.0–2.0 | 792 | $2,095 | $2.65 | 21d | 23 | 1.15mi |
| 1818 D St Bellingham, WA | 2.0 | 1.0 | 646 | $2,350 | $3.64 | 13d | 18 | 1.41mi |
| 711 Astor St Bellingham, WA | 1.0 | 1.0 | 660 | $2,075 | $3.14 | 21d | 1 | 1.41mi |
| 2329 Orleans St Apt 2 Bellingham, WA | 2.0 | 1.0 | 750 | $1,450 | $1.93 | 21d | 1 | 1.41mi |
Listing history 23 events
-
2026-06-18days on market $64,800 Active 76 DOM
-
2026-06-17days on market $64,800 Active 75 DOM
-
2026-06-16days on market $64,800 Active 74 DOM
-
2026-06-15days on market $64,800 Active 73 DOM
-
2026-06-14days on market $64,800 Active 71 DOM
-
2026-06-13days on market $64,800 Active 70 DOM
-
2026-06-10days on market $64,800 Active 68 DOM
-
2026-06-09days on market $64,800 Active 67 DOM
-
2026-06-08days on market $64,800 Active 66 DOM
-
2026-06-07days on market $64,800 Active 65 DOM
-
2026-06-05days on market $64,800 Active 62 DOM
-
2026-06-03days on market $64,800 Active 61 DOM
-
2026-06-02days on market $64,800 Active 60 DOM
-
2026-06-01days on market $64,800 Active 59 DOM
-
2026-05-31days on market $64,800 Active 58 DOM
-
2026-05-30days on market $64,800 Active 57 DOM
-
2026-04-05price $64,800
-
2026-04-03$68,400 Active
-
2012-06-01historical
-
2012-06-01soldstatus $5,000 Sold
-
2012-04-23status Pending Inspection
-
2012-03-26price $10,000
-
2011-09-08$15,000 Active
ⓘ Source: listings_history table (triggers on properties + properties_extension) + one-shot
backfill from property_details.listing_events for pre-trigger history.
Tax reassessment forecast WA · Resets to sale price
- Current annual tax
- $209 · $17/mo
- Projected year-2 tax
- $635 · $53/mo
- Expected delta
- +$426/yr (+$35/mo · 203.5%)
ⓘ Screening estimate from a state-policy table — verify with the county assessor before closing.
Climate risk First Street
- Flood 1/10 Low FEMA zone X (unshaded) · 0% chance over 30 yrs
- Wildfire 2/10 Low
- Heat 3/10 Moderate 7 d/yr ≥83°F today · 17 d/yr by 30 yrs out
- Wind 1/10 Low
- Air quality 6/10 Major 9 unhealthy d/yr today · 10 by 30 yrs out
Nearby sold comps map
Loading sold comps map…
Walkable amenities ~0.75 mi
Loading nearby amenities…
Taxation est. · year 1
- Rental income
- $24,342
- − Mortgage interest
- −$3,630
- − Property taxes
- −$209
- − Insurance
- −$324
- − Repairs & maintenance
- −$1,947
- − Management
- −$1,947
- − Depreciation
- −$1,885
- Taxable income
- $14,399
- Est. tax owed @ 24.0%
- −$3,456
- After-tax cash flow
- $11,163/yr
For passive investors: Depreciation is non-cash, so a rental often shows a tax loss while cash-flowing — sheltering income. Rental losses are passive: they offset passive income freely, and up to $25,000/yr can offset ordinary (W-2) income if you actively participate and your MAGI is under $100k (phasing out to $0 by $150k); unused losses carry forward. On sale, claimed depreciation is recaptured at up to 25%, and gains may owe capital-gains tax (a 1031 exchange can defer both). Figures are a year-1 estimate at your 24.0% rate — not tax advice; consult a CPA.
Schools (NCES district)
- District
- Bellingham School District
- NCES district ID
- 5300420
- Math proficiency
- 47% ▼ -6.00%
- Reading proficiency
- 63% ▼ -1.00%
- Median HH income
- $47,678
- Composite
- 48.49/100
- National rank
- #4632
- State rank
- #106 of 291 in WA
Livability — Bellingham
- Score
- 80/100
- State rank
- #102
- US rank
- #1947
Category grades
Schools grade is shown separately in the Schools card above.
Census & demographics
- Census place
- Bellingham, WA
- County
- Whatcom County · 209,776 people
- City population
- 130,296
- Metro
- Bellingham, WA
- Population (ZIP)
- 33,298
- Household income
- $90,945
- Rent vs Own
- Severe rent burden
- 1040.0
Population outlook (Whatcom County) Hauer SSP2
- Today (2025)
- 240,408 people
- By 2030
- 254,667 · +5.9%
- By 2040
- 281,365 · +17.0%
- By 2050
- 307,592 · +27.9%
- By 2075
- 375,576 · +56.2%
- By 2100
- 421,637 · +75.4%
Race, ethnicity, and origin ACS 2023
- Neighborhood character
- Predominantly White (77%)
- Race & ethnicity
- White 77% Two or more races 13% Hispanic / Latino 10% Asian 3%
- Hispanic origin (detail)
- Mexican 8%
- Common ancestry
- Portuguese 6% Italian 4% Slovak 4%
- Foreign-born
- 8% · Canada, China, Vietnam
- Languages at home
- 88% English-only · Spanish 7% Chinese 1% German/W. Germanic 1%
Political lean MEDSL · Whatcom
- 2024 margin
- Strong D (+24.9) · D 60.8% · R 35.9% · Other 3.3%
- 2008→2024 swing
- +6.9pp toward D · 2008: 18.0pp · 2024: 24.9pp
- All cycles
- 2024: D+24.9 2020: D+23.9 2016: D+17.7 2012: D+12.1 2008: D+18.0
Not yet ingested
- Civics
- —
Market trends
- HPI YoY
- ▼ -652.00%
- Current HPI
- 413.1478
- Rent YoY
- ▲ 3.38%
- Metro
- Bellingham, WA
- State GDP YoY
- ▲ 4.65%
- F500 in state
- 22
Industry mix (Fortune 500 HQ in WA)
| Industry | F500 HQs | Revenue |
|---|---|---|
| Retail | 2 | $269B |
|
||
| Technology / Retail | 1 | $638B |
|
||
| Technology | 1 | $245B |
|
||
| Telecommunications | 1 | $38B |
|
||
| Food / Beverage | 1 | $36B |
|
||
| Automotive / Trucks | 1 | $34B |
|
||
Price history
+332.0% since first listed7 events — show timeline
- 2026-04-05 Price Changed $64,800 NWMLS as Distributed by MLS Grid
- 2026-04-03 Listed $68,400 NWMLS as Distributed by MLS Grid
- 2012-06-01 Delisted — NWMLS as Distributed by MLS Grid
- 2012-06-01 Sold (MLS) $5,000 NWMLS as Distributed by MLS Grid
- 2012-04-23 Pending — NWMLS as Distributed by MLS Grid
- 2012-03-26 Price Changed $10,000 NWMLS as Distributed by MLS Grid
- 2011-09-08 Listed $15,000 NWMLS as Distributed by MLS Grid
Property tax history
+4.6%/yrLatest (2024): $209 · -8.0% YoY. Source: county tax records.
Cash-flow waterfall
monthlySold comps — $/sqft
last 12 mo · ≤1 miLoading sold comps…