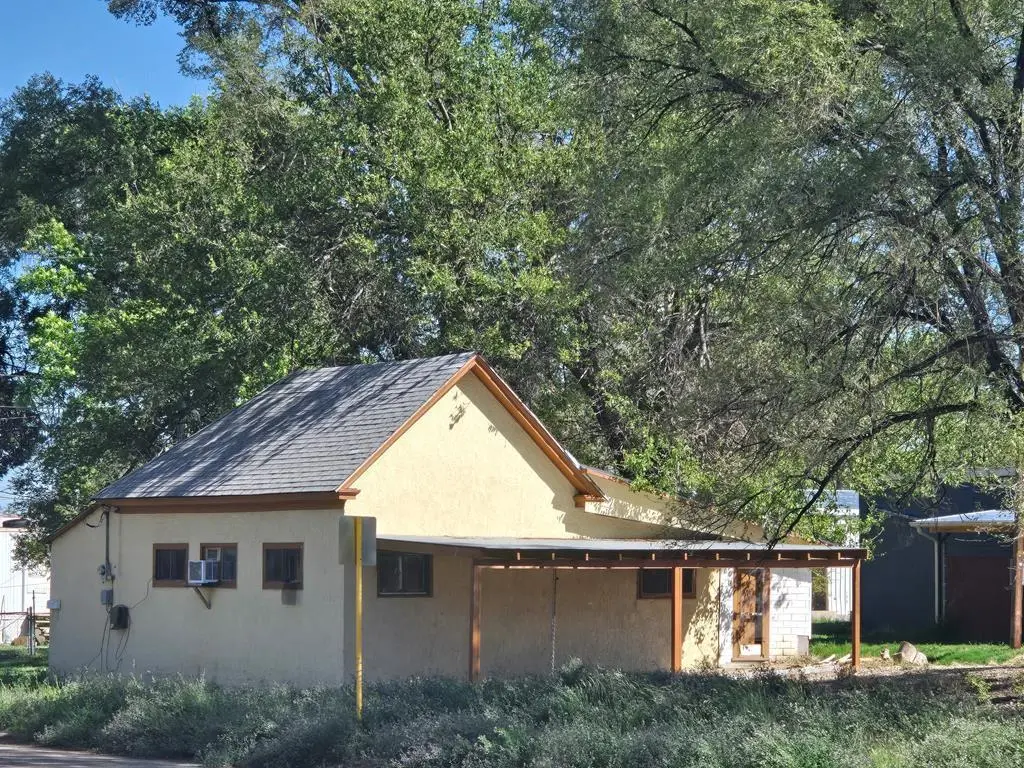
606 Swink Ave · Rocky Ford, CO
Flood risk No data
- FEMA flood zone
- —
- Chance of flooding over 30 yrs
- —
- Est. flood insurance / yr
- —
Fire risk No data
- Est. fire insurance / yr
- —
Heat risk No data
- Hot days now (above threshold)
- —
- Hot days in 30 yrs
- —
Wind risk No data
- Chance of severe wind over 30 yrs
- —
Air-quality risk No data
- Unhealthy air days now
- —
- Unhealthy air days in 30 yrs
- —
Risk factors via First Street. Map © Google.
Why this score? — see what drove the C grade
The composite is a weighted blend of 9 inputs, each scored 0–100. Each bar is that input's sub-score; the figure is the points it added to the 100-point composite (weight × sub-score).
- Cash flow +19.3/30.0
- ARV discount +15.0/15.0
- DSCR +6.1/10.0
- 1% rule +5.1/10.0
- Livability +3.9/5.0
- Rent growth +2.5/5.0
- Condition / age +2.5/5.0
- Schools +2.4/10.0
- Appreciation +0.0/10.0
$83,000
🖨 Deal sheet (PDF) 📄 Offer letter ✓ Due diligence
Listing remarks MLS
Great investment opportunity! This is a 2 bedroom ranch style home has been started but needs someone to put there finishing touches on it. Nice gas fireplace in the living room, some new drywall, new plumbing, new water heater, and newly remodeled bathroom. The Exterior has been painted and has a attached Carport. Houses in this price range are getting harder to find so don't miss out and make your appointment today. Motivated Buyer! Buyer will consider reasonable Offers.
Key facts
- Laminate flooring
- Attached carport
- Composition roof
Tags
Property features AI
Finance
- Other: Property zoned C-2
- HOA & community: No association amenities
Exterior
- Parking: Carport; Attached parking (no garage)
- Utilities: Public water; Public sewer
- Home design: Single family residential; Frame and stucco construction
- Construction: Composition roof
- Exterior features: No patio or porch; Irregular lot
Interior
- Kitchen: Range; Oven
- Bedrooms: 2 bedrooms on the main level
- Flooring: Vinyl
- Bathrooms: 1 full bathroom on the main level
- Heating & cooling: Electric heating; Baseboard heating; Wall-mounted cooling unit
- Interior features: Walk-in closet(s); Master bedroom on main level; Wood window frames; Gas log fireplace in the living room
- Laundry & utility: Dryer; Laundry on the main level
Neighborhood map
What this means for you Summary
Snapshot
- This is a 1-bed/1.0-bath single-family listed at $83k.
Deal economics
- At list price, monthly cash flow is $92 ($1k/yr) — positive.
- The deal already cash-flows at list — no discount required.
- Meets the 1% rule at list price ($842 rent vs $83k).
- Recommended offer: $82k (1.5% below list) — sets the bar for market timing.
- Cap rate 7.6% vs local median 4.6% in Rocky Ford — top-decile yield for the area; either an underpriced asset or a hidden risk that comps aren't pricing in. Stress-test before assuming the spread holds.
Location & tenants
- Location reads 78/100 on livability (#22 in CO, #2,671 nationally) — a middle-class / working-renter tenant base. Strengths: crime A+, cost of living A+, health & safety A+; Watch: amenities D+, employment F.
- Rocky Ford School District No. R2 (town): math 24% / reading 36% proficiency, ranked #58 of 86 in CO (top 67%) — families likely to look elsewhere, expect single-tenant / working-renter base with shorter leases; 67% free/reduced lunch — lower-income household profile, screen leases tightly.
- Zoned schools: Jefferson Intermediate School (math 33% / reading 35%, grade F, #452 of 966 statewide, top 47%, 199 students, 78% FRL); Rocky Ford Junior/Senior High School (math 12% / reading 37%, grade F, #266 of 381 statewide, top 79%, 285 students, 71% FRL).
- Market conditions: 42 active listings in the ZIP; 11 units permitted in Otero County in 2024 (0 in 5+ unit buildings).
Forward outlook
- Local home prices are declining (-3.0%/yr); year-one equity from $574 of loan paydown is wiped out by about $2k of value loss. Plan a longer hold.
- Otero County population projected at -17% by 2050 — secular population decline; favor cash flow + early exit over multi-decade hold.
Negotiation context
- It's been on market 18 days — a 2% lower offer ($82k) is reasonable based on typical stale-listing flexibility.
- 3 sale attempts since 6y ago with the ask held roughly flat each time — persistent listings suggest the price (not the market) is what's stuck; bring a comps-based counter.
- Current owner paid $40k; list at $83k implies a 108% gain — meaningful room to come down on a strong offer.
Risks & watch-outs
- Watch-outs: built in 1906 — expect roof / HVAC / electrical / plumbing capex.
Questions for the listing agent
- Built in 1906 — when were the roof, HVAC, electrical panel, plumbing, and water heater last replaced?
- Is there a deadline driving the sale (1031 exchange, divorce, estate, relocation)? That informs how much negotiation room exists.
- Schools are F-rated, which usually means shorter tenancies and higher turnover. Who's the typical renter profile here, and what's been the actual vacancy rate?
- What's the average days-on-market for RENTAL listings here right now (not sales)? A rising rental-DOM trend means longer vacancies and softer asking-rent achievability than the comps imply.
- What's the recent tenant-quality profile in this submarket — average credit score on applications, eviction rate, late-payment / NSF rate, and stable-employment percentage? A property-management company in the area should have these aggregated.
- How much new for-sale + rental construction is in the pipeline within 1–3 miles? Heavy new supply typically softens prices + rents 12–24 months out; constrained supply supports both.
Investment metrics
- 1% rule
- 1.01% ✓
- Cap rate
- 7.62%
- Cash-on-cash
- 4.74%
- DSCR
- 1.21
- GRM
- 8.2
CMA / ARV
- ARV (on-the-fly)
- $118,592
- Comps found
- 5
Show comp detail 5 sales within ~0.75 mi
| Address | Dist | Beds/Ba | Sqft | Sold | Price | $/sf | Match |
|---|---|---|---|---|---|---|---|
| 510 Chestnut Ave | 0.10mi | 2/1.0 (+1) | 884 (+1%) | 14mo | $120,000 | $136 | 76 |
| 702 S 9th St | 0.51mi | 2/1.0 (+1) | 836 (-4%) | 13mo | $100,000 | $120 | 54 |
| 818 S Main St | 0.66mi | 2/1.0 (+1) | 824 (-6%) | 5mo | $157,000 | $191 | 51 |
| 712 S 12 St | 0.72mi | 2/1.0 (+1) | 864 (-1%) | 18mo | $122,000 | $141 | 45 |
| 410 S 3rd St | 0.36mi | 2/1.0 (+1) | 956 (+10%) | 20mo | $75,000 | $78 | 45 |
Match score weights: distance 35% · size 25% · config 20% · recency 20%. Top-matched comps best support the ARV.
Projected returns pro-forma
-3.0% appreciation · 3.0% rent growth · sell at horizon
- IRR
- -8.9%
- Equity multiple
- 0.67×
- Total profit
- $-7,595
- Equity at exit
- $12,376
- IRR
- 0.6%
- Equity multiple
- 1.04×
- Total profit
- $960
- Equity at exit
- $7,176
Cash invested: $23,240 (down + closing). Projections, not guarantees.
Landlord ↔ Tenant lean methodology
- Overall (STATE)
- 38 Tenant-Leaning
- State Colorado
- 38 Tenant-Leaning · D+4
- County
- — inherits STATE
- City
- — inherits STATE
ZIP-level market 81067
- Home prices YoY
- -25.2%
- Active inventory
- 42
- Price-to-rent
- 8.2×
Monthly cashflow live
- Estimated rent
- $842 medium interval (Pro) →
- Mortgage (P&I)
- −$435
- Tax est. 1.5%
- −$104 /mo · $1,245/yr
- Insurance
- −$35
- HOA
- −$0
- Vacancy / Maint / Mgmt
- −$177
- Net cashflow
- $92
Break-even live
Sensitivity live
| Price | -10% $149 | -5% $120 | +0% $92 | +5% $63 | +10% $34 |
|---|---|---|---|---|---|
| Rent | -10% $25 | -5% $58 | +0% $92 | +5% $125 | +10% $158 |
| Rate | -1.0pp $134 | -0.5pp $113 | base $92 | +0.5pp $70 | +1.0pp $48 |
UW: 25.0% down · 7.5% · 30yr · 1.5% tax · 5.0% vac · 8.0% maint · 8.0% mgmt
Financing live
Cash to close
- Down payment
- $20,750
- Closing costs
- $2,490
- Reserves months
- —
- Total cash needed
- —
Loan-product check · same deal, 3 products live
Conventional
25% down · 7.5% · 30yr
- Down + closing
- —
- Monthly P&I
- —
- Monthly cashflow
- —
- DSCR
- —
- Eligible?
- —
Personal DTI + credit; lowest rate.
DSCR
20% down · 8.5% · 30yr
- Down + closing
- —
- Monthly P&I
- —
- Monthly cashflow
- —
- DSCR
- —
- Eligible?
- —
No personal income docs; deal must DSCR.
Hard money
10% down · 12.0% · 12mo
- Down + closing
- —
- Monthly P&I
- —
- Monthly cashflow
- —
- DSCR
- —
- Eligible?
- —
Short-term bridge; refi at stabilization.
Listing history 14 events
-
2026-06-22days on market $83,000 Active 18 DOM
-
2026-06-21days on market $83,000 Active 17 DOM
-
2026-06-21days on market $83,000 Active 16 DOM
-
2026-06-18days on market $83,000 Active 14 DOM
-
2026-06-17days on market $83,000 Active 13 DOM
-
2026-06-16days on market $83,000 Active 12 DOM
-
2026-06-15days on market $83,000 Active 11 DOM
-
2026-06-13days on market $83,000 Active 9 DOM
-
2026-06-12days on market $83,000 Active 8 DOM
-
2026-06-09days on market $83,000 Active 5 DOM
-
2026-06-08days on market $83,000 Active 4 DOM
-
2026-06-07days on market $83,000 Active 3 DOM
-
2026-06-07remarks 699-char remark
-
2026-06-07$83,000 Active 2 DOM
ⓘ Source: listings_history table (triggers on properties + properties_extension) + one-shot
backfill from property_details.listing_events for pre-trigger history.
Nearby sold comps map
Loading sold comps map…
Walkable amenities ~0.75 mi
Loading nearby amenities…
Taxation est. · year 1
- Rental income
- $10,106
- − Mortgage interest
- −$4,649
- − Property taxes
- −$1,245
- − Insurance
- −$415
- − Repairs & maintenance
- −$808
- − Management
- −$808
- − Depreciation
- −$2,415
- Taxable loss
- −$235
- Est. tax savings @ 24.0%
- +$56
- After-tax cash flow
- $1,157/yr
For passive investors: Depreciation is non-cash, so a rental often shows a tax loss while cash-flowing — sheltering income. Rental losses are passive: they offset passive income freely, and up to $25,000/yr can offset ordinary (W-2) income if you actively participate and your MAGI is under $100k (phasing out to $0 by $150k); unused losses carry forward. On sale, claimed depreciation is recaptured at up to 25%, and gains may owe capital-gains tax (a 1031 exchange can defer both). Figures are a year-1 estimate at your 24.0% rate — not tax advice; consult a CPA.
Schools (NCES district)
- District
- Rocky Ford School District No. R2
- NCES district ID
- 0806270
- Math proficiency
- 24% ▲ 2.00%
- Reading proficiency
- 36% ▼ -3.00%
- Median HH income
- $31,077
- Composite
- 24.35/100
- National rank
- #7694
- State rank
- #58 of 86 in CO
Livability — Rocky Ford
- Score
- 78/100
- State rank
- #22
- US rank
- #2671
Category grades
Schools grade is shown separately in the Schools card above.
Census & demographics
- Census place
- Rocky Ford, CO
- Population (ZIP)
- 5,590
Population outlook (Otero County) Hauer SSP2
- Today (2025)
- 17,363 people
- By 2030
- 16,776 · -3.4%
- By 2040
- 15,534 · -10.5%
- By 2050
- 14,467 · -16.7%
- By 2075
- 12,054 · -30.6%
- By 2100
- 9,392 · -45.9%
Race, ethnicity, and origin ACS 2023
- Neighborhood character
- Majority Hispanic (56%)
- Race & ethnicity
- Hispanic / Latino 56% White 40% Two or more races 22%
- Hispanic origin (detail)
- Mexican 45%
- Common ancestry
- Iranian 1% Italian 1% Slovak 1%
- Foreign-born
- 4% · Canada, South Korea
- Languages at home
- 82% English-only · Spanish 17%
Political lean MEDSL · Otero
- 2024 margin
- Strong R (+26.4) · D 35.5% · R 61.9% · Other 2.7%
- 2008→2024 swing
- -15.9pp toward R · 2008: -10.5pp · 2024: -26.4pp
- All cycles
- 2024: R+26.4 2020: R+22.5 2016: R+25.2 2012: R+9.3 2008: R+10.5
Not yet ingested
- Civics
- —
Market trends
- HPI YoY
- ▼ -72.32%
- Current HPI
- 214.2931
- Rent YoY
- —
- Metro
- —
- State GDP YoY
- ▲ 1.95%
- F500 in state
- 14
Industry mix (Fortune 500 HQ in CO)
| Industry | F500 HQs | Revenue |
|---|---|---|
| Technology Distribution | 1 | $31B |
|
||
| Food / Agriculture | 1 | $18B |
|
||
| Packaging | 1 | $14B |
|
||
| Healthcare | 1 | $13B |
|
||
| Energy | 1 | $10B |
|
||
| Technology | 1 | $4B |
|
||
Price history
+418.8% since first listed7 events — show timeline
- 2026-06-04 Listed $83,000 PARMLS
- 2021-03-11 Sold (Public Records) $40,000 Public Records
- 2021-03-05 Sold (MLS) $40,000 PARMLS
- 2020-12-16 Listed $48,000 PARMLS
- 2020-10-02 Listed $26,000 PARMLS
- 2020-10-02 Sold (MLS) $23,000 PARMLS
- 2008-05-19 Sold (Public Records) $16,000 Public Records
Property tax history
+1.9%/yrLatest (2025): $102 · +8.2% YoY. Source: county tax records.
Cash-flow waterfall
monthlySold comps — $/sqft
last 12 mo · ≤1 miLoading sold comps…