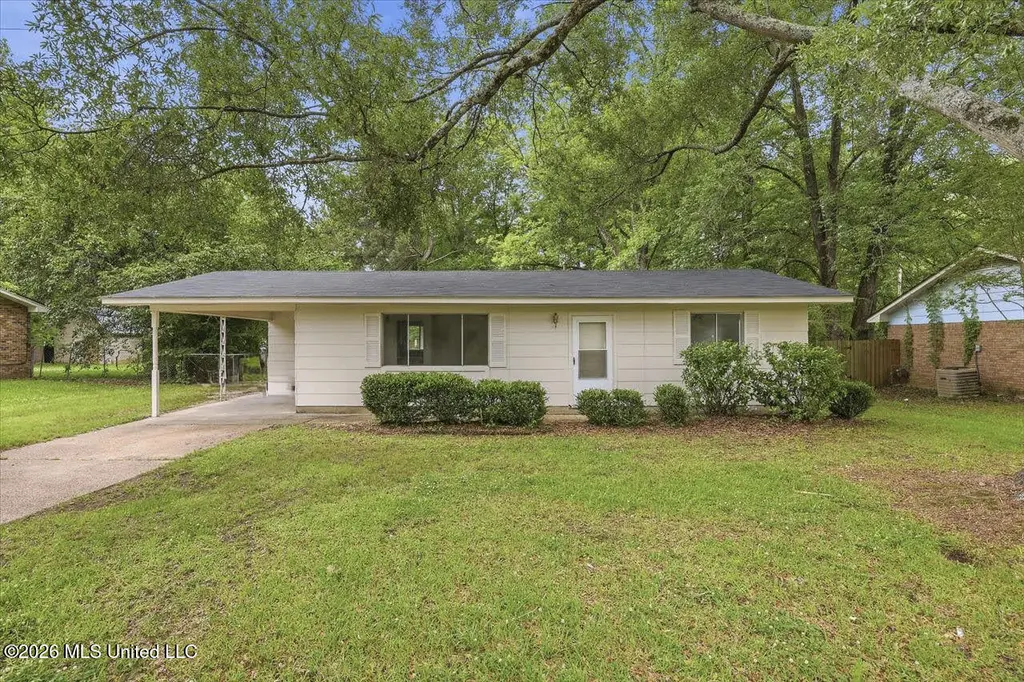
4251 Old Brandon Rd · Pearl, MS
Flood risk 5/10 · Moderate
- FEMA flood zone
- A
- Chance of flooding over 30 yrs
- 0.49%
- Est. flood insurance / yr
- $1,009 – $1,996
Fire risk 2/10 · Minimal
- Est. fire insurance / yr
- $1,241 – $2,305
Heat risk 7/10 · Major
- Hot days now (above 108°F)
- 7 days/yr
- Hot days in 30 yrs
- 20 days/yr
Wind risk 8/10 · Major
- Chance of severe wind over 30 yrs
- 80.0%
Air-quality risk 2/10 · Minimal
- Unhealthy air days now
- 0 days/yr
- Unhealthy air days in 30 yrs
- 1 days/yr
Risk factors via First Street. Map © Google.
Why this score? — see what drove the C grade
The composite is a weighted blend of 9 inputs, each scored 0–100. Each bar is that input's sub-score; the figure is the points it added to the 100-point composite (weight × sub-score).
- Cash flow +22.9/30.0
- DSCR +7.4/10.0
- ARV discount +6.6/15.0
- 1% rule +5.2/10.0
- Rent growth +4.1/5.0
- Livability +3.7/5.0
- Schools +3.6/10.0
- Condition / age +2.5/5.0
- Appreciation +0.0/10.0
$149,000
🖨 Deal sheet (PDF) 📄 Offer letter ✓ Due diligence
Listing remarks MLS
MOTIVATED SELLER ALERT!!! WHY PAY RENT WHEN YOU COULD OWN FOR LESS? Qualified buyers could pay ZERO down payment with assistance programs- Location is key! A minute away from Airport Road, check out this deal under $100K! Adorable and affordable home on an oversized lot is MOVE-IN ready with updated flooring and ceramic tile in the kitchen and bathroom! Newer roof and HVAC system as well. All 3 bedrooms are a great size. Don't miss this Pearl jewel while you are out house hunting! Call your favorite Realtor today to schedule an appointment.
Key facts
- 0.23 acre lot
- Garage
- Built 1963
Property features AI
Exterior
- Parking: Attached garage; Carport (1 space); Concrete parking
- Utilities: Public water; Public sewer; Electricity connected; Natural gas connected; Water connected
- Home design: Single family residence (house); One story; Move-in ready
- Construction: Asbestos siding; Asphalt roof; Slab foundation; Built (year per public records)
- Exterior features: Back yard fencing (chain link); Fenced lot
Interior
- Kitchen: Dishwasher; Disposal
- Flooring: Vinyl
- Bathrooms: 1 full bathroom
- Heating & cooling: Central heating (natural gas); Central air conditioning (electric); Ceiling fan(s)
- Interior features: Ceiling fan(s); Dead bolt lock(s); Storm door(s); Aluminum frame windows; Outside fireplace
- Laundry & utility: Water heater
Neighborhood map
What this means for you Summary
Snapshot
- This is a 3-bed/1.0-bath single-family listed at $149k.
Deal economics
- At list price, monthly cash flow is $138 ($2k/yr) — positive.
- The deal already cash-flows at list — no discount required.
- Meets the 1% rule at list price ($2k rent vs $149k).
- Recommended offer: $145k (3.0% below list) — sets the bar for market timing.
- Cap rate 8.4% vs local median 5.5% in Pearl — top-decile yield for the area; either an underpriced asset or a hidden risk that comps aren't pricing in. Stress-test before assuming the spread holds.
Location & tenants
- Location reads 73/100 on livability (#19 in MS) — a middle-class / working-renter tenant base. Strengths: cost of living A+, housing A+, health & safety A+; Watch: schools D+, amenities F, commute F.
- Pearl Public School District (suburban): math 44% / reading 42% proficiency, ranked #32 of 130 in MS (top 25%) — families likely to look elsewhere, expect single-tenant / working-renter base with shorter leases.
- Market conditions: Rents rising fast (+6.3%/yr); 265 active listings in the ZIP; 1 comparable units currently listed for rent nearby; 343 units permitted in Rankin County in 2024 (0 in 5+ unit buildings).
Forward outlook
- Local home prices are declining (-3.0%/yr); year-one equity from $1k of loan paydown is wiped out by about $4k of value loss. Plan a longer hold.
- Rankin County population projected at +17% by 2050 — long-run rental-demand tailwind backs the buy-and-hold thesis.
Negotiation context
- It's been on market 42 days — a 3% lower offer ($145k) is reasonable based on typical stale-listing flexibility.
- 3 sale attempts since 26y ago with the ask held roughly flat each time — persistent listings suggest the price (not the market) is what's stuck; bring a comps-based counter.
Risks & watch-outs
- Watch-outs: flood insurance adds $125/mo.
- Climate carrying-cost: in FEMA flood zone A (mandatory federal flood insurance); severe wind risk, 80% chance of damaging wind over 30y; extreme-heat days projected 7→20/yr by 2055 (HVAC capex compounding) — expect insurance premiums to compound above CPI over the hold.
Questions for the listing agent
- It's been on market 42 days. Have you received any prior offers? Is the seller open to a 3% concession, seller financing, or rate buy-down credit?
- Built in 1963 — when were the roof, HVAC, electrical panel, plumbing, and water heater last replaced?
- What's the actual annual flood-insurance premium (NFIP or private), and is the property in a SFHA with mandatory coverage?
- Is there a deadline driving the sale (1031 exchange, divorce, estate, relocation)? That informs how much negotiation room exists.
- Schools are D-rated, which usually means shorter tenancies and higher turnover. Who's the typical renter profile here, and what's been the actual vacancy rate?
- What's the average days-on-market for RENTAL listings here right now (not sales)? A rising rental-DOM trend means longer vacancies and softer asking-rent achievability than the comps imply.
- What's the recent tenant-quality profile in this submarket — average credit score on applications, eviction rate, late-payment / NSF rate, and stable-employment percentage? A property-management company in the area should have these aggregated.
- How much new for-sale + rental construction is in the pipeline within 1–3 miles? Heavy new supply typically softens prices + rents 12–24 months out; constrained supply supports both.
Investment metrics
- 1% rule
- 1.02% ✓
- Cap rate
- 8.41%
- Cash-on-cash
- 7.56%
- DSCR
- 1.34
- GRM
- 8.1
CMA / ARV
- ARV (median comp)
- $146,142
- List price
- $149,000
- Delta
- 1.96%
- Verdict
- FAIR
- Comps
- 20 within 1.0 mi
Show comp detail 12 sales within ~0.75 mi
| Address | Dist | Beds/Ba | Sqft | Sold | Price | $/sf | Match |
|---|---|---|---|---|---|---|---|
| 4325 Autry St | 0.07mi | 3/1.0 | 982 (+3%) | 16mo | $134,900 | $137 | 78 |
| 4240 Herrington Blvd | 0.24mi | 3/1.0 | 950 (0%) | 14mo | $114,900 | $121 | 77 |
| 4131 Nancy St | 0.26mi | 3/1.0 | 892 (-6%) | 2mo | $125,000 | $140 | 76 |
| 4159 Dearing St | 0.24mi | 3/1.0 | 878 (-8%) | 2mo | $125,000 | $142 | 75 |
| 4141 Shelton St | 0.33mi | 3/1.0 | 899 (-5%) | 9mo | $146,000 | $162 | 68 |
| 4137 Shelton St | 0.35mi | 3/1.0 | 910 (-4%) | 12mo | $94,900 | $104 | 67 |
| 209 Areo Dr | 0.53mi | 3/1.0 | 988 (+4%) | 3mo | $154,900 | $157 | 66 |
| 4235 Herrington Blvd | 0.25mi | 3/1.0 | 1,015 (+7%) | 16mo | $139,900 | $138 | 64 |
| 4129 Shelton St | 0.38mi | 3/1.0 | 1,000 (+5%) | 13mo | $159,999 | $160 | 63 |
| 332 Lodi Dr | 0.49mi | 3/1.0 | 1,046 (+10%) | 2mo | $174,900 | $167 | 59 |
| 241 Baugh St | 0.39mi | 3/2.0 | 1,021 (+8%) | 16mo | $165,000 | $162 | 52 |
| 234 Baugh St | 0.34mi | 3/1.0 | 1,073 (+13%) | 15mo | $42,400 | $40 | 50 |
Match score weights: distance 35% · size 25% · config 20% · recency 20%. Top-matched comps best support the ARV.
Projected returns pro-forma
-3.0% appreciation · 6.34% rent growth · sell at horizon
- IRR
- -6.3%
- Equity multiple
- 0.76×
- Total profit
- $-10,045
- Equity at exit
- $22,216
- IRR
- 7.2%
- Equity multiple
- 1.62×
- Total profit
- $25,988
- Equity at exit
- $12,883
Cash invested: $41,720 (down + closing). Projections, not guarantees.
Landlord ↔ Tenant lean methodology
- Overall (STATE)
- 90 Strongly Landlord-Friendly
- State Mississippi
- 90 Strongly Landlord-Friendly · R+11
- County
- — inherits STATE
- City
- — inherits STATE
ZIP-level market 39208
- Home prices YoY
- -20.3%
- Rents YoY
- 6.3%
- Active inventory
- 265
- Price-to-rent
- 8.1×
Monthly cashflow live
- Estimated rent
- $1,524 medium interval (Pro) →
- Mortgage (P&I)
- −$781
- Tax from tax record
- −$98 /mo · $1,176/yr
- Insurance
- −$62
- Flood insurance flood zone
- −$125 /mo · $1,502/yr
- HOA
- −$0
- Vacancy / Maint / Mgmt
- −$320
- Net cashflow
- $138
Break-even live
Sensitivity live
| Price | -10% $222 | -5% $180 | +0% $138 | +5% $95 | +10% $53 |
|---|---|---|---|---|---|
| Rent | -10% $17 | -5% $77 | +0% $138 | +5% $198 | +10% $258 |
| Rate | -1.0pp $213 | -0.5pp $175 | base $138 | +0.5pp $99 | +1.0pp $60 |
UW: 25.0% down · 7.5% · 30yr · 1.5% tax · 5.0% vac · 8.0% maint · 8.0% mgmt
Financing live
Cash to close
- Down payment
- $37,250
- Closing costs
- $4,470
- Reserves months
- —
- Total cash needed
- —
Loan-product check · same deal, 3 products live
Conventional
25% down · 7.5% · 30yr
- Down + closing
- —
- Monthly P&I
- —
- Monthly cashflow
- —
- DSCR
- —
- Eligible?
- —
Personal DTI + credit; lowest rate.
DSCR
20% down · 8.5% · 30yr
- Down + closing
- —
- Monthly P&I
- —
- Monthly cashflow
- —
- DSCR
- —
- Eligible?
- —
No personal income docs; deal must DSCR.
Hard money
10% down · 12.0% · 12mo
- Down + closing
- —
- Monthly P&I
- —
- Monthly cashflow
- —
- DSCR
- —
- Eligible?
- —
Short-term bridge; refi at stabilization.
Rent comps 1 comps
| Address | Beds | Baths | Sqft | Rent | $/sqft | DOM | Units | Dist |
|---|---|---|---|---|---|---|---|---|
| 3569 Old Brandon Rd Pearl, MS | 2.0 | 1.0 | 800 | $1,135 | $1.42 | 45d | 1 | 0.93mi |
Listing history 20 events
-
2026-06-18days on market $149,000 Active 42 DOM
-
2026-06-17days on market $149,000 Active 41 DOM
-
2026-06-16days on market $149,000 Active 40 DOM
-
2026-06-15days on market $149,000 Active 39 DOM
-
2026-06-14days on market $149,000 Active 37 DOM
-
2026-06-10days on market $149,000 Active 34 DOM
-
2026-06-09days on market $149,000 Active 33 DOM
-
2026-06-08days on market $149,000 Active 32 DOM
-
2026-06-07pricedays on market $149,000 Active 31 DOM
-
2026-06-03days on market $155,000 Active 27 DOM
-
2026-06-02days on market $155,000 Active 26 DOM
-
2026-06-01days on market $155,000 Active 25 DOM
-
2026-05-31days on market $155,000 Active 24 DOM
-
2026-05-30days on market $155,000 Active 23 DOM
-
2026-05-07$155,000 Active 576-char remark
-
2021-10-04historical
-
2019-05-29soldstatus
Show marketing remark (546 chars)
MOTIVATED SELLER ALERT!!! WHY PAY RENT WHEN YOU COULD OWN FOR LESS? Qualified buyers could pay ZERO down payment with assistance programs- Location is key! A minute away from Airport Road, check out this deal under $100K! Adorable and affordable home on an oversized lot is MOVE-IN ready with updated flooring and ceramic tile in the kitchen and bathroom! Newer roof and HVAC system as well. All 3 bedrooms are a great size. Don't miss this Pearl jewel while you are out house hunting! Call your favorite Realtor today to schedule an appointment.
-
2019-03-05$85,000
Show marketing remark (546 chars)
MOTIVATED SELLER ALERT!!! WHY PAY RENT WHEN YOU COULD OWN FOR LESS? Qualified buyers could pay ZERO down payment with assistance programs- Location is key! A minute away from Airport Road, check out this deal under $100K! Adorable and affordable home on an oversized lot is MOVE-IN ready with updated flooring and ceramic tile in the kitchen and bathroom! Newer roof and HVAC system as well. All 3 bedrooms are a great size. Don't miss this Pearl jewel while you are out house hunting! Call your favorite Realtor today to schedule an appointment.
-
2006-03-10soldstatus
-
2000-02-01$47,000
ⓘ Source: listings_history table (triggers on properties + properties_extension) + one-shot
backfill from property_details.listing_events for pre-trigger history.
Tax reassessment forecast MS · Resets to sale price
- Current annual tax
- $1,176 · $98/mo
- Projected year-2 tax
- $1,177 · $98/mo
- Expected delta
- +$1/yr ($0/mo · 0.1%)
ⓘ Screening estimate from a state-policy table — verify with the county assessor before closing.
Climate risk First Street
- Flood 5/10 Major FEMA zone A · 49% chance over 30 yrs
- Wildfire 2/10 Low
- Heat 7/10 Severe 7 d/yr ≥108°F today · 20 d/yr by 30 yrs out
- Wind 8/10 Severe 80% chance of damaging wind over 30 yrs
- Air quality 2/10 Low 0 unhealthy d/yr today · 1 by 30 yrs out
Nearby sold comps map
Loading sold comps map…
Walkable amenities ~0.75 mi
Loading nearby amenities…
Taxation est. · year 1
- Rental income
- $18,292
- − Mortgage interest
- −$8,346
- − Property taxes
- −$1,176
- − Insurance
- −$2,248
- − Repairs & maintenance
- −$1,463
- − Management
- −$1,463
- − Depreciation
- −$4,335
- Taxable loss
- −$739
- Est. tax savings @ 24.0%
- +$177
- After-tax cash flow
- $1,828/yr
For passive investors: Depreciation is non-cash, so a rental often shows a tax loss while cash-flowing — sheltering income. Rental losses are passive: they offset passive income freely, and up to $25,000/yr can offset ordinary (W-2) income if you actively participate and your MAGI is under $100k (phasing out to $0 by $150k); unused losses carry forward. On sale, claimed depreciation is recaptured at up to 25%, and gains may owe capital-gains tax (a 1031 exchange can defer both). Figures are a year-1 estimate at your 24.0% rate — not tax advice; consult a CPA.
Schools (NCES district)
- District
- Pearl Public School District
- NCES district ID
- 2803520
- Math proficiency
- 44% ▼ -9.00%
- Reading proficiency
- 42% ▼ -9.00%
- Median HH income
- $42,525
- Composite
- 36.29/100
- National rank
- #4699
- State rank
- #32 of 130 in MS
Livability — Pearl
- Score
- 73/100
- State rank
- #19
- US rank
- #5662
Category grades
Schools grade is shown separately in the Schools card above.
Census & demographics
- Census place
- Pearl, MS
- County
- Rankin County · 123,614 people
- City population
- 34,442
- Metro
- Jackson, MS
- Population (ZIP)
- 34,442
- Household income
- $65,480
- Rent vs Own
- Severe rent burden
- 1235.0
Population outlook (Rankin County) Hauer SSP2
- Today (2025)
- 164,317 people
- By 2030
- 171,013 · +4.1%
- By 2040
- 182,723 · +11.2%
- By 2050
- 192,376 · +17.1%
- By 2075
- 209,535 · +27.5%
- By 2100
- 209,534 · +27.5%
Race, ethnicity, and origin ACS 2023
- Neighborhood character
- Majority White (60%)
- Race & ethnicity
- White 60% Black 31% Hispanic / Latino 5% Two or more races 3% Asian 2%
- Common ancestry
- Italian 5% Slovak 1% Serbian 1%
- Foreign-born
- 3% · Canada, China
- Languages at home
- 93% English-only · Spanish 4% Other Indo-European 1% Other Asian/Pacific 1%
Political lean MEDSL · Rankin
- 2024 margin
- Solid R (+47.1) · D 25.9% · R 73.0% · Other 1.0%
- 2008→2024 swing
- +6.4pp toward D · 2008: -53.5pp · 2024: -47.1pp
- All cycles
- 2024: R+47.1 2020: R+45.4 2016: R+52.9 2012: R+51.9 2008: R+53.5
Not yet ingested
- Civics
- —
Market trends
- HPI YoY
- ▼ -49.11%
- Current HPI
- 193.0609
- Rent YoY
- ▲ 6.34%
- Metro
- Jackson, MS
- State GDP YoY
- —
- F500 in state
- 0
Price history
+217.0% since first listed8 events — show timeline
- 2026-06-17 Listing Removed — MLSU
- 2026-06-06 Price Changed $149,000 MLSU
- 2026-05-07 Listed $155,000 MLSU
- 2021-10-04 Listing Removed — MLSU
- 2019-05-29 Sold (MLS) — MLSU
- 2019-03-05 Listed $85,000 MLSU
- 2006-03-10 Sold (Public Records) — Public Records
- 2000-02-01 Listed $47,000 MLSU
Property tax history
+3.0%/yrLatest (2025): $1,176 · +0.0% YoY. Source: county tax records.
Cash-flow waterfall
monthlySold comps — $/sqft
last 12 mo · ≤1 miLoading sold comps…