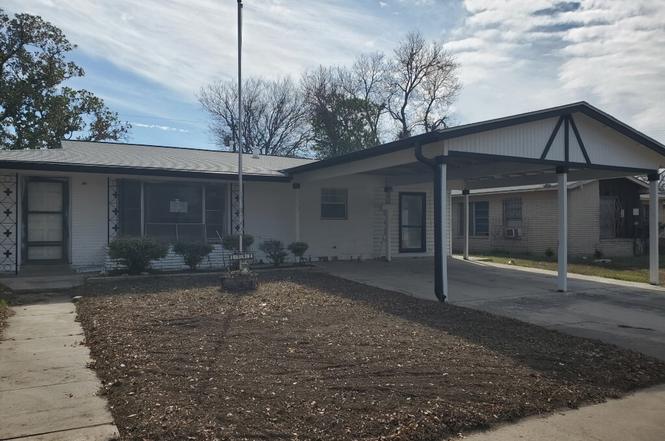
1742 Kendalia Ave · San Antonio, TX
Flood risk 1/10 · Minimal
- FEMA flood zone
- X (unshaded)
- Chance of flooding over 30 yrs
- 0.0%
- Est. flood insurance / yr
- $507 – $1,088
Fire risk 1/10 · Minimal
- Est. fire insurance / yr
- $1,222 – $2,270
Heat risk 8/10 · Major
- Hot days now (above 108°F)
- 7 days/yr
- Hot days in 30 yrs
- 22 days/yr
Wind risk 8/10 · Major
- Chance of severe wind over 30 yrs
- 80.0%
Air-quality risk 2/10 · Minimal
- Unhealthy air days now
- 1 days/yr
- Unhealthy air days in 30 yrs
- 2 days/yr
Risk factors via First Street. Map © Google.
Why this score? — see what drove the B+ grade
The composite is a weighted blend of 9 inputs, each scored 0–100. Each bar is that input's sub-score; the figure is the points it added to the 100-point composite (weight × sub-score).
- Cash flow +28.7/30.0
- 1% rule +10.0/10.0
- DSCR +10.0/10.0
- Appreciation +10.0/10.0
- ARV discount +7.5/15.0
- Livability +4.0/5.0
- Rent growth +2.7/5.0
- Condition / age +2.5/5.0
- Schools +1.4/10.0
$84,640
🖨 Deal sheet (PDF) 📄 Offer letter ✓ Due diligence
Listing remarks
Exclusive Agency Listing. All agents may advertise this property with exceptions of MLS and yard signs. HUD homes are sold "as is". HUD Case #495-956902. 2 bedrooms, 1 bath with additional space. No representation is made to information provided including taxes, sqft, schools, features, etc. Buyer must verify all information.
Key facts
- 8,015 sq ft lot
- Built 1958
- Listed 46 days
Neighborhood map
What this means for you Summary
Snapshot
- This is a 2-bed/1.0-bath single-family listed at $85k.
Deal economics
- At list price, monthly cash flow is $282 ($3k/yr) — positive.
- The deal already cash-flows at list — no discount required.
- Meets the 1% rule at list price ($1k rent vs $85k).
- Recommended offer: $82k (3.0% below list) — sets the bar for market timing.
- Cap rate 10.3% vs local median 3.8% in San Antonio — top-decile yield for the area; either an underpriced asset or a hidden risk that comps aren't pricing in. Stress-test before assuming the spread holds.
Location & tenants
- Location reads 80/100 on livability (#31 in TX, #1,616 nationally) — a professional / high-income tenant draw. Strengths: amenities A+, commute A+, cost of living A+; Watch: schools C-, crime F.
- South San Antonio ISD (urban): math 13% / reading 20% proficiency, ranked #804 of 826 in TX (top 97%) — low school quality limits family demand, transient renter base, plan for 1-2y turnover.
- Market conditions: Rents flat; 275 active listings in the ZIP; 20 comparable units currently listed for rent nearby; rentals at typical pace (median 25d on market — plan ~3-4 weeks tenant-placement turnaround); 8,308 units permitted in Bexar County in 2024 (2,506 in 5+ unit buildings).
Forward outlook
- In year one you build about $9k of equity ($585 loan paydown + $8k appreciation (10.0% local appreciation)).
- Bexar County population projected at +50% by 2050 — long-run rental-demand tailwind backs the buy-and-hold thesis.
- At projected returns (10.0% appreciation + 0.8% rent growth), your $24k cash investment doubles in ~2 years — after that, you're playing with house money.
- By year 4, paydown + projected appreciation supports a ~$32k cash-out refi (75% LTV) — recoverable capital for the next deal without selling this one.
Negotiation context
- It's been on market 46 days — a 3% lower offer ($82k) is reasonable based on typical stale-listing flexibility.
- 2 sale attempts; this cycle's ask has dropped $7k (8%) from the opening price — seller is motivated, your offer sets the floor, not the list.
Risks & watch-outs
- Watch-outs: property tax is 4.3% of price; built in 1958 — expect roof / HVAC / electrical / plumbing capex.
- Climate carrying-cost: severe wind risk, 80% chance of damaging wind over 30y; extreme-heat days projected 7→22/yr by 2055 (HVAC capex compounding) — expect insurance premiums to compound above CPI over the hold.
Questions for the listing agent
- It's been on market 46 days. Have you received any prior offers? Is the seller open to a 3% concession, seller financing, or rate buy-down credit?
- Built in 1958 — when were the roof, HVAC, electrical panel, plumbing, and water heater last replaced?
- Property tax is high relative to price — has the assessment been appealed recently, and will the sale trigger a re-assessment?
- Is there a deadline driving the sale (1031 exchange, divorce, estate, relocation)? That informs how much negotiation room exists.
- Crime grade is F in this area — have there been break-ins, vandalism, or insurance claims at this property in the last 3 years? What carrier currently insures it and at what premium?
- What's the average days-on-market for RENTAL listings here right now (not sales)? A rising rental-DOM trend means longer vacancies and softer asking-rent achievability than the comps imply.
- What's the recent tenant-quality profile in this submarket — average credit score on applications, eviction rate, late-payment / NSF rate, and stable-employment percentage? A property-management company in the area should have these aggregated.
- How much new for-sale + rental construction is in the pipeline within 1–3 miles? Heavy new supply typically softens prices + rents 12–24 months out; constrained supply supports both.
Investment metrics
- 1% rule
- 1.59% ✓
- Cap rate
- 10.29%
- Cash-on-cash
- 14.27%
- DSCR
- 1.64
- GRM
- 5.2
CMA / ARV
- ARV (on-the-fly)
- $170,507
- Comps found
- 3
Show comp detail 3 sales within ~0.75 mi
| Address | Dist | Beds/Ba | Sqft | Sold | Price | $/sf | Match |
|---|---|---|---|---|---|---|---|
| 1855 Kendalia | 0.18mi | 3/1.0 (+1) | 958 (-6%) | 12mo | $160,000 | $167 | 66 |
| 1519 Whitman Ave | 0.30mi | 3/1.0 (+1) | 1,092 (+7%) | 19mo | $110,000 | $101 | 54 |
| 238 Price Ave | 0.63mi | 3/2.0 (+1) | 1,128 (+10%) | 13mo | $275,000 | $244 | 33 |
Match score weights: distance 35% · size 25% · config 20% · recency 20%. Top-matched comps best support the ARV.
Projected returns pro-forma
10.0% appreciation · 0.83% rent growth · sell at horizon
- IRR
- 33.6%
- Equity multiple
- 3.59×
- Total profit
- $61,308
- Equity at exit
- $76,250
- IRR
- 28.1%
- Equity multiple
- 7.81×
- Total profit
- $161,358
- Equity at exit
- $164,437
Cash invested: $23,699 (down + closing). Projections, not guarantees.
Landlord ↔ Tenant lean methodology
- Overall (STATE)
- 87 Strongly Landlord-Friendly
- State Texas
- 87 Strongly Landlord-Friendly · R+5
- County
- — inherits STATE
- City
- — inherits STATE
ZIP-level market 78224
- Home prices YoY
- 12.4%
- Rents YoY
- 0.8%
- Active inventory
- 275
- Price-to-rent
- 5.2×
Monthly cashflow live
- Estimated rent
- $1,350 high interval (Pro) →
- Mortgage (P&I)
- −$444
- Tax from tax record
- −$305 /mo · $3,664/yr
- Insurance
- −$35
- HOA
- −$0
- Vacancy / Maint / Mgmt
- −$283
- Net cashflow
- $282
Break-even live
Sensitivity live
| Price | -10% $330 | -5% $306 | +0% $282 | +5% $258 | +10% $234 |
|---|---|---|---|---|---|
| Rent | -10% $175 | -5% $229 | +0% $282 | +5% $335 | +10% $388 |
| Rate | -1.0pp $324 | -0.5pp $303 | base $282 | +0.5pp $260 | +1.0pp $238 |
UW: 25.0% down · 7.5% · 30yr · 1.5% tax · 5.0% vac · 8.0% maint · 8.0% mgmt
Financing live
Cash to close
- Down payment
- $21,160
- Closing costs
- $2,539
- Reserves months
- —
- Total cash needed
- —
Loan-product check · same deal, 3 products live
Conventional
25% down · 7.5% · 30yr
- Down + closing
- —
- Monthly P&I
- —
- Monthly cashflow
- —
- DSCR
- —
- Eligible?
- —
Personal DTI + credit; lowest rate.
DSCR
20% down · 8.5% · 30yr
- Down + closing
- —
- Monthly P&I
- —
- Monthly cashflow
- —
- DSCR
- —
- Eligible?
- —
No personal income docs; deal must DSCR.
Hard money
10% down · 12.0% · 12mo
- Down + closing
- —
- Monthly P&I
- —
- Monthly cashflow
- —
- DSCR
- —
- Eligible?
- —
Short-term bridge; refi at stabilization.
Rent comps 20 comps
| Address | Beds | Baths | Sqft | Rent | $/sqft | DOM | Units | Dist |
|---|---|---|---|---|---|---|---|---|
| 1862 Kendalia Ave San Antonio, TX | 3.0 | 1.0 | 1345 | $1,350 | $1.00 | 25d | 1 | 0.20mi |
| 737 W Mayfield Blvd San Antonio, TX | 3.0 | 1.0 | 1150 | $1,462 | $1.27 | 45d | 1 | 0.36mi |
| 130 Camino de Oro San Antonio, TX | 1.0–2.0 | 1.0 | 629 | $1,060 | $1.69 | 3d | 40 | 0.63mi |
| 130 Camino de Oro San Antonio, TX | 2.0 | 1.0 | 629 | $1,690 | $2.69 | 45d | 10 | 0.63mi |
| 620 Linden Ave Unit 2 San Antonio, TX | 2.0 | 1.0 | 733 | $1,200 | $1.64 | 45d | 1 | 0.79mi |
| 422 Wagner Ave San Antonio, TX | 3.0 | 2.0 | 1220 | $1,750 | $1.43 | 45d | 1 | 0.82mi |
| 1467 W Gerald Ave San Antonio, TX | 3.0 | 2.5 | 1120 | $1,300 | $1.16 | 12d | 1 | 0.82mi |
| 151 Hopi St San Antonio, TX | 2.0 | 1.0 | 850 | $1,100 | $1.29 | 45d | 1 | 1.02mi |
| 838 King Ave San Antonio, TX | 3.0 | 2.0 | 1008 | $1,250 | $1.24 | 25d | 1 | 1.09mi |
| 2800 W Hutchins Pl Apt 710 San Antonio, TX | 2.0 | 2.0 | 771 | $991 | $1.29 | 4d | 1 | 1.11mi |
| 3632 SW Military Dr Unit 14 San Antonio, TX | 2.0 | 1.0 | 700 | $915 | $1.31 | 23d | 1 | 1.17mi |
| 3632 SW Military Dr #2 San Antonio, TX | 3.0 | 2.0 | 900 | $995 | $1.11 | 45d | 1 | 1.17mi |
| 3632 SW Military Dr #13 San Antonio, TX | 3.0 | 1.5 | 850 | $1,115 | $1.31 | 23d | 1 | 1.17mi |
| 239 Nock Ave San Antonio, TX | 3.0 | 1.0 | 1252 | $1,500 | $1.20 | 0d | 1 | 1.27mi |
| 1425 Quintana Rd Unit 1 San Antonio, TX | 3.0 | 1.5 | 1200 | $1,345 | $1.12 | 45d | 1 | 1.28mi |
| 838 McCauley Blvd San Antonio, TX | 3.0 | 2.0 | 1009 | $1,646 | $1.63 | 16d | 1 | 1.45mi |
| 518 Briggs St San Antonio, TX | 2.0 | 1.0 | 740 | $699 | $0.94 | 17d | 1 | 1.48mi |
| 518 Briggs Ave Apt 401 San Antonio, TX | 2.0 | 1.0 | 740 | $699 | $0.94 | 25d | 1 | 1.48mi |
| 1222 Brighton Ave Unit B San Antonio, TX | 3.0 | 1.0 | 725 | $999 | $1.38 | 19d | 1 | 1.49mi |
| 1222 Brighton Ave Unit B San Antonio, TX | 3.0 | 1.0 | 725 | $999 | $1.38 | 0d | 1 | 1.49mi |
Listing history 5 events
-
2026-04-24status Pending
-
2026-04-22price $84,640
-
2026-03-20status Back on Market
-
2026-02-18status Pending
-
2026-02-08$92,000 New
ⓘ Source: listings_history table (triggers on properties + properties_extension) + one-shot
backfill from property_details.listing_events for pre-trigger history.
Tax reassessment forecast TX · Resets to sale price
- Current annual tax
- $3,664 · $305/mo
- Projected year-2 tax
- $3,664 · $305/mo
- Expected delta
- $0/yr ($0/mo · -0.0%)
ⓘ Screening estimate from a state-policy table — verify with the county assessor before closing.
Climate risk First Street
- Flood 1/10 Low FEMA zone X (unshaded) · 0% chance over 30 yrs
- Wildfire 1/10 Low
- Heat 8/10 Severe 7 d/yr ≥108°F today · 22 d/yr by 30 yrs out
- Wind 8/10 Severe 80% chance of damaging wind over 30 yrs
- Air quality 2/10 Low 1 unhealthy d/yr today · 2 by 30 yrs out
Nearby sold comps map
Loading sold comps map…
Walkable amenities ~0.75 mi
Loading nearby amenities…
Taxation est. · year 1
- Rental income
- $16,197
- − Mortgage interest
- −$4,741
- − Property taxes
- −$3,664
- − Insurance
- −$423
- − Repairs & maintenance
- −$1,296
- − Management
- −$1,296
- − Depreciation
- −$2,462
- Taxable income
- $2,315
- Est. tax owed @ 24.0%
- −$556
- After-tax cash flow
- $2,827/yr
For passive investors: Depreciation is non-cash, so a rental often shows a tax loss while cash-flowing — sheltering income. Rental losses are passive: they offset passive income freely, and up to $25,000/yr can offset ordinary (W-2) income if you actively participate and your MAGI is under $100k (phasing out to $0 by $150k); unused losses carry forward. On sale, claimed depreciation is recaptured at up to 25%, and gains may owe capital-gains tax (a 1031 exchange can defer both). Figures are a year-1 estimate at your 24.0% rate — not tax advice; consult a CPA.
Schools (NCES district)
- District
- South San Antonio ISD
- NCES district ID
- 4840680
- Math proficiency
- 13% ▼ -20.00%
- Reading proficiency
- 20% ▼ -10.00%
- Median HH income
- $35,460
- Composite
- 13.6/100
- National rank
- #9511
- State rank
- #804 of 826 in TX
Livability — San Antonio
- Score
- 80/100
- State rank
- #31
- US rank
- #1616
Category grades
Schools grade is shown separately in the Schools card above.
Census & demographics
- Census place
- San Antonio, TX
- County
- Bexar County · 1,990,555 people
- City population
- 1,806,925
- Metro
- San Antonio-New Braunfels, TX
- Population (ZIP)
- 22,232
- Household income
- $59,891
- Rent vs Own
- Severe rent burden
- 721.0
Population outlook (Bexar County) Hauer SSP2
- Today (2025)
- 2,336,851 people
- By 2030
- 2,560,728 · +9.6%
- By 2040
- 3,020,569 · +29.3%
- By 2050
- 3,493,522 · +49.5%
- By 2075
- 4,668,459 · +99.8%
- By 2100
- 5,533,242 · +136.8%
Race, ethnicity, and origin ACS 2023
- Neighborhood character
- Predominantly Hispanic (90%)
- Race & ethnicity
- Hispanic / Latino 90% Two or more races 24% White 6% Native American 2% Asian 2%
- Hispanic origin (detail)
- Mexican 75%
- Common ancestry
- Italian 1%
- Foreign-born
- 18% · Canada, Vietnam, China
- Languages at home
- 44% English-only · Spanish 55% Chinese 1%
Political lean MEDSL · Bexar
- 2024 margin
- Lean D (+9.8) · D 54.3% · R 44.6% · Other 1.1%
- 2008→2024 swing
- +4.2pp toward D · 2008: 5.6pp · 2024: 9.8pp
- All cycles
- 2024: D+9.8 2020: D+18.2 2016: D+13.5 2012: D+4.6 2008: D+5.6
Not yet ingested
- Civics
- —
Market trends
- HPI YoY
- ▲ 29.95%
- Current HPI
- 272.0709
- Rent YoY
- ▲ 0.83%
- Metro
- San Antonio-New Braunfels, TX
- State GDP YoY
- ▲ 3.95%
- F500 in state
- 110
Industry mix (Fortune 500 HQ in TX)
| Industry | F500 HQs | Revenue |
|---|---|---|
| Energy | 16 | $1,198B |
|
||
| Technology | 5 | $198B |
|
||
| Engineering / Construction | 4 | $72B |
|
||
| Energy Services | 3 | $60B |
|
||
| Utilities | 3 | $41B |
|
||
| Healthcare | 2 | $330B |
|
||
Price history
-8.0% since first listed5 events — show timeline
- 2026-04-24 Pending — LERA
- 2026-04-22 Price Changed $84,640 LERA
- 2026-03-20 Relisted — LERA
- 2026-02-18 Pending — LERA
- 2026-02-08 Listed $92,000 LERA
Property tax history
+4.6%/yrLatest (2025): $3,664 · +3.6% YoY. Source: county tax records.
Cash-flow waterfall
monthlySold comps — $/sqft
last 12 mo · ≤1 miLoading sold comps…