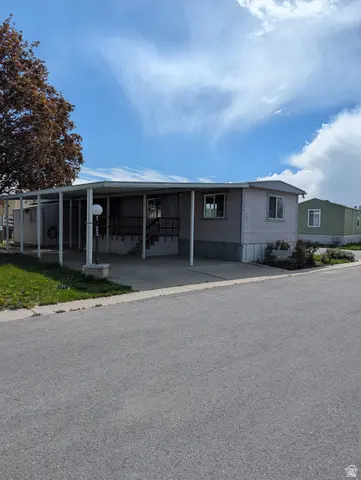
487 W 1500 N · Orem, UT
Flood risk 1/10 · Minimal
- FEMA flood zone
- X (unshaded)
- Chance of flooding over 30 yrs
- 0.0%
- Est. flood insurance / yr
- $507 – $1,088
Fire risk 2/10 · Minimal
- Est. fire insurance / yr
- $453 – $841
Heat risk 4/10 · Minor
- Hot days now (above 94°F)
- 8 days/yr
- Hot days in 30 yrs
- 22 days/yr
Wind risk 1/10 · Minimal
- Chance of severe wind over 30 yrs
- —
Air-quality risk 4/10 · Minor
- Unhealthy air days now
- 4 days/yr
- Unhealthy air days in 30 yrs
- 5 days/yr
Risk factors via First Street. Map © Google.
Why this score? — see what drove the B grade
The composite is a weighted blend of 9 inputs, each scored 0–100. Each bar is that input's sub-score; the figure is the points it added to the 100-point composite (weight × sub-score).
- Cash flow +30.0/30.0
- DSCR +10.0/10.0
- 1% rule +9.2/10.0
- ARV discount +7.5/15.0
- Livability +4.3/5.0
- Schools +4.2/10.0
- Condition / age +4.0/5.0
- Rent growth +3.7/5.0
- Appreciation +0.0/10.0
$94,900
🖨 Deal sheet 📄 Offer letter ✓ Due diligence
Listing remarks MLS
There are no remarks available.
Key facts
- Convenient access
- Lots of updates
- Corner lot
Tags
Property features AI
Finance
- Other: $240 annual tax amount
Exterior
- Parking: Total of 5 parking spaces; 2 covered/carport spaces; 3 open parking spaces; Covered parking
- Utilities: Electricity available
- Home design: Mobile home; Built and currently standing
- Construction: Built/standing condition
- Exterior features: Residential property; Lot dimensions listed (0.0 x 0.0 x 0.0); Subdivision: CHARMAN MANOR
Interior
- Kitchen: Portable dishwasher; Refrigerator
- Bedrooms: 2 bedrooms on the main level; Primary bedroom on the 1st floor
- Bathrooms: 1 full bathroom
- Heating & cooling: Evaporative cooling
- Interior features: Blinds; Storage shed(s); Window coverings
- Laundry & utility: Washer; Dryer
Neighborhood map
What this means for you Summary
Snapshot
- This is a 2-bed/1.0-bath manufactured listed at $95k. Condition is rated good.
Deal economics
- At list price, monthly cash flow is $411 ($5k/yr) — positive.
- The deal already cash-flows at list — no discount required.
- Meets the 1% rule at list price ($1k rent vs $95k).
- Recommended offer: $89k (6.0% below list) — sets the bar for market timing.
Location & tenants
- Location reads 86/100 on livability (#10 in UT, #389 nationally) — a professional / high-income tenant draw. Strengths: amenities A+, commute A+, housing A+.
- Alpine District (suburban): math 45% / reading 50% proficiency, ranked #25 of 80 in UT (top 31%) — families likely to look elsewhere, expect single-tenant / working-renter base with shorter leases; only 18% free/reduced lunch — higher-income household profile.
- Zoned schools: Bonneville School (math 31% / reading 41%, grade F, #375 of 585 statewide, top 65%, 566 students, 48% FRL); Orem Jr High (math 24% / reading 34%, grade F, #112 of 138 statewide, top 81%, 961 students, 41% FRL); Timpanogos High (math 38% / reading 55%, grade D-, #38 of 171 statewide, top 24%, 1,365 students, 24% FRL) — zoned schools average 38% FRL vs 18% district-wide (20 pts higher); higher-poverty schools than district average — tighter screening recommended.
- Market conditions: Rents rising fast (+4.9%/yr); 143 active listings in the ZIP; 4 comparable units currently listed for rent nearby; rentals at typical pace (median 24d on market — plan ~3-4 weeks tenant-placement turnaround); solid renter incomes; 6,326 units permitted in Utah County in 2024 (1,053 in 5+ unit buildings).
Forward outlook
- Local home prices are declining (-3.0%/yr); year-one equity from $656 of loan paydown is wiped out by about $3k of value loss. Plan a longer hold.
- Utah County population projected at +49% by 2050 — long-run rental-demand tailwind backs the buy-and-hold thesis.
- At projected returns (-3.0% appreciation + 4.9% rent growth), your $27k cash investment doubles in ~6 years — after that, you're playing with house money.
Negotiation context
- It's been on market 63 days — a 6% lower offer ($89k) is reasonable based on typical stale-listing flexibility.
- 2 sale attempts since 5y ago with the ask held roughly flat each time — persistent listings suggest the price (not the market) is what's stuck; bring a comps-based counter.
Questions for the listing agent
- It's been on market 63 days. Have you received any prior offers? Is the seller open to a 6% concession, seller financing, or rate buy-down credit?
- Why hasn't it sold? Are there any deal-killer items the seller is aware of (foundation, flood, title, zoning, code violations)?
- Is there a deadline driving the sale (1031 exchange, divorce, estate, relocation)? That informs how much negotiation room exists.
- Schools are B-rated — typically a magnet for longer-tenancy family renters. What's the average tenant stay here, and is there a school-zone premium baked into asking?
- What's the average days-on-market for RENTAL listings here right now (not sales)? A rising rental-DOM trend means longer vacancies and softer asking-rent achievability than the comps imply.
- What's the recent tenant-quality profile in this submarket — average credit score on applications, eviction rate, late-payment / NSF rate, and stable-employment percentage? A property-management company in the area should have these aggregated.
- How much new for-sale + rental construction is in the pipeline within 1–3 miles? Heavy new supply typically softens prices + rents 12–24 months out; constrained supply supports both.
Investment metrics
- 1% rule
- 1.42% ✓
- Cap rate
- 11.49%
- Cash-on-cash
- 18.57%
- DSCR
- 1.83
- GRM
- 5.9
CMA / ARV
No comps found within radius.
Projected returns pro-forma
-3.0% appreciation · 4.92% rent growth · sell at horizon
- IRR
- 12.5%
- Equity multiple
- 1.51×
- Total profit
- $13,493
- Equity at exit
- $14,150
- IRR
- 22.9%
- Equity multiple
- 3.14×
- Total profit
- $56,906
- Equity at exit
- $8,205
Cash invested: $26,572 (down + closing). Projections, not guarantees.
Landlord ↔ Tenant lean methodology
- Overall (STATE)
- 86 Strongly Landlord-Friendly
- State Utah
- 86 Strongly Landlord-Friendly · R+15
- County
- — inherits STATE
- City
- — inherits STATE
ZIP-level market 84057
- Rents YoY
- 4.9%
- Active inventory
- 143
- Price-to-rent
- 5.9×
Monthly cashflow live
- Estimated rent
- $1,351 medium interval (Pro) →
- Mortgage (P&I)
- −$498
- Tax est. 1.5%
- −$119 /mo · $1,424/yr
- Insurance
- −$40
- HOA
- −$0
- Vacancy / Maint / Mgmt
- −$284
- Net cashflow
- $411
Break-even live
UW: 25.0% down · 7.5% · 30yr · 1.5% tax · 5.0% vac · 8.0% maint · 8.0% mgmt
Financing live
Cash to close
- Down payment
- $23,725
- Closing costs
- $2,847
- Reserves months
- —
- Total cash needed
- —
Loan-product check · same deal, 3 products live
Conventional
25% down · 7.5% · 30yr
- Down + closing
- —
- Monthly P&I
- —
- Monthly cashflow
- —
- DSCR
- —
- Eligible?
- —
Personal DTI + credit; lowest rate.
DSCR
20% down · 8.5% · 30yr
- Down + closing
- —
- Monthly P&I
- —
- Monthly cashflow
- —
- DSCR
- —
- Eligible?
- —
No personal income docs; deal must DSCR.
Hard money
10% down · 12.0% · 12mo
- Down + closing
- —
- Monthly P&I
- —
- Monthly cashflow
- —
- DSCR
- —
- Eligible?
- —
Short-term bridge; refi at stabilization.
Rent comps 4 comps
| Address | Beds | Baths | Sqft | Rent | $/sqft | DOM | Units | Dist |
|---|---|---|---|---|---|---|---|---|
| 140 W 1200 North St Unit 142 Orem, UT | 1.0 | 1.0 | 500 | $1,295 | $2.59 | 14d | 1 | 0.54mi |
| 1098 N 150 W Orem, UT | 2.0 | 1.0 | 735 | $1,150 | $1.56 | 23d | 1 | 0.61mi |
| 1063 N 100 W Unit 1 Orem, UT | 2.0 | 1.0 | 700 | $1,349 | $1.93 | 2d | 1 | 0.70mi |
| 605 N Main St Unit 1 Orem, UT | 1.0 | 1.0 | 750 | $1,200 | $1.60 | 23d | 1 | 1.24mi |
Listing history 19 events
-
2026-06-18days on market $94,900 Active 63 DOM
-
2026-06-17days on market $94,900 Active 62 DOM
-
2026-06-16days on market $94,900 Active 61 DOM
-
2026-06-15days on market $94,900 Active 60 DOM
-
2026-06-14days on market $94,900 Active 58 DOM
-
2026-06-13days on market $94,900 Active 57 DOM
-
2026-06-10days on market $94,900 Active 55 DOM
-
2026-06-09days on market $94,900 Active 54 DOM
-
2026-06-08days on market $94,900 Active 53 DOM
-
2026-06-07days on market $94,900 Active 52 DOM
-
2026-06-03days on market $94,900 Active 48 DOM
-
2026-06-03days on market $94,900 Active 47 DOM
-
2026-06-01days on market $94,900 Active 46 DOM
-
2026-05-31days on market $94,900 Active 45 DOM
-
2026-05-31days on market $94,900 Active 44 DOM
-
2026-05-18price $94,900
-
2026-04-16$99,000 Active
-
2021-10-17status Under Contract 31-char remark
Show marketing remark (31 chars)
There are no remarks available.
-
2021-09-13$62,500 Active 31-char remark
Show marketing remark (31 chars)
There are no remarks available.
ⓘ Source: listings_history table (triggers on properties + properties_extension) + one-shot
backfill from property_details.listing_events for pre-trigger history.
Climate risk First Street
- Flood 1/10 Low FEMA zone X (unshaded) · 0% chance over 30 yrs
- Wildfire 2/10 Low
- Heat 4/10 Moderate 8 d/yr ≥94°F today · 22 d/yr by 30 yrs out
- Wind 1/10 Low
- Air quality 4/10 Moderate 4 unhealthy d/yr today · 5 by 30 yrs out
Nearby sold comps map
Loading sold comps map…
Walkable amenities ~0.75 mi
Loading nearby amenities…
Taxation est. · year 1
- Rental income
- $16,208
- − Mortgage interest
- −$5,316
- − Property taxes
- −$1,424
- − Insurance
- −$474
- − Repairs & maintenance
- −$1,297
- − Management
- −$1,297
- − Depreciation
- −$2,761
- Taxable income
- $3,640
- Est. tax owed @ 24.0%
- −$874
- After-tax cash flow
- $4,061/yr
For passive investors: Depreciation is non-cash, so a rental often shows a tax loss while cash-flowing — sheltering income. Rental losses are passive: they offset passive income freely, and up to $25,000/yr can offset ordinary (W-2) income if you actively participate and your MAGI is under $100k (phasing out to $0 by $150k); unused losses carry forward. On sale, claimed depreciation is recaptured at up to 25%, and gains may owe capital-gains tax (a 1031 exchange can defer both). Figures are a year-1 estimate at your 24.0% rate — not tax advice; consult a CPA.
Condition & rehab AI · 13 photos
This mobile home is in good condition with recent updates, making it move-in ready for both resale and rental.
Value-add opportunities
- Both paint — Fresh paint enhances curb appeal and interior aesthetics
- Both landscaping — Well-maintained landscaping improves curb appeal and adds value
Renovation cost estimate screening
Value-add ROI direction
- Both paint — Fresh paint enhances curb appeal and interior aesthetics ↑
- Both landscaping — Well-maintained landscaping improves curb appeal and adds value ↑
ⓘ Cost ranges are severity-bucket heuristics (US national rule-of-thumb). Get contractor quotes + a written scope before underwriting a rehab budget.
Schools (NCES district)
- District
- Alpine District
- NCES district ID
- 4900030
- Math proficiency
- 45% ▼ -4.00%
- Reading proficiency
- 50% ▼ -2.00%
- Median HH income
- $68,595
- Composite
- 42.48/100
- National rank
- #3213
- State rank
- #25 of 80 in UT
Livability — Orem
- Score
- 86/100
- State rank
- #10
- US rank
- #389
Category grades
Schools grade is shown separately in the Schools card above.
Census & demographics
- Census place
- Orem, UT
- County
- Utah County · 661,754 people
- City population
- 94,197
- Metro
- Provo-Orem, UT
- Population (ZIP)
- 36,881
- Household income
- $82,780
- Rent vs Own
- Severe rent burden
- 676.0
Population outlook (Utah County) Hauer SSP2
- Today (2025)
- 693,420 people
- By 2030
- 757,324 · +9.2%
- By 2040
- 893,178 · +28.8%
- By 2050
- 1,035,842 · +49.4%
- By 2075
- 1,376,733 · +98.5%
- By 2100
- 1,609,388 · +132.1%
Race, ethnicity, and origin ACS 2023
- Neighborhood character
- Predominantly White (66%)
- Race & ethnicity
- White 66% Hispanic / Latino 25% Two or more races 13% Asian 2% Pacific Islander 1%
- Hispanic origin (detail)
- Mexican 17% Salvadoran 1%
- Common ancestry
- Italian 5% Slovak 4% Portuguese 2%
- Foreign-born
- 13% · Canada, Dominican Republic, China
- Languages at home
- 75% English-only · Spanish 19% Other Indo-European 2% Other Asian/Pacific 1%
Political lean MEDSL · Utah
- 2024 margin
- Solid R (+39.8) · D 28.5% · R 68.3% · Other 3.2%
- 2008→2024 swing
- +19.1pp toward D · 2008: -58.9pp · 2024: -39.8pp
- All cycles
- 2024: R+39.8 2020: R+41.0 2016: R+37.3 2012: R+78.5 2008: R+58.9
Not yet ingested
- Civics
- —
Market trends
- HPI YoY
- ▼ -365.90%
- Current HPI
- 319.4849
- Rent YoY
- ▲ 4.92%
- Metro
- Provo-Orem, UT
- State GDP YoY
- ▲ 3.54%
- F500 in state
- 2
Industry mix (Fortune 500 HQ in UT)
| Industry | F500 HQs | Revenue |
|---|---|---|
| Financial Services | 1 | $3B |
|
||
Price history
+51.8% since first listed4 events — show timeline
- 2026-05-18 Price Changed $94,900 WFRMLS
- 2026-04-16 Listed $99,000 WFRMLS
- 2021-10-17 Pending — WFRMLS
- 2021-09-13 Listed $62,500 WFRMLS
Cash-flow waterfall
monthlySold comps — $/sqft
last 12 mo · ≤1 miLoading sold comps…