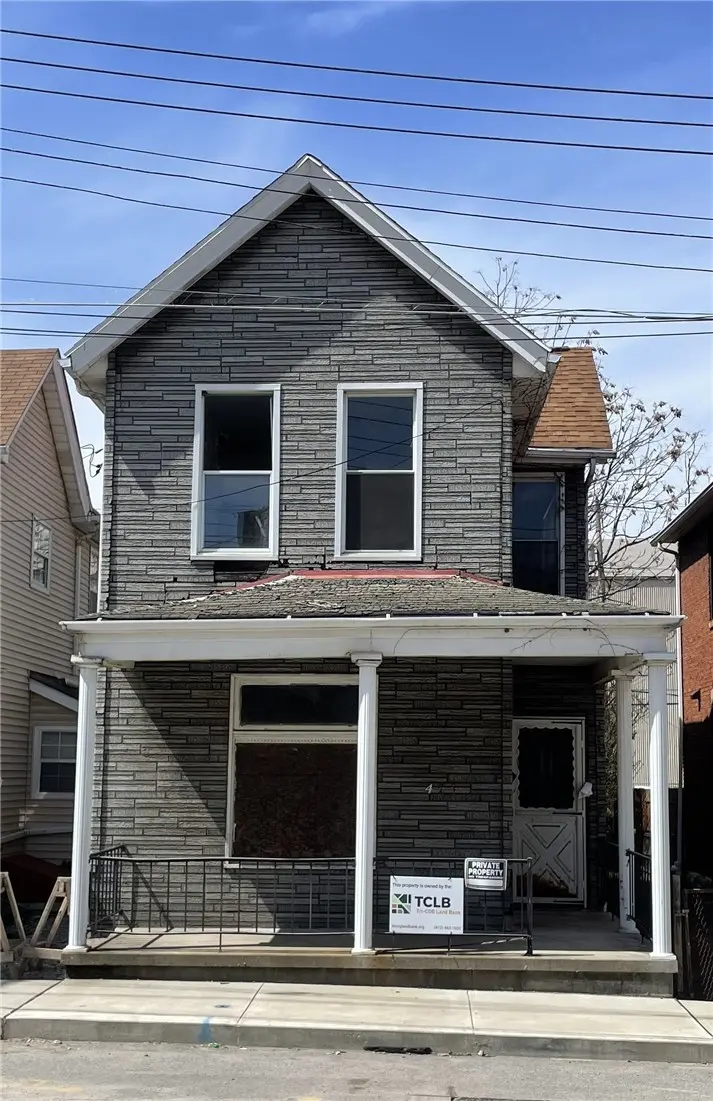
473 New 8th Ave · West Homestead, PA
Flood risk 7/10 · Major
- FEMA flood zone
- X (unshaded)
- Chance of flooding over 30 yrs
- 0.76%
- Est. flood insurance / yr
- $507 – $1,088
Fire risk 2/10 · Minimal
- Est. fire insurance / yr
- $511 – $949
Heat risk 4/10 · Minor
- Hot days now (above 97°F)
- 7 days/yr
- Hot days in 30 yrs
- 19 days/yr
Wind risk 2/10 · Minimal
- Chance of severe wind over 30 yrs
- —
Air-quality risk 4/10 · Minor
- Unhealthy air days now
- 4 days/yr
- Unhealthy air days in 30 yrs
- 5 days/yr
Risk factors via First Street. Map © Google.
Why this score? — see what drove the D+ grade
The composite is a weighted blend of 9 inputs, each scored 0–100. Each bar is that input's sub-score; the figure is the points it added to the 100-point composite (weight × sub-score).
- Cash flow +15.0/30.0
- ARV discount +7.5/15.0
- 1% rule +5.0/10.0
- DSCR +5.0/10.0
- Livability +3.9/5.0
- Rent growth +3.5/5.0
- Schools +3.1/10.0
- Condition / age +2.5/5.0
- Appreciation +0.0/10.0
$18,500
🖨 Deal sheet (PDF) 📄 Offer letter ✓ Due diligence
Listing remarks MLS
This 3 bedroom, 1 bath, 1,398 square foot home is being sold as is. The property features a fenced-in yard and covered front porch. This property will need a full renovation.
Key facts
- Covered front porch
- Full renovation
- Fenced-in yard
Tags
Property features AI
Exterior
- Utilities: Public water; Public sewer
- Home design: 2-story frame house; Resale property
- Construction: Frame construction
- Exterior features: Public transportation nearby
Interior
- Bathrooms: 1 full bathroom
- Interior features: Unfinished basement
Neighborhood map
What this means for you Summary
Snapshot
- This is a 3-bed/1.0-bath single-family listed at $18k.
Deal economics
- At list price, monthly cash flow is $950 ($11k/yr) — positive.
- The deal already cash-flows at list — no discount required.
- Meets the 1% rule at list price ($1k rent vs $18k).
- Recommended offer: $18k (3.0% below list) — sets the bar for market timing.
Location & tenants
- Location reads 77/100 on livability (#353 in PA, #3,104 nationally) — a middle-class / working-renter tenant base. Strengths: commute A+, cost of living A+, housing A+; Watch: employment C-, crime F, amenities F.
- Steel Valley SD (suburban): math 29% / reading 45% proficiency, ranked #403 of 539 in PA (top 75%) — families likely to look elsewhere, expect single-tenant / working-renter base with shorter leases.
- Zoned schools: Steel Valley Ms (math 17% / reading 38%, grade F, #399 of 512 statewide, top 79%, 404 students, 100% FRL); Steel Valley Shs (math 57%, 400 students, 88% FRL) — zoned schools average 94% FRL vs 57% district-wide (37 pts higher); higher-poverty schools than district average — tighter screening recommended.
- Market conditions: Rents rising fast (+4.1%/yr); 93 active listings in the ZIP; 11 comparable units currently listed for rent nearby; rentals at typical pace (median 26d on market — plan ~3-4 weeks tenant-placement turnaround); 2,996 units permitted in Allegheny County in 2024 (1,588 in 5+ unit buildings).
- This rent runs 31% of the median local income ($56k/yr) — at the standard rent-burdened threshold; future hikes will face affordability resistance.
Forward outlook
- Local home prices are declining (-3.0%/yr); year-one equity from $128 of loan paydown is wiped out by about $555 of value loss. Plan a longer hold.
- At projected returns (-3.0% appreciation + 4.1% rent growth), your $5k cash investment doubles in ~1 year — after that, you're playing with house money.
Negotiation context
- It's been on market 41 days — a 3% lower offer ($18k) is reasonable based on typical stale-listing flexibility.
- 2 sale attempts; this cycle's ask has dropped $6k (26%) from the opening price — seller is motivated, your offer sets the floor, not the list.
Risks & watch-outs
- Watch-outs: flood insurance adds $66/mo; built in 1915 — expect roof / HVAC / electrical / plumbing capex.
- Climate carrying-cost: major flood risk — expect insurance premiums to compound above CPI over the hold.
Questions for the listing agent
- It's been on market 41 days. Have you received any prior offers? Is the seller open to a 3% concession, seller financing, or rate buy-down credit?
- Built in 1915 — when were the roof, HVAC, electrical panel, plumbing, and water heater last replaced?
- What's the actual annual flood-insurance premium (NFIP or private), and is the property in a SFHA with mandatory coverage?
- Is there a deadline driving the sale (1031 exchange, divorce, estate, relocation)? That informs how much negotiation room exists.
- Schools are B-rated — typically a magnet for longer-tenancy family renters. What's the average tenant stay here, and is there a school-zone premium baked into asking?
- Crime grade is F in this area — have there been break-ins, vandalism, or insurance claims at this property in the last 3 years? What carrier currently insures it and at what premium?
- The area grade is low — what's the realistic commute time and amenity access for the typical tenant pool here? Any planned neighborhood developments (good or bad) we should know about?
- What's the average days-on-market for RENTAL listings here right now (not sales)? A rising rental-DOM trend means longer vacancies and softer asking-rent achievability than the comps imply.
- What's the recent tenant-quality profile in this submarket — average credit score on applications, eviction rate, late-payment / NSF rate, and stable-employment percentage? A property-management company in the area should have these aggregated.
- How much new for-sale + rental construction is in the pipeline within 1–3 miles? Heavy new supply typically softens prices + rents 12–24 months out; constrained supply supports both.
Investment metrics
- 1% rule
- 7.83% ✓
- Cap rate
- 72.20%
- Cash-on-cash
- 235.37%
- DSCR
- 11.47
- GRM
- 1.1
CMA / ARV
- ARV (median comp)
- $90,143
- List price
- $18,500
- Delta
- -79.48%
- Verdict
- UNDERPRICED
- Comps
- 20 within 1.0 mi
Show comp detail 9 sales within ~0.75 mi
| Address | Dist | Beds/Ba | Sqft | Sold | Price | $/sf | Match |
|---|---|---|---|---|---|---|---|
| 139 W 16th Ave | 0.58mi | 3/1.0 | 1,384 (+3%) | 7mo | $75,000 | $54 | 63 |
| 230 E 15th Ave | 0.74mi | 3/1.0 | 1,417 (+5%) | 2mo | $25,000 | $18 | 55 |
| 574 Doyle Ave | 0.24mi | 2/1.0 (-1) | 1,472 (+9%) | 17mo | $148,900 | $101 | 54 |
| 800 Doyle Ave | 0.50mi | 3/1.5 | 1,378 (+2%) | 23mo | $65,000 | $47 | 52 |
| 3607 Fieldstone Dr | 0.53mi | 3/2.0 | 1,464 (+9%) | 10mo | $275,555 | $188 | 48 |
| 366 W 13th Ave | 0.35mi | 2/1.0 (-1) | 1,168 (-13%) | 10mo | $70,000 | $60 | 48 |
| 1513 West St | 0.64mi | 4/1.0 (+1) | 1,400 (+4%) | 20mo | $37,000 | $26 | 42 |
| 243 W Hazel Way | 0.29mi | 2/1.0 (-1) | 1,156 (-14%) | 22mo | $17,075 | $15 | 39 |
| 227 E 15th Ave | 0.72mi | 2/2.0 (-1) | 1,490 (+10%) | 6mo | $55,000 | $37 | 35 |
Match score weights: distance 35% · size 25% · config 20% · recency 20%. Top-matched comps best support the ARV.
Projected returns pro-forma
-3.0% appreciation · 4.06% rent growth · sell at horizon
- IRR
- —
- Equity multiple
- 12.41×
- Total profit
- $59,103
- Equity at exit
- $2,758
- IRR
- —
- Equity multiple
- 27.28×
- Total profit
- $136,138
- Equity at exit
- $1,600
Cash invested: $5,180 (down + closing). Projections, not guarantees.
Landlord ↔ Tenant lean methodology
- Overall (STATE)
- 62 Landlord-Friendly
- State Pennsylvania
- 62 Landlord-Friendly · EVEN
- County
- — inherits STATE
- City
- — inherits STATE
ZIP-level market 15120
- Home prices YoY
- -16.9%
- Rents YoY
- 4.1%
- Active inventory
- 93
- Price-to-rent
- 1.1×
Monthly cashflow live
- Estimated rent
- $1,448 high interval (Pro) →
- Mortgage (P&I)
- −$97
- Tax est. 1.5%
- −$23 /mo · $278/yr
- Insurance
- −$8
- Flood insurance flood zone
- −$66 /mo · $798/yr
- HOA
- −$0
- Vacancy / Maint / Mgmt
- −$304
- Net cashflow
- $950
Break-even live
Sensitivity live
| Price | -10% $962 | -5% $956 | +0% $950 | +5% $943 | +10% $937 |
|---|---|---|---|---|---|
| Rent | -10% $835 | -5% $892 | +0% $950 | +5% $1,007 | +10% $1,064 |
| Rate | -1.0pp $959 | -0.5pp $954 | base $950 | +0.5pp $945 | +1.0pp $940 |
UW: 25.0% down · 7.5% · 30yr · 1.5% tax · 5.0% vac · 8.0% maint · 8.0% mgmt
Financing live
Cash to close
- Down payment
- $4,625
- Closing costs
- $555
- Reserves months
- —
- Total cash needed
- —
Loan-product check · same deal, 3 products live
Conventional
25% down · 7.5% · 30yr
- Down + closing
- —
- Monthly P&I
- —
- Monthly cashflow
- —
- DSCR
- —
- Eligible?
- —
Personal DTI + credit; lowest rate.
DSCR
20% down · 8.5% · 30yr
- Down + closing
- —
- Monthly P&I
- —
- Monthly cashflow
- —
- DSCR
- —
- Eligible?
- —
No personal income docs; deal must DSCR.
Hard money
10% down · 12.0% · 12mo
- Down + closing
- —
- Monthly P&I
- —
- Monthly cashflow
- —
- DSCR
- —
- Eligible?
- —
Short-term bridge; refi at stabilization.
Rent comps 11 comps
| Address | Beds | Baths | Sqft | Rent | $/sqft | DOM | Units | Dist |
|---|---|---|---|---|---|---|---|---|
| 300 W 13th Ave Homestead, PA | 2.0 | 1.0 | 1088 | $1,125 | $1.03 | 18d | 1 | 0.42mi |
| 300 W 13th Ave Unit 302 Homestead, PA | 2.0 | 1.0 | 1088 | $1,150 | $1.06 | 18d | 1 | 0.42mi |
| 1254 Edgewood Dr Homestead, PA | 3.0 | 1.0 | 1144 | $1,725 | $1.51 | 45d | 1 | 0.59mi |
| 623 E 18th Ave Homestead, PA | 2.0 | 1.0 | 1156 | $1,600 | $1.38 | 45d | 1 | 0.95mi |
| 621 E 9th Ave Homestead, PA | 2.0 | 2.0 | 1400 | $1,425 | $1.02 | 25d | 1 | 0.99mi |
| 3305 W Run Rd Munhall, PA | 2.0 | 1.0 | 1100 | $1,365 | $1.24 | 25d | 1 | 1.02mi |
| 218 Mary St Homestead, PA | 3.0 | 1.0 | 1776 | $1,400 | $0.79 | 23d | 1 | 1.26mi |
| 308 Lea St Homestead, PA | 4.0 | 2.0 | 1480 | $1,490 | $1.01 | 5d | 1 | 1.36mi |
| 214 Vine St Homestead, PA | 2.0 | 1.0 | 1034 | $1,150 | $1.11 | 45d | 1 | 1.37mi |
| 3705 Botsford St Apt 2 Munhall, PA | 3.0 | 1.0 | 1000 | $1,195 | $1.20 | 45d | 1 | 1.38mi |
| 931 Hilltop St Homestead, PA | 3.0 | 1.5 | 1312 | $1,500 | $1.14 | 16d | 1 | 1.39mi |
Listing history 19 events
-
2026-06-21days on market $18,500 Active 41 DOM
-
2026-06-18days on market $18,500 Active 38 DOM
-
2026-06-17price $18,500 Active 37 DOM
-
2026-06-17days on market $25,000 Active 37 DOM
-
2026-06-16days on market $25,000 Active 36 DOM
-
2026-06-15days on market $25,000 Active 35 DOM
-
2026-06-13days on market $25,000 Active 33 DOM
-
2026-06-09days on market $25,000 Active 29 DOM
-
2026-06-08days on market $25,000 Active 28 DOM
-
2026-06-07days on market $25,000 Active 27 DOM
-
2026-06-05days on market $25,000 Active 24 DOM
-
2026-06-03days on market $25,000 Active 23 DOM
-
2026-06-02days on market $25,000 Active 22 DOM
-
2026-06-01days on market $25,000 Active 21 DOM
-
2026-05-31days on market $25,000 Active 20 DOM
-
2026-05-11$25,000 Active 174-char remark
-
2025-12-18price $25,000 174-char remark
Show marketing remark (174 chars)
This 3 bedroom, 1 bath, 1,398 square foot home is being sold as is. The property features a fenced-in yard and covered front porch. This property will need a full renovation.
-
2025-09-21price $30,000 174-char remark
Show marketing remark (174 chars)
This 3 bedroom, 1 bath, 1,398 square foot home is being sold as is. The property features a fenced-in yard and covered front porch. This property will need a full renovation.
-
2025-05-16$37,000 Active 174-char remark
Show marketing remark (174 chars)
This 3 bedroom, 1 bath, 1,398 square foot home is being sold as is. The property features a fenced-in yard and covered front porch. This property will need a full renovation.
ⓘ Source: listings_history table (triggers on properties + properties_extension) + one-shot
backfill from property_details.listing_events for pre-trigger history.
Climate risk First Street
- Flood 7/10 Severe FEMA zone X (unshaded) · 76% chance over 30 yrs
- Wildfire 2/10 Low
- Heat 4/10 Moderate 7 d/yr ≥97°F today · 19 d/yr by 30 yrs out
- Wind 2/10 Low
- Air quality 4/10 Moderate 4 unhealthy d/yr today · 5 by 30 yrs out
Nearby sold comps map
Loading sold comps map…
Walkable amenities ~0.75 mi
Loading nearby amenities…
Taxation est. · year 1
- Rental income
- $17,375
- − Mortgage interest
- −$1,036
- − Property taxes
- −$278
- − Insurance
- −$890
- − Repairs & maintenance
- −$1,390
- − Management
- −$1,390
- − Depreciation
- −$538
- Taxable income
- $11,853
- Est. tax owed @ 24.0%
- −$2,845
- After-tax cash flow
- $8,550/yr
For passive investors: Depreciation is non-cash, so a rental often shows a tax loss while cash-flowing — sheltering income. Rental losses are passive: they offset passive income freely, and up to $25,000/yr can offset ordinary (W-2) income if you actively participate and your MAGI is under $100k (phasing out to $0 by $150k); unused losses carry forward. On sale, claimed depreciation is recaptured at up to 25%, and gains may owe capital-gains tax (a 1031 exchange can defer both). Figures are a year-1 estimate at your 24.0% rate — not tax advice; consult a CPA.
Schools (NCES district)
- District
- Steel Valley SD
- NCES district ID
- 4222790
- Math proficiency
- 29% ▼ -1.00%
- Reading proficiency
- 45% ▼ -4.00%
- Median HH income
- $39,505
- Composite
- 30.94/100
- National rank
- #6111
- State rank
- #403 of 539 in PA
Livability — West Homestead
- Score
- 77/100
- State rank
- #353
- US rank
- #3104
Category grades
Schools grade is shown separately in the Schools card above.
Census & demographics
- Census place
- West Homestead, PA
- County
- Allegheny County · 1,022,028 people
- Metro
- Pittsburgh, PA
- Population (ZIP)
- 18,029
- Household income
- $55,714
- Rent vs Own
- Severe rent burden
- 669.0
Population outlook (Allegheny County) Hauer SSP2
- Today (2025)
- 1,250,282 people
- By 2030
- 1,256,482 · +0.5%
- By 2040
- 1,256,318 · +0.5%
- By 2050
- 1,244,169 · -0.5%
- By 2075
- 1,197,693 · -4.2%
- By 2100
- 1,093,187 · -12.6%
Race, ethnicity, and origin ACS 2023
- Neighborhood character
- Predominantly White (74%)
- Race & ethnicity
- White 74% Black 20% Two or more races 4% Hispanic / Latino 2%
- Common ancestry
- Romanian 6% Lithuanian 1% Scotch-Irish 1%
- Foreign-born
- 3% · South Korea, Canada
- Languages at home
- 95% English-only · Spanish 3% Russian/Polish/Slavic 1%
Political lean MEDSL · Allegheny
- 2024 margin
- Strong D (+20.3) · D 59.7% · R 39.4%
- 2008→2024 swing
- +4.8pp toward D · 2008: 15.5pp · 2024: 20.3pp
- All cycles
- 2024: D+20.3 2020: D+20.4 2016: D+16.4 2012: D+14.4 2008: D+15.5
Not yet ingested
- Civics
- —
Market trends
- HPI YoY
- ▼ -59.52%
- Current HPI
- 292.5607
- Rent YoY
- ▲ 4.06%
- Metro
- Pittsburgh, PA
- State GDP YoY
- ▲ 1.68%
- F500 in state
- 34
Industry mix (Fortune 500 HQ in PA)
| Industry | F500 HQs | Revenue |
|---|---|---|
| Healthcare | 2 | $309B |
|
||
| Insurance | 2 | $27B |
|
||
| Telecommunications / Media | 1 | $124B |
|
||
| Industrial Distribution | 1 | $22B |
|
||
| Financial Services | 1 | $20B |
|
||
| Chemicals / Materials | 1 | $18B |
|
||
Price history
-50.0% since first listed5 events — show timeline
- 2026-06-17 Price Changed $18,500 West Penn MLS
- 2026-05-11 Listed $25,000 West Penn MLS
- 2025-12-18 Price Changed $25,000 West Penn MLS
- 2025-09-21 Price Changed $30,000 West Penn MLS
- 2025-05-16 Listed $37,000 West Penn MLS
Property tax history
+3.2%/yrLatest (2025): $1,183 · +16.2% YoY. Source: county tax records.
Cash-flow waterfall
monthlySold comps — $/sqft
last 12 mo · ≤1 miLoading sold comps…