8469 Westminster Ave · Warren, MI
Flood risk 1/10 · Minimal
- FEMA flood zone
- X (unshaded)
- Chance of flooding over 30 yrs
- 0.0%
- Est. flood insurance / yr
- $473 – $860
Fire risk 1/10 · Minimal
- Est. fire insurance / yr
- $784 – $1,456
Heat risk 3/10 · Minor
- Hot days now (above 97°F)
- 7 days/yr
- Hot days in 30 yrs
- 15 days/yr
Wind risk 1/10 · Minimal
- Chance of severe wind over 30 yrs
- —
Air-quality risk 3/10 · Minor
- Unhealthy air days now
- 3 days/yr
- Unhealthy air days in 30 yrs
- 4 days/yr
Risk factors via First Street. Map © Google.
Why this score? — see what drove the C+ grade
The composite is a weighted blend of 9 inputs, each scored 0–100. Each bar is that input's sub-score; the figure is the points it added to the 100-point composite (weight × sub-score).
- Cash flow +25.8/30.0
- ARV discount +9.0/15.0
- DSCR +8.6/10.0
- 1% rule +6.9/10.0
- Livability +3.7/5.0
- Rent growth +3.2/5.0
- Condition / age +2.5/5.0
- Schools +1.0/10.0
- Appreciation +0.0/10.0
$159,500
🖨 Deal sheet (PDF) 📄 Offer letter ✓ Due diligence
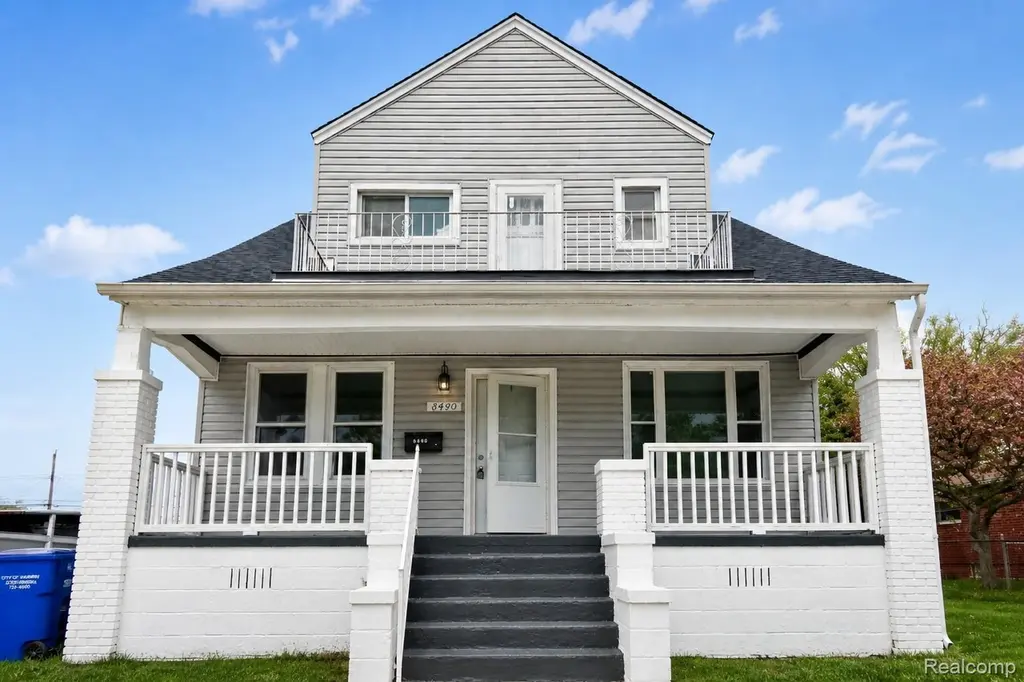
Listing remarks
Step into this spacious and versatile home featuring two levels of comfortable living space. The first floor offers 2 bedrooms, a full bathroom, a modern updated kitchen, and freshly painted interiors with new flooring. Upstairs, you’ll find 3 additional bedrooms and another full bath, providing plenty of room for extended family or guests. The open layout creates a warm and inviting atmosphere, perfect for entertaining or relaxing. Outside, enjoy a large backyard ideal for gatherings, gardening, or future enhancements, along with a generous driveway that offers ample parking. Whether you’re looking for a primary residence with rental potential—live on one floor and rent t
Key facts
- Large backyard
- Generous driveway
- 0.24 acre lot
Tags
Property features AI
Exterior
- Parking: No garage
- Utilities: Public water; Public sewer
- Home design: Single-family residence; Two-story home; Ground-level entry with steps; Vinyl siding
- Construction: Asphalt roof; Block and brick/mortar foundation; Built with vinyl siding
- Exterior features: Back yard fencing; Gravel road access
Interior
- Bathrooms: Two full bathrooms
- Heating & cooling: Natural gas heating; Radiant heat; No central air conditioning
- Interior features: Unfinished basement; Five total rooms
Neighborhood map
What this means for you Summary
Snapshot
- This is a 5-bed/1.0-bath single-family listed at $160k.
Deal economics
- At list price, monthly cash flow is $385 ($5k/yr) — positive.
- The deal already cash-flows at list — no discount required.
- Meets the 1% rule at list price ($2k rent vs $160k).
- Recommended offer: $155k (3.0% below list) — sets the bar for market timing.
- Cap rate 9.2% vs local median 5.2% in Warren — top-decile yield for the area; either an underpriced asset or a hidden risk that comps aren't pricing in. Stress-test before assuming the spread holds.
Location & tenants
- Location reads 74/100 on livability (#171 in MI, #4,491 nationally) — a middle-class / working-renter tenant base. Strengths: commute A+, cost of living A+, housing A+; Watch: amenities D, employment D, crime D-.
- Van Dyke Public Schools (urban): math 7% / reading 19% proficiency, ranked #512 of 540 in MI (top 95%) — low school quality limits family demand, transient renter base, plan for 1-2y turnover; 80% free/reduced lunch — lower-income household profile, screen leases tightly.
- Zoned schools: Lincoln Elementary School (math 8% / reading 12%, grade F, #1,277 of 1,397 statewide, top 93%, 355 students, 97% FRL); Lincoln Middle School (math 7% / reading 22%, grade F, #460 of 493 statewide, top 93%, 401 students, 96% FRL); Lincoln High School (math 2% / reading 17%, grade F, #692 of 713 statewide, top 98%, 440 students, 91% FRL).
- Market conditions: Rents rising (+2.9%/yr); 168 active listings in the ZIP; 1 comparable units currently listed for rent nearby; 1,321 units permitted in Macomb County in 2024 (86 in 5+ unit buildings).
- This rent runs 44% of the median local income ($52k/yr) — at the standard rent-burdened threshold; future hikes will face affordability resistance.
Forward outlook
- Local home prices are declining (-3.0%/yr); year-one equity from $1k of loan paydown is wiped out by about $5k of value loss. Plan a longer hold.
- Macomb County population projected at +9% by 2050 — modest demand growth; plan on rents tracking national, not racing it.
Negotiation context
- It's been on market 46 days — a 3% lower offer ($155k) is reasonable based on typical stale-listing flexibility.
- 9 sale attempts since 23y ago with the ask held roughly flat each time — persistent listings suggest the price (not the market) is what's stuck; bring a comps-based counter.
- Current owner paid $66k; list at $160k implies a 144% gain — meaningful room to come down on a strong offer.
Risks & watch-outs
- Watch-outs: built in 1938 — expect roof / HVAC / electrical / plumbing capex.
Questions for the listing agent
- It's been on market 46 days. Have you received any prior offers? Is the seller open to a 3% concession, seller financing, or rate buy-down credit?
- Built in 1938 — when were the roof, HVAC, electrical panel, plumbing, and water heater last replaced?
- Is there a deadline driving the sale (1031 exchange, divorce, estate, relocation)? That informs how much negotiation room exists.
- Schools are D-rated, which usually means shorter tenancies and higher turnover. Who's the typical renter profile here, and what's been the actual vacancy rate?
- Crime grade is D in this area — have there been break-ins, vandalism, or insurance claims at this property in the last 3 years? What carrier currently insures it and at what premium?
- What's the average days-on-market for RENTAL listings here right now (not sales)? A rising rental-DOM trend means longer vacancies and softer asking-rent achievability than the comps imply.
- What's the recent tenant-quality profile in this submarket — average credit score on applications, eviction rate, late-payment / NSF rate, and stable-employment percentage? A property-management company in the area should have these aggregated.
- How much new for-sale + rental construction is in the pipeline within 1–3 miles? Heavy new supply typically softens prices + rents 12–24 months out; constrained supply supports both.
Investment metrics
- 1% rule
- 1.19% ✓
- Cap rate
- 9.19%
- Cash-on-cash
- 10.34%
- DSCR
- 1.46
- GRM
- 7.0
CMA / ARV
- ARV (median comp)
- $164,817
- List price
- $159,500
- Delta
- -3.23%
- Verdict
- FAIR
- Comps
- 20 within 1.0 mi
Show comp detail 4 sales within ~0.75 mi
| Address | Dist | Beds/Ba | Sqft | Sold | Price | $/sf | Match |
|---|---|---|---|---|---|---|---|
| 8316 Rivard Ave | 0.26mi | 4/2.0 (-1) | 1,980 (-12%) | 15mo | $175,000 | $88 | 48 |
| 7257 Jackson Ave | 0.53mi | 4/2.0 (-1) | 2,055 (-8%) | 7mo | $170,000 | $83 | 47 |
| 20421 Rogge St | 0.71mi | 4/1.5 (-1) | 2,126 (-5%) | 6mo | $145,000 | $68 | 46 |
| 7043 Toepfer Rd | 0.65mi | 4/1.0 (-1) | 2,048 (-8%) | 5mo | $160,000 | $78 | 46 |
Match score weights: distance 35% · size 25% · config 20% · recency 20%. Top-matched comps best support the ARV.
Projected returns pro-forma
-3.0% appreciation · 2.94% rent growth · sell at horizon
- IRR
- -0.8%
- Equity multiple
- 0.97×
- Total profit
- $-1,415
- Equity at exit
- $23,782
- IRR
- 8.8%
- Equity multiple
- 1.67×
- Total profit
- $30,011
- Equity at exit
- $13,791
Cash invested: $44,660 (down + closing). Projections, not guarantees.
Landlord ↔ Tenant lean methodology
- Overall (STATE)
- 62 Landlord-Friendly
- State Michigan
- 62 Landlord-Friendly · EVEN
- County
- — inherits STATE
- City
- — inherits STATE
ZIP-level market 48089
- Rents YoY
- 2.9%
- Active inventory
- 168
- Price-to-rent
- 7.0×
Monthly cashflow live
- Estimated rent
- $1,902 medium interval (Pro) →
- Mortgage (P&I)
- −$836
- Tax from tax record
- −$215 /mo · $2,579/yr
- Insurance
- −$66
- HOA
- −$0
- Vacancy / Maint / Mgmt
- −$399
- Net cashflow
- $385
Break-even live
Sensitivity live
| Price | -10% $475 | -5% $430 | +0% $385 | +5% $340 | +10% $295 |
|---|---|---|---|---|---|
| Rent | -10% $235 | -5% $310 | +0% $385 | +5% $460 | +10% $535 |
| Rate | -1.0pp $465 | -0.5pp $425 | base $385 | +0.5pp $343 | +1.0pp $301 |
UW: 25.0% down · 7.5% · 30yr · 1.5% tax · 5.0% vac · 8.0% maint · 8.0% mgmt
Financing live
Cash to close
- Down payment
- $39,875
- Closing costs
- $4,785
- Reserves months
- —
- Total cash needed
- —
Loan-product check · same deal, 3 products live
Conventional
25% down · 7.5% · 30yr
- Down + closing
- —
- Monthly P&I
- —
- Monthly cashflow
- —
- DSCR
- —
- Eligible?
- —
Personal DTI + credit; lowest rate.
DSCR
20% down · 8.5% · 30yr
- Down + closing
- —
- Monthly P&I
- —
- Monthly cashflow
- —
- DSCR
- —
- Eligible?
- —
No personal income docs; deal must DSCR.
Hard money
10% down · 12.0% · 12mo
- Down + closing
- —
- Monthly P&I
- —
- Monthly cashflow
- —
- DSCR
- —
- Eligible?
- —
Short-term bridge; refi at stabilization.
Rent comps 1 comps
| Address | Beds | Baths | Sqft | Rent | $/sqft | DOM | Units | Dist |
|---|---|---|---|---|---|---|---|---|
| 7584 Hudson Ave Warren, MI | 5.0 | 1.0 | 1554 | $1,800 | $1.16 | 25d | 1 | 0.54mi |
Listing history 46 events
-
2026-06-17days on market $159,500 Active 46 DOM
-
2026-06-16days on market $159,500 Active 45 DOM
-
2026-06-15days on market $159,500 Active 44 DOM
-
2026-06-13days on market $159,500 Active 42 DOM
-
2026-06-13days on market $159,500 Active 41 DOM
-
2026-06-09days on market $159,500 Active 38 DOM
-
2026-06-08days on market $159,500 Active 37 DOM
-
2026-06-07days on market $159,500 Active 36 DOM
-
2026-06-04days on market $159,500 Active 33 DOM
-
2026-06-03days on market $159,500 Active 32 DOM
-
2026-06-02days on market $159,500 Active 31 DOM
-
2026-06-01days on market $159,500 Active 30 DOM
-
2026-05-31days on market $159,500 Active 29 DOM
-
2026-05-02$164,999 Active 906-char remark
-
2026-05-02$164,999 Active 922-char remark
-
2024-11-26soldstatus $65,500
-
2023-03-02historical
-
2023-03-02status Active
-
2023-01-01historical
-
2022-12-31historical
-
2022-08-21price $116,000
-
2022-08-20price $116,000
-
2022-07-19price $128,000
-
2022-07-18price $128,000
-
2022-07-06$140,000 Active
-
2022-07-06$140,000 Active
-
2019-11-26soldstatus $65,500 Sold
-
2019-11-26soldstatus $65,500 Closed
-
2019-11-11status Pending
-
2019-11-11status Pending
-
2019-11-08price $69,900
-
2019-11-07price $69,900
-
2019-10-01price $62,000
-
2019-10-01price $62,000
-
2019-09-24price $69,500
-
2019-09-24price $69,500
-
2019-09-14price $73,000
-
2019-09-14price $73,000
-
2019-09-09$80,000 Active
-
2019-09-09$80,000 Active
-
2004-04-08soldstatus $89,000
-
2004-03-16historical
-
2003-12-16$85,000
-
2003-10-31historical
-
2003-07-25$85,000
-
2000-03-17soldstatus $35,000
ⓘ Source: listings_history table (triggers on properties + properties_extension) + one-shot
backfill from property_details.listing_events for pre-trigger history.
Tax reassessment forecast MI · Partial reset (capped growth)
- Current annual tax
- $2,579 · $215/mo
- Projected year-2 tax
- $2,579 · $215/mo
- Expected delta
- $0/yr ($0/mo · 0.0%)
ⓘ Screening estimate from a state-policy table — verify with the county assessor before closing.
Climate risk First Street
- Flood 1/10 Low FEMA zone X (unshaded) · 0% chance over 30 yrs
- Wildfire 1/10 Low
- Heat 3/10 Moderate 7 d/yr ≥97°F today · 15 d/yr by 30 yrs out
- Wind 1/10 Low
- Air quality 3/10 Moderate 3 unhealthy d/yr today · 4 by 30 yrs out
Nearby sold comps map
Loading sold comps map…
Walkable amenities ~0.75 mi
Loading nearby amenities…
Taxation est. · year 1
- Rental income
- $22,824
- − Mortgage interest
- −$8,934
- − Property taxes
- −$2,579
- − Insurance
- −$798
- − Repairs & maintenance
- −$1,826
- − Management
- −$1,826
- − Depreciation
- −$4,640
- Taxable income
- $2,222
- Est. tax owed @ 24.0%
- −$533
- After-tax cash flow
- $4,084/yr
For passive investors: Depreciation is non-cash, so a rental often shows a tax loss while cash-flowing — sheltering income. Rental losses are passive: they offset passive income freely, and up to $25,000/yr can offset ordinary (W-2) income if you actively participate and your MAGI is under $100k (phasing out to $0 by $150k); unused losses carry forward. On sale, claimed depreciation is recaptured at up to 25%, and gains may owe capital-gains tax (a 1031 exchange can defer both). Figures are a year-1 estimate at your 24.0% rate — not tax advice; consult a CPA.
Schools (NCES district)
- District
- Van Dyke Public Schools
- NCES district ID
- 2634680
- Math proficiency
- 7% ▼ -11.00%
- Reading proficiency
- 19% ▼ -5.00%
- Median HH income
- $33,231
- Composite
- 10.46/100
- National rank
- #9784
- State rank
- #512 of 540 in MI
Livability — Warren
- Score
- 74/100
- State rank
- #171
- US rank
- #4491
Category grades
Schools grade is shown separately in the Schools card above.
Census & demographics
- Census place
- Warren, MI
- County
- Macomb County · 638,552 people
- City population
- 114,937
- Metro
- Detroit-Warren-Dearborn, MI
- Population (ZIP)
- 31,853
- Household income
- $52,366
- Rent vs Own
- Severe rent burden
- 1754.0
Population outlook (Macomb County) Hauer SSP2
- Today (2025)
- 925,296 people
- By 2030
- 948,226 · +2.5%
- By 2040
- 983,961 · +6.3%
- By 2050
- 1,010,200 · +9.2%
- By 2075
- 1,076,222 · +16.3%
- By 2100
- 1,077,065 · +16.4%
Race, ethnicity, and origin ACS 2023
- Neighborhood character
- Diverse neighborhood (Simpson 0.61)
- Race & ethnicity
- White 53% Black 31% Asian 7% Two or more races 6% Hispanic / Latino 3%
- Common ancestry
- Romanian 11% Lithuanian 3% Slovak 2%
- Foreign-born
- 5% · Canada
- Languages at home
- 92% English-only · Other Asian/Pacific 3% Other Indo-European 2% Arabic 1%
Political lean MEDSL · Macomb
- 2024 margin
- R (+13.7) · D 42.2% · R 55.9% · Other 1.9%
- 2008→2024 swing
- -22.3pp toward R · 2008: 8.6pp · 2024: -13.7pp
- All cycles
- 2024: R+13.7 2020: R+8.1 2016: R+11.6 2012: D+4.0 2008: D+8.6
Not yet ingested
- Civics
- —
Market trends
- HPI YoY
- ▼ -211.46%
- Current HPI
- 154.8325
- Rent YoY
- ▲ 2.94%
- Metro
- Detroit-Warren-Dearborn, MI
- State GDP YoY
- ▲ 1.37%
- F500 in state
- 28
Industry mix (Fortune 500 HQ in MI)
| Industry | F500 HQs | Revenue |
|---|---|---|
| Automotive Parts | 3 | $48B |
|
||
| Automotive | 2 | $372B |
|
||
| Chemicals | 1 | $45B |
|
||
| Automotive Retail | 1 | $29B |
|
||
| Healthcare / Medical Devices | 1 | $23B |
|
||
| Automotive Technology | 1 | $20B |
|
||
Price history
+355.7% since first listed37 events — show timeline
- 2026-06-17 Listing Removed — REALCOMP
- 2026-06-17 Listing Removed — MiRealSource-MiMLS
- 2026-05-27 Price Changed $159,500 REALCOMP
- 2026-05-26 Price Changed $159,500 MiRealSource-MiMLS
- 2026-05-02 Listed $164,999 REALCOMP
- 2026-05-02 Listed $164,999 MiRealSource-MiMLS
- 2024-11-26 Sold (Public Records) $65,500 Public Records
- 2023-03-02 Listing Removed — REALCOMP
- 2023-03-02 Relisted — REALCOMP
- 2023-01-01 Listing Removed — MiRealSource-MiMLS
- 2022-12-31 Listing Removed — REALCOMP
- 2022-08-21 Price Changed $116,000 MiRealSource-MiMLS
- 2022-08-20 Price Changed $116,000 REALCOMP
- 2022-07-19 Price Changed $128,000 MiRealSource-MiMLS
- 2022-07-18 Price Changed $128,000 REALCOMP
- 2022-07-06 Listed $140,000 MiRealSource-MiMLS
- 2022-07-06 Listed $140,000 REALCOMP
- 2019-11-26 Sold (MLS) $65,500 MiRealSource-MiMLS
- 2019-11-26 Sold (MLS) $65,500 REALCOMP
- 2019-11-11 Pending — MiRealSource-MiMLS
- 2019-11-11 Pending — REALCOMP
- 2019-11-08 Price Changed $69,900 MiRealSource-MiMLS
- 2019-11-07 Price Changed $69,900 REALCOMP
- 2019-10-01 Price Changed $62,000 MiRealSource-MiMLS
- 2019-10-01 Price Changed $62,000 REALCOMP
- 2019-09-24 Price Changed $69,500 MiRealSource-MiMLS
- 2019-09-24 Price Changed $69,500 REALCOMP
- 2019-09-14 Price Changed $73,000 MiRealSource-MiMLS
- 2019-09-14 Price Changed $73,000 REALCOMP
- 2019-09-09 Listed $80,000 MiRealSource-MiMLS
- 2019-09-09 Listed $80,000 REALCOMP
- 2004-04-08 Sold (Public Records) $89,000 Public Records
- 2004-03-16 Listing Removed — REALCOMP
- 2003-12-16 Listed $85,000 REALCOMP
- 2003-10-31 Listing Removed — REALCOMP
- 2003-07-25 Listed $85,000 REALCOMP
- 2000-03-17 Sold (Public Records) $35,000 Public Records
Property tax history
+4.1%/yrLatest (2025): $2,579 · +2.5% YoY. Source: county tax records.
Cash-flow waterfall
monthlySold comps — $/sqft
last 12 mo · ≤1 miLoading sold comps…