 🏗️ New Construction
2900 West Acres Dr #61 · Steamboat Springs, CO
Flood risk 5/10 · Moderate
- FEMA flood zone
- X (unshaded)
- Chance of flooding over 30 yrs
- 0.67%
- Est. flood insurance / yr
- $507 – $1,088
Fire risk 5/10 · Moderate
- Est. fire insurance / yr
- $939 – $1,743
Heat risk 2/10 · Minimal
- Hot days now (above 85°F)
- 9 days/yr
- Hot days in 30 yrs
- 24 days/yr
Wind risk 1/10 · Minimal
- Chance of severe wind over 30 yrs
- —
Air-quality risk 2/10 · Minimal
- Unhealthy air days now
- 2 days/yr
- Unhealthy air days in 30 yrs
- 2 days/yr
Risk factors via First Street. Map © Google.
Why this score? — see what drove the B grade
The composite is a weighted blend of 9 inputs, each scored 0–100. Each bar is that input's sub-score; the figure is the points it added to the 100-point composite (weight × sub-score).
- Cash flow +30.0/30.0
- 1% rule +10.0/10.0
- DSCR +10.0/10.0
- ARV discount +7.5/15.0
- Schools +5.3/10.0
- Rent growth +5.0/5.0
- Livability +3.7/5.0
- Condition / age +2.5/5.0
- Appreciation +0.0/10.0
$299,000
🖨 Deal sheet 📄 Offer letter ✓ Due diligence
Listing remarks
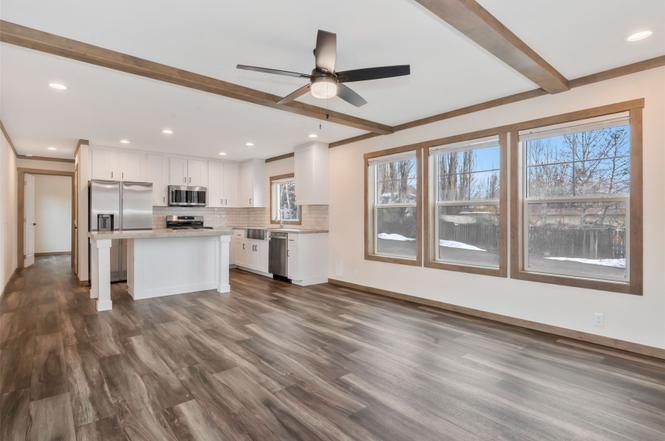
Welcome to this brand-new, 2025-constructed mobile home located in the desirable West Acres Mobile Home Park. This thoughtfully designed home offers over 1,100 square feet of comfortable living space with 3 bedrooms and 2 full bathrooms. The spacious primary suite features a private en-suite bathroom complete with a standalone soaking tub and a large walk-in shower. Two additional bedrooms and a full bathroom are located at the front of the home, providing a functional and private layout. The open-concept kitchen is equipped with all-new appliances and flows seamlessly into the great room, highlighted by large windows, perfect for entertaining or enjoying the mountain setting. This home inc
Key facts
- Open-concept kitchen
- All-new appliances
- Great room
Tags
Property features AI
Finance
- Other: Unit located in WEST ACRES PARK SUBD
Exterior
- Parking: Off-street parking
- Utilities: Public water; Public sewer (sewer connected); Electricity available; Natural gas available; Cable available; Water available
- Home design: Residential mobile home; New construction
- Construction: Frame construction
- Exterior features: Composition roof; City lot; Paved road access; Pets allowed
Interior
- Kitchen: Dishwasher; Gas range; Microwave; Self-cleaning oven
- Flooring: Vinyl; Tile
- Bathrooms: 2 full bathrooms
- Heating & cooling: Forced air heating
- Interior features: Eat-in kitchen; See remarks
- Laundry & utility: Washer hookup in unit
Neighborhood map
What this means for you Summary
Snapshot
- This is a 3-bed/2.0-bath manufactured listed at $299k.
Deal economics
- At list price, monthly cash flow is $2k ($24k/yr) — positive.
- The deal already cash-flows at list — no discount required.
- Meets the 1% rule at list price ($3k rent vs $299k).
- Recommended offer: $263k (12.0% below list) — sets the bar for market timing.
- Cap rate 34.5% vs local median 0.1% in Steamboat Springs — top-decile yield for the area; either an underpriced asset or a hidden risk that comps aren't pricing in. Stress-test before assuming the spread holds.
Location & tenants
- Location reads 74/100 on livability (#41 in CO, #4,975 nationally) — a middle-class / working-renter tenant base. Strengths: commute A+, employment A+; Watch: health & safety C-, amenities D, cost of living F.
- Steamboat Springs School District No. RE-2 (town): math 49% / reading 72% proficiency, ranked #4 of 86 in CO (top 5%) — acceptable for families but not a draw, mixed tenant base, ~2y average lease; only 12% free/reduced lunch — higher-income household profile.
- Zoned schools: Sleeping Giant School (400 students, 17% FRL); Steamboat Springs High School (math 52% / reading 77%, grade B-, #32 of 381 statewide, top 9%, 842 students, 8% FRL) — zoned schools at 12% FRL track the district average.
- Market conditions: Rents rising fast (+10.6%/yr); 555 active listings in the ZIP; solid renter incomes; 597 units permitted in Routt County in 2024 (418 in 5+ unit buildings).
- This rent runs 35% of the median local income ($110k/yr) — at the standard rent-burdened threshold; future hikes will face affordability resistance.
Forward outlook
- Local home prices are declining (-3.0%/yr); year-one equity from $581 of loan paydown is wiped out by about $3k of value loss. Plan a longer hold.
- Routt County population projected at +18% by 2050 — long-run rental-demand tailwind backs the buy-and-hold thesis.
- At projected returns (-3.0% appreciation + 8.0% rent growth), your $24k cash investment doubles in ~2 years — after that, you're playing with house money.
Negotiation context
- It's been on market 126 days — a 12% lower offer ($263k) is reasonable based on typical stale-listing flexibility.
Risks & watch-outs
- Climate carrying-cost: moderate flood risk; moderate wildfire risk — expect insurance premiums to compound above CPI over the hold.
Questions for the listing agent
- It's been on market 126 days. Have you received any prior offers? Is the seller open to a 12% concession, seller financing, or rate buy-down credit?
- Why hasn't it sold? Are there any deal-killer items the seller is aware of (foundation, flood, title, zoning, code violations)?
- Is there a deadline driving the sale (1031 exchange, divorce, estate, relocation)? That informs how much negotiation room exists.
- Schools are B-rated — typically a magnet for longer-tenancy family renters. What's the average tenant stay here, and is there a school-zone premium baked into asking?
- What's the average days-on-market for RENTAL listings here right now (not sales)? A rising rental-DOM trend means longer vacancies and softer asking-rent achievability than the comps imply.
- What's the recent tenant-quality profile in this submarket — average credit score on applications, eviction rate, late-payment / NSF rate, and stable-employment percentage? A property-management company in the area should have these aggregated.
- How much new for-sale + rental construction is in the pipeline within 1–3 miles? Heavy new supply typically softens prices + rents 12–24 months out; constrained supply supports both.
Investment metrics
- 1% rule
- 3.85% ✓
- Cap rate
- 34.54%
- Cash-on-cash
- 100.89%
- DSCR
- 5.49
- GRM
- 2.2
CMA / ARV
- ARV (on-the-fly)
- $84,096
- Comps found
- 2
Show comp detail 2 sales within ~0.75 mi
| Address | Dist | Beds/Ba | Sqft | Sold | Price | $/sf | Match |
|---|---|---|---|---|---|---|---|
| 2900 W Acres Dr #20 | 0.00mi | 2/2.0 (-1) | 1,024 (-11%) | 3mo | $75,000 | $73 | 74 |
| 2900 W Acres Dr #42 | 0.00mi | 3/2.0 | 1,036 (-10%) | 14mo | $66,000 | $64 | 72 |
Match score weights: distance 35% · size 25% · config 20% · recency 20%. Top-matched comps best support the ARV.
Projected returns pro-forma
-3.0% appreciation · 8.0% rent growth · sell at horizon
- IRR
- —
- Equity multiple
- 6.51×
- Total profit
- $129,642
- Equity at exit
- $12,539
- IRR
- —
- Equity multiple
- 16.01×
- Total profit
- $353,421
- Equity at exit
- $7,271
Cash invested: $23,547 (down + closing). Projections, not guarantees.
Landlord ↔ Tenant lean methodology
- Overall (STATE)
- 38 Tenant-Leaning
- State Colorado
- 38 Tenant-Leaning · D+4
- County
- — inherits STATE
- City
- — inherits STATE
ZIP-level market 80487
- Rents YoY
- 10.6%
- Active inventory
- 555
- Price-to-rent
- 7.7×
Monthly cashflow live
- Estimated rent
- $3,242 medium interval (Pro) →
- Mortgage (P&I)
- −$441
- Tax est. 1.5%
- −$105 /mo · $1,261/yr
- Insurance
- −$35
- HOA
- −$0
- Vacancy / Maint / Mgmt
- −$681
- Net cashflow
- $1,980
Break-even live
UW: 25.0% down · 7.5% · 30yr · 1.5% tax · 5.0% vac · 8.0% maint · 8.0% mgmt
Financing live
Cash to close
- Down payment
- $21,024
- Closing costs
- $2,523
- Reserves months
- —
- Total cash needed
- —
Loan-product check · same deal, 3 products live
Conventional
25% down · 7.5% · 30yr
- Down + closing
- —
- Monthly P&I
- —
- Monthly cashflow
- —
- DSCR
- —
- Eligible?
- —
Personal DTI + credit; lowest rate.
DSCR
20% down · 8.5% · 30yr
- Down + closing
- —
- Monthly P&I
- —
- Monthly cashflow
- —
- DSCR
- —
- Eligible?
- —
No personal income docs; deal must DSCR.
Hard money
10% down · 12.0% · 12mo
- Down + closing
- —
- Monthly P&I
- —
- Monthly cashflow
- —
- DSCR
- —
- Eligible?
- —
Short-term bridge; refi at stabilization.
Listing history 17 events
-
2026-06-19days on market $299,000 Active 126 DOM
-
2026-06-18days on market $299,000 Active 125 DOM
-
2026-06-17days on market $299,000 Active 124 DOM
-
2026-06-16days on market $299,000 Active 123 DOM
-
2026-06-15days on market $299,000 Active 122 DOM
-
2026-06-14days on market $299,000 Active 120 DOM
-
2026-06-12days on market $299,000 Active 119 DOM
-
2026-06-09days on market $299,000 Active 116 DOM
-
2026-06-08days on market $299,000 Active 115 DOM
-
2026-06-07days on market $299,000 Active 114 DOM
-
2026-06-07days on market $299,000 Active 113 DOM
-
2026-06-04days on market $299,000 Active 110 DOM
-
2026-06-02days on market $299,000 Active 109 DOM
-
2026-06-01days on market $299,000 Active 108 DOM
-
2026-05-31days on market $299,000 Active 107 DOM
-
2026-05-31days on market $299,000 Active 106 DOM
-
2026-02-13$299,000 Active
ⓘ Source: listings_history table (triggers on properties + properties_extension) + one-shot
backfill from property_details.listing_events for pre-trigger history.
Climate risk First Street
- Flood 5/10 Major FEMA zone X (unshaded) · 67% chance over 30 yrs
- Wildfire 5/10 Major
- Heat 2/10 Low 9 d/yr ≥85°F today · 24 d/yr by 30 yrs out
- Wind 1/10 Low
- Air quality 2/10 Low 2 unhealthy d/yr today · 2 by 30 yrs out
Nearby sold comps map
Loading sold comps map…
Walkable amenities ~0.75 mi
Loading nearby amenities…
Taxation est. · year 1
- Rental income
- $38,900
- − Mortgage interest
- −$4,711
- − Property taxes
- −$1,261
- − Insurance
- −$420
- − Repairs & maintenance
- −$3,112
- − Management
- −$3,112
- − Depreciation
- −$2,446
- Taxable income
- $23,837
- Est. tax owed @ 24.0%
- −$5,721
- After-tax cash flow
- $18,036/yr
For passive investors: Depreciation is non-cash, so a rental often shows a tax loss while cash-flowing — sheltering income. Rental losses are passive: they offset passive income freely, and up to $25,000/yr can offset ordinary (W-2) income if you actively participate and your MAGI is under $100k (phasing out to $0 by $150k); unused losses carry forward. On sale, claimed depreciation is recaptured at up to 25%, and gains may owe capital-gains tax (a 1031 exchange can defer both). Figures are a year-1 estimate at your 24.0% rate — not tax advice; consult a CPA.
Schools (NCES district)
- District
- Steamboat Springs School District No. RE-2
- NCES district ID
- 0806660
- Math proficiency
- 49% ▼ -9.00%
- Reading proficiency
- 72% ▲ 1.00%
- Median HH income
- $67,833
- Composite
- 53.1/100
- National rank
- #1513
- State rank
- #4 of 86 in CO
Livability — Steamboat Springs
- Score
- 74/100
- State rank
- #41
- US rank
- #4975
Category grades
Schools grade is shown separately in the Schools card above.
Census & demographics
- Census place
- Steamboat Springs, CO
- County
- Routt County · 18,525 people
- City population
- 18,525
- Metro
- Steamboat Springs, CO
- Population (ZIP)
- 18,525
- Household income
- $109,659
- Rent vs Own
- Severe rent burden
- 644.0
Population outlook (Routt County) Hauer SSP2
- Today (2025)
- 27,283 people
- By 2030
- 28,555 · +4.7%
- By 2040
- 30,578 · +12.1%
- By 2050
- 32,328 · +18.5%
- By 2075
- 36,897 · +35.2%
- By 2100
- 38,794 · +42.2%
Race, ethnicity, and origin ACS 2023
- Neighborhood character
- Predominantly White (80%)
- Race & ethnicity
- White 80% Two or more races 12% Hispanic / Latino 9%
- Hispanic origin (detail)
- Mexican 6%
- Common ancestry
- Romanian 5% Slovak 3% Lithuanian 3%
- Foreign-born
- 7% · Canada
- Languages at home
- 92% English-only · Spanish 6% Other Indo-European 1% French/Haitian/Cajun 1%
Political lean MEDSL · Routt
- 2024 margin
- Strong D (+27.7) · D 62.5% · R 34.8% · Other 2.8%
- 2008→2024 swing
- +0.9pp no change · 2008: 26.9pp · 2024: 27.7pp
- All cycles
- 2024: D+27.7 2020: D+27.6 2016: D+17.0 2012: D+15.6 2008: D+26.9
Not yet ingested
- Civics
- —
Market trends
- HPI YoY
- ▼ -342.73%
- Current HPI
- 471.8844
- Rent YoY
- ▲ 10.61%
- Metro
- Steamboat Springs, CO
- State GDP YoY
- ▲ 1.95%
- F500 in state
- 14
Industry mix (Fortune 500 HQ in CO)
| Industry | F500 HQs | Revenue |
|---|---|---|
| Technology Distribution | 1 | $31B |
|
||
| Food / Agriculture | 1 | $18B |
|
||
| Packaging | 1 | $14B |
|
||
| Healthcare | 1 | $13B |
|
||
| Energy | 1 | $10B |
|
||
| Technology | 1 | $4B |
|
||
Price history
1 event — show timeline
- 2026-02-13 Listed $299,000 SAR
Property tax history
-3.5%/yrLatest (2024): $42 · -65.3% YoY. Source: county tax records.
Cash-flow waterfall
monthlySold comps — $/sqft
last 12 mo · ≤1 miLoading sold comps…