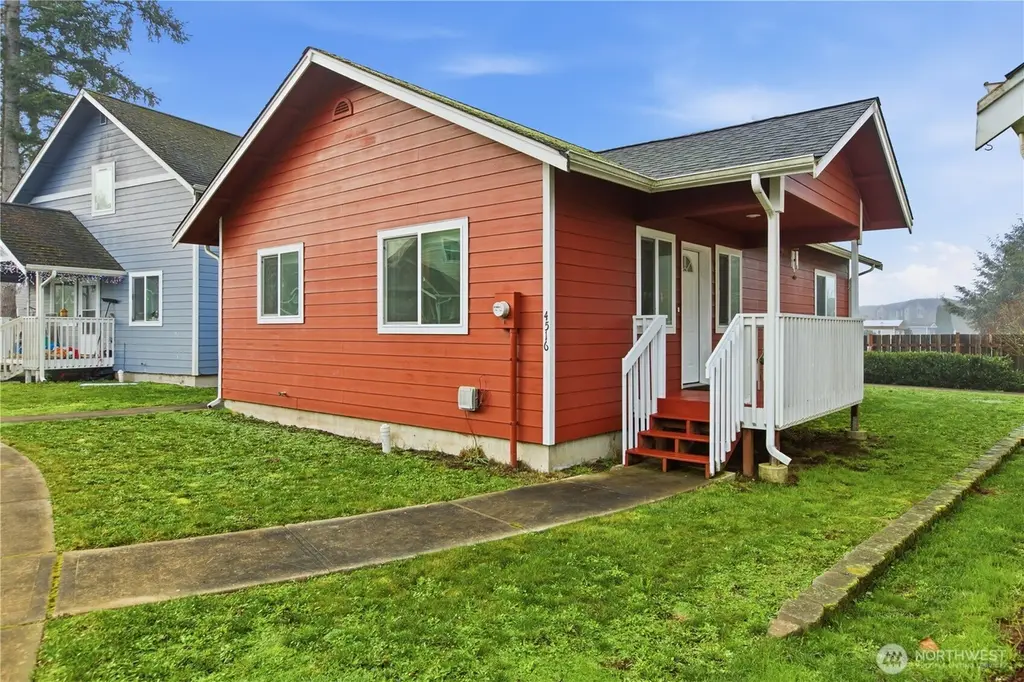
4516 Mattson Ln SE · Lacey, WA
Flood risk 1/10 · Minimal
- FEMA flood zone
- X (unshaded)
- Chance of flooding over 30 yrs
- 0.0%
- Est. flood insurance / yr
- $507 – $1,088
Fire risk 1/10 · Minimal
- Est. fire insurance / yr
- $604 – $1,122
Heat risk 3/10 · Minor
- Hot days now (above 88°F)
- 7 days/yr
- Hot days in 30 yrs
- 14 days/yr
Wind risk 1/10 · Minimal
- Chance of severe wind over 30 yrs
- —
Air-quality risk 6/10 · Moderate
- Unhealthy air days now
- 7 days/yr
- Unhealthy air days in 30 yrs
- 8 days/yr
Risk factors via First Street. Map © Google.
Why this score? — see what drove the D- grade
The composite is a weighted blend of 9 inputs, each scored 0–100. Each bar is that input's sub-score; the figure is the points it added to the 100-point composite (weight × sub-score).
- ARV discount +15.0/15.0
- Cash flow +6.1/30.0
- Schools +5.1/10.0
- Livability +4.2/5.0
- Rent growth +3.4/5.0
- Condition / age +2.5/5.0
- 1% rule +1.7/10.0
- DSCR +0.4/10.0
- Appreciation +0.0/10.0
$280,000
🖨 Deal sheet 📄 Offer letter ✓ Due diligence
Listing remarks
Affordable homeownership opportunity just 1 block away from the Chehalis Trail. This light filled 2-bedroom, 1-bathroom charmer offers just under 1,000 sqft with vaulted ceilings, open concept layout, and generously sized bedrooms. Fresh laminate flooring throughout, move-in ready condition. Located in a friendly community with playground areas, close to shopping and dining. Stop renting and start building equity in a home designed for real people on real budgets. Specific median income limits apply—this is your chance to own, not just dream.
Key facts
- Playground areas
- Open concept layout
- 3,049 sq ft lot
Tags
Neighborhood map
What this means for you Summary
Snapshot
- This is a 2-bed/1.0-bath single-family listed at $280k.
Deal economics
- At list price, monthly cash flow is $-521 ($-6k/yr) — negative.
- To cash-flow at today's rent, offer at most $205k (26.9% below list).
- To meet the 1% rule (rent ≥ 1% of price), the offer needs to be $188k (32.7% below list).
- Recommended offer: $188k (32.7% below list) — sets the bar for 1% rule.
- Cap rate 4.1% vs local median 3.0% in Lacey — top-decile yield for the area; either an underpriced asset or a hidden risk that comps aren't pricing in. Stress-test before assuming the spread holds.
Location & tenants
- Location reads 85/100 on livability (#33 in WA, #581 nationally) — a professional / high-income tenant draw. Strengths: amenities A+, commute A+, housing A+; Watch: cost of living D+.
- North Thurston Public Schools (suburban): math 51% / reading 62% proficiency, ranked #80 of 291 in WA (top 28%) — acceptable for families but not a draw, mixed tenant base, ~2y average lease.
- Market conditions: Rents rising (+3.6%/yr); 190 active listings in the ZIP; 12 comparable units currently listed for rent nearby; rentals at typical pace (median 21d on market — plan ~3-4 weeks tenant-placement turnaround); solid renter incomes; 1,222 units permitted in Thurston County in 2024 (508 in 5+ unit buildings).
Forward outlook
- Local home prices are declining (-3.0%/yr); year-one equity from $2k of loan paydown is wiped out by about $8k of value loss. Plan a longer hold.
- Thurston County population projected at +27% by 2050 — long-run rental-demand tailwind backs the buy-and-hold thesis.
Negotiation context
- It's been on market 170 days — a 12% lower offer ($246k) is reasonable based on typical stale-listing flexibility.
Questions for the listing agent
- What do current leases actually rent for vs. the listed asking? Can we see a recent rent roll and the last 12 months of T-12 income?
- It's been on market 170 days. Have you received any prior offers? Is the seller open to a 33% concession, seller financing, or rate buy-down credit?
- What does the HOA fee cover, when was the last increase, and are there any pending special assessments or reserve-fund shortfalls?
- Why hasn't it sold? Are there any deal-killer items the seller is aware of (foundation, flood, title, zoning, code violations)?
- Is there a deadline driving the sale (1031 exchange, divorce, estate, relocation)? That informs how much negotiation room exists.
- Schools are B-rated — typically a magnet for longer-tenancy family renters. What's the average tenant stay here, and is there a school-zone premium baked into asking?
- The area grade is low — what's the realistic commute time and amenity access for the typical tenant pool here? Any planned neighborhood developments (good or bad) we should know about?
- What's the average days-on-market for RENTAL listings here right now (not sales)? A rising rental-DOM trend means longer vacancies and softer asking-rent achievability than the comps imply.
- What's the recent tenant-quality profile in this submarket — average credit score on applications, eviction rate, late-payment / NSF rate, and stable-employment percentage? A property-management company in the area should have these aggregated.
- How much new for-sale + rental construction is in the pipeline within 1–3 miles? Heavy new supply typically softens prices + rents 12–24 months out; constrained supply supports both.
Investment metrics
- 1% rule
- 0.67% ✗
- Cap rate
- 4.06%
- Cash-on-cash
- -7.98%
- DSCR
- 0.64
- GRM
- 12.4
CMA / ARV
- ARV (median comp)
- $418,679
- List price
- $280,000
- Delta
- -33.12%
- Verdict
- UNDERPRICED
- Comps
- 20 within 1.0 mi
Show comp detail 3 sales within ~0.75 mi
| Address | Dist | Beds/Ba | Sqft | Sold | Price | $/sf | Match |
|---|---|---|---|---|---|---|---|
| 4925 41st Ln SE | 0.40mi | 2/2.0 | 1,101 (+15%) | 2mo | $331,000 | $301 | 51 |
| 2713 College St SE | 0.62mi | 3/1.5 (+1) | 1,072 (+12%) | 13mo | $425,000 | $396 | 34 |
| 4713 Stikes Dr SE | 0.74mi | 3/2.0 (+1) | 1,078 (+12%) | 11mo | $455,000 | $422 | 27 |
Match score weights: distance 35% · size 25% · config 20% · recency 20%. Top-matched comps best support the ARV.
Projected returns pro-forma
-3.0% appreciation · 3.56% rent growth · sell at horizon
- IRR
- -29.6%
- Equity multiple
- 0.01×
- Total profit
- $-77,440
- Equity at exit
- $41,749
- IRR
- -28.0%
- Equity multiple
- -0.35×
- Total profit
- $-105,463
- Equity at exit
- $24,209
Cash invested: $78,400 (down + closing). Projections, not guarantees.
Landlord ↔ Tenant lean methodology
- Overall (STATE)
- 28 Tenant-Leaning
- State Washington
- 28 Tenant-Leaning · D+8
- County
- — inherits STATE
- City
- — inherits STATE
ZIP-level market 98503
- Rents YoY
- 3.6%
- Active inventory
- 190
- Price-to-rent
- 12.4×
Monthly cashflow live
- Estimated rent
- $1,884 high interval (Pro) →
- Mortgage (P&I)
- −$1,468
- Tax est. 1.5%
- −$350 /mo · $4,200/yr
- Insurance
- −$117
- HOA
- −$75
- Vacancy / Maint / Mgmt
- −$396
- Net cashflow
- $-521
Break-even live
UW: 25.0% down · 7.5% · 30yr · 1.5% tax · 5.0% vac · 8.0% maint · 8.0% mgmt
Financing live
Cash to close
- Down payment
- $70,000
- Closing costs
- $8,400
- Reserves months
- —
- Total cash needed
- —
Loan-product check · same deal, 3 products live
Conventional
25% down · 7.5% · 30yr
- Down + closing
- —
- Monthly P&I
- —
- Monthly cashflow
- —
- DSCR
- —
- Eligible?
- —
Personal DTI + credit; lowest rate.
DSCR
20% down · 8.5% · 30yr
- Down + closing
- —
- Monthly P&I
- —
- Monthly cashflow
- —
- DSCR
- —
- Eligible?
- —
No personal income docs; deal must DSCR.
Hard money
10% down · 12.0% · 12mo
- Down + closing
- —
- Monthly P&I
- —
- Monthly cashflow
- —
- DSCR
- —
- Eligible?
- —
Short-term bridge; refi at stabilization.
Rent comps 12 comps
| Address | Beds | Baths | Sqft | Rent | $/sqft | DOM | Units | Dist |
|---|---|---|---|---|---|---|---|---|
| 3307 College St SE Lacey, WA | 2.0 | 1.0 | 865 | $1,700 | $1.97 | 13d | 3 | 0.27mi |
| 3301 College St SE Lacey, WA | 2.0 | 2.0 | 900 | $1,845 | $2.05 | 21d | 1 | 0.33mi |
| 4625 45th Ave SE Lacey, WA | 1.0–3.0 | 1.0–3.0 | 975 | $2,030 | $2.08 | 13d | 21 | 0.52mi |
| 4950 51st Ln SE Unit F-201 Lacey, WA | 2.0 | 2.0 | 975 | $1,650 | $1.69 | 21d | 1 | 0.83mi |
| 4435 Ruddell Rd SE Lacey, WA | 2.0 | 1.0 | 856 | $2,000 | $2.34 | 13d | 1 | 0.95mi |
| 5649 46th Ln SE Lacey, WA | 3.0 | 3.0 | 1100 | $2,300 | $2.09 | 21d | 1 | 0.98mi |
| 2700 Ruddell Rd SE Unit 2740-B Lacey, WA | 2.0 | 1.5 | 1054 | $1,695 | $1.61 | 43d | 1 | 1.07mi |
| 2570 Ruddell Rd SE Lacey, WA | 1.0 | 1.0 | 800 | $1,438 | $1.80 | 21d | 2 | 1.08mi |
| 5701 30th Ave SE Lacey, WA | 2.0 | 2.0 | 899 | $1,503 | $1.67 | 13d | 2 | 1.08mi |
| 3539 Landview Dr SE Olympia, WA | 1.0–3.0 | 1.0–2.0 | 1314 | $2,295 | $1.75 | 13d | 19 | 1.21mi |
| 3425 Polo Club Ln SE Olympia, WA | 1.0–3.0 | 1.0–2.0 | 934 | $2,025 | $2.17 | 13d | 9 | 1.35mi |
| 4314 14th Way SE Lacey, WA | 2.0 | 1.0 | 938 | $2,500 | $2.67 | 43d | 1 | 1.43mi |
HOA detail
- Monthly dues
- $75 · $900/yr
Listing history 20 events
-
2026-06-18days on market $280,000 Active 170 DOM
-
2026-06-17days on market $280,000 Active 169 DOM
-
2026-06-16days on market $280,000 Active 168 DOM
-
2026-06-15days on market $280,000 Active 167 DOM
-
2026-06-14days on market $280,000 Active 165 DOM
-
2026-06-13days on market $280,000 Active 164 DOM
-
2026-06-10days on market $280,000 Active 162 DOM
-
2026-06-09days on market $280,000 Active 161 DOM
-
2026-06-08days on market $280,000 Active 160 DOM
-
2026-06-07days on market $280,000 Active 159 DOM
-
2026-06-03days on market $280,000 Active 155 DOM
-
2026-06-02days on market $280,000 Active 154 DOM
-
2026-06-01days on market $280,000 Active 153 DOM
-
2026-05-31days on market $280,000 Active 152 DOM
-
2026-05-30days on market $280,000 Active 151 DOM
-
2026-03-12price $280,000
-
2026-01-28price $299,000
-
2026-01-20price $324,000
-
2026-01-12price $335,000
-
2025-12-30$350,000 Active
ⓘ Source: listings_history table (triggers on properties + properties_extension) + one-shot
backfill from property_details.listing_events for pre-trigger history.
Climate risk First Street
- Flood 1/10 Low FEMA zone X (unshaded) · 0% chance over 30 yrs
- Wildfire 1/10 Low
- Heat 3/10 Moderate 7 d/yr ≥88°F today · 14 d/yr by 30 yrs out
- Wind 1/10 Low
- Air quality 6/10 Major 7 unhealthy d/yr today · 8 by 30 yrs out
Nearby sold comps map
Loading sold comps map…
Walkable amenities ~0.75 mi
Loading nearby amenities…
Taxation est. · year 1
- Rental income
- $22,611
- − Mortgage interest
- −$15,684
- − Property taxes
- −$4,200
- − Insurance
- −$1,400
- − Repairs & maintenance
- −$1,809
- − Management
- −$1,809
- − HOA
- −$900
- − Depreciation
- −$8,145
- Taxable loss
- −$11,336
- Est. tax savings @ 24.0%
- +$2,721
- After-tax cash flow
- $-3,536/yr
For passive investors: Depreciation is non-cash, so a rental often shows a tax loss while cash-flowing — sheltering income. Rental losses are passive: they offset passive income freely, and up to $25,000/yr can offset ordinary (W-2) income if you actively participate and your MAGI is under $100k (phasing out to $0 by $150k); unused losses carry forward. On sale, claimed depreciation is recaptured at up to 25%, and gains may owe capital-gains tax (a 1031 exchange can defer both). Figures are a year-1 estimate at your 24.0% rate — not tax advice; consult a CPA.
Schools (NCES district)
- District
- North Thurston Public Schools
- NCES district ID
- 5305850
- Math proficiency
- 51% ▬ 0.00%
- Reading proficiency
- 62% ▬ 0.00%
- Median HH income
- $62,338
- Composite
- 51.09/100
- National rank
- #3798
- State rank
- #80 of 291 in WA
Livability — Lacey
- Score
- 85/100
- State rank
- #33
- US rank
- #581
Category grades
Schools grade is shown separately in the Schools card above.
Census & demographics
- Census place
- Lacey, WA
- County
- Thurston County · 269,345 people
- City population
- 108,850
- Metro
- Olympia-Lacey-Tumwater, WA
- Population (ZIP)
- 41,656
- Household income
- $89,002
- Rent vs Own
- Severe rent burden
- 2195.0
Population outlook (Thurston County) Hauer SSP2
- Today (2025)
- 308,239 people
- By 2030
- 326,483 · +5.9%
- By 2040
- 359,890 · +16.8%
- By 2050
- 391,800 · +27.1%
- By 2075
- 468,024 · +51.8%
- By 2100
- 519,890 · +68.7%
Race, ethnicity, and origin ACS 2023
- Neighborhood character
- Diverse neighborhood (Simpson 0.56)
- Race & ethnicity
- White 65% Two or more races 12% Hispanic / Latino 12% Asian 7% Black 5% Pacific Islander 2% Native American 1%
- Hispanic origin (detail)
- Mexican 8% Puerto Rican 1%
- Common ancestry
- Portuguese 4% Slovak 3% Lithuanian 3%
- Foreign-born
- 10% · Canada, Vietnam, South Korea
- Languages at home
- 82% English-only · Spanish 6% German/W. Germanic 3% Other Asian/Pacific 2%
Political lean MEDSL · Thurston
- 2024 margin
- Strong D (+20.4) · D 58.5% · R 38.1% · Other 3.5%
- 2008→2024 swing
- -1.3pp toward R · 2008: 21.7pp · 2024: 20.4pp
- All cycles
- 2024: D+20.4 2020: D+18.6 2016: D+15.4 2012: D+19.0 2008: D+21.7
Not yet ingested
- Civics
- —
Market trends
- HPI YoY
- ▼ -385.93%
- Current HPI
- 361.0974
- Rent YoY
- ▲ 3.56%
- Metro
- Olympia-Lacey-Tumwater, WA
- State GDP YoY
- ▲ 4.65%
- F500 in state
- 22
Industry mix (Fortune 500 HQ in WA)
| Industry | F500 HQs | Revenue |
|---|---|---|
| Retail | 2 | $269B |
|
||
| Technology / Retail | 1 | $638B |
|
||
| Technology | 1 | $245B |
|
||
| Telecommunications | 1 | $38B |
|
||
| Food / Beverage | 1 | $36B |
|
||
| Automotive / Trucks | 1 | $34B |
|
||
Price history
-20.0% since first listed5 events — show timeline
- 2026-03-12 Price Changed $280,000 NWMLS as Distributed by MLS Grid
- 2026-01-28 Price Changed $299,000 NWMLS as Distributed by MLS Grid
- 2026-01-20 Price Changed $324,000 NWMLS as Distributed by MLS Grid
- 2026-01-12 Price Changed $335,000 NWMLS as Distributed by MLS Grid
- 2025-12-30 Listed $350,000 NWMLS as Distributed by MLS Grid
Property tax history
-14.2%/yrLatest (2026): $405 · -1.5% YoY. Source: county tax records.
Cash-flow waterfall
monthlySold comps — $/sqft
last 12 mo · ≤1 miLoading sold comps…