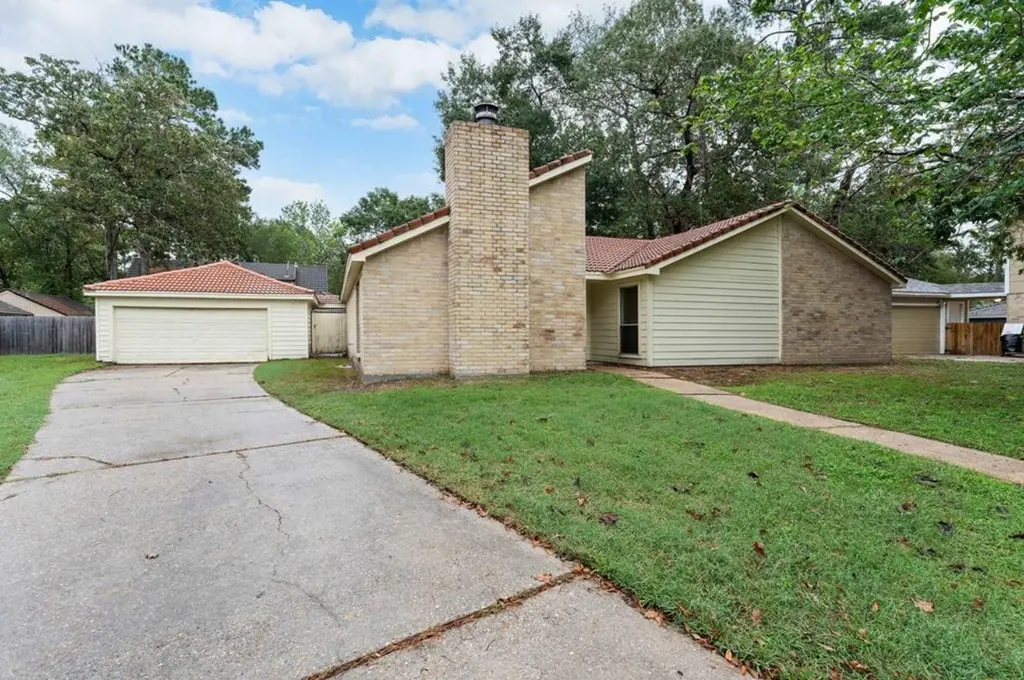
3710 Fern View Dr · Houston, TX
Flood risk 1/10 · Minimal
- FEMA flood zone
- X (unshaded)
- Chance of flooding over 30 yrs
- 0.0%
- Est. flood insurance / yr
- $507 – $1,088
Fire risk 1/10 · Minimal
- Est. fire insurance / yr
- $1,222 – $2,270
Heat risk 9/10 · Severe
- Hot days now (above 110°F)
- 7 days/yr
- Hot days in 30 yrs
- 24 days/yr
Wind risk 9/10 · Severe
- Chance of severe wind over 30 yrs
- 99.0%
Air-quality risk 3/10 · Minor
- Unhealthy air days now
- 2 days/yr
- Unhealthy air days in 30 yrs
- 3 days/yr
Risk factors via First Street. Map © Google.
Why this score? — see what drove the C grade
The composite is a weighted blend of 9 inputs, each scored 0–100. Each bar is that input's sub-score; the figure is the points it added to the 100-point composite (weight × sub-score).
- ARV discount +15.0/15.0
- Cash flow +13.8/30.0
- Appreciation +5.2/10.0
- 1% rule +4.9/10.0
- DSCR +4.2/10.0
- Schools +3.9/10.0
- Livability +3.7/5.0
- Rent growth +2.5/5.0
- Condition / age +2.5/5.0
$249,000
🖨 Deal sheet 📄 Offer letter ✓ Due diligence
Listing remarks MLS
TENANT OCCUPIED - No tours
Key facts
- 8,733 sq ft lot
- Built 1980
- Listed 415 days
Neighborhood map
What this means for you Summary
Snapshot
- This is a 4-bed/2.0-bath single-family listed at $249k.
Deal economics
- At list price, monthly cash flow is $24 ($284/yr) — positive.
- The deal already cash-flows at list — no discount required.
- To meet the 1% rule (rent ≥ 1% of price), the offer needs to be $247k (0.9% below list).
- Recommended offer: $219k (12.0% below list) — sets the bar for market timing.
- Cap rate 6.4% vs local median 3.2% in Houston — top-decile yield for the area; either an underpriced asset or a hidden risk that comps aren't pricing in. Stress-test before assuming the spread holds.
Location & tenants
- Location reads 74/100 on livability (#184 in TX, #4,771 nationally) — a middle-class / working-renter tenant base. Strengths: amenities A+, cost of living A+, housing A+; Watch: schools D, crime F.
- Humble ISD (urban): math 38% / reading 44% proficiency, ranked #262 of 826 in TX (top 32%) — families likely to look elsewhere, expect single-tenant / working-renter base with shorter leases.
- Market conditions: 184 active listings in the ZIP; 16 comparable units currently listed for rent nearby; rentals at typical pace (median 22d on market — plan ~3-4 weeks tenant-placement turnaround); high-income renter base; 29,883 units permitted in Harris County in 2024 (8,621 in 5+ unit buildings).
Forward outlook
- In year one you build about $3k of equity ($2k loan paydown + $1k appreciation (0.5% local appreciation)).
- Harris County population projected at +47% by 2050 — long-run rental-demand tailwind backs the buy-and-hold thesis.
- By year 10, paydown + projected appreciation supports a ~$33k cash-out refi (75% LTV) — recoverable capital for the next deal without selling this one.
Negotiation context
- It's been on market 415 days — a 12% lower offer ($219k) is reasonable based on typical stale-listing flexibility.
- 10 sale attempts since 3y ago; this cycle's ask is 13075% above the opening price — seller raised mid-cycle; expect resistance to lowballs.
- Current owner paid $76k; list at $249k implies a 228% gain — meaningful room to come down on a strong offer.
Risks & watch-outs
- Climate carrying-cost: severe wind risk, 99% chance of damaging wind over 30y; extreme-heat days projected 7→24/yr by 2055 (HVAC capex compounding) — expect insurance premiums to compound above CPI over the hold.
Questions for the listing agent
- It's been on market 415 days. Have you received any prior offers? Is the seller open to a 12% concession, seller financing, or rate buy-down credit?
- Why hasn't it sold? Are there any deal-killer items the seller is aware of (foundation, flood, title, zoning, code violations)?
- Is there a deadline driving the sale (1031 exchange, divorce, estate, relocation)? That informs how much negotiation room exists.
- Schools are D-rated, which usually means shorter tenancies and higher turnover. Who's the typical renter profile here, and what's been the actual vacancy rate?
- Crime grade is F in this area — have there been break-ins, vandalism, or insurance claims at this property in the last 3 years? What carrier currently insures it and at what premium?
- What's the average days-on-market for RENTAL listings here right now (not sales)? A rising rental-DOM trend means longer vacancies and softer asking-rent achievability than the comps imply.
- What's the recent tenant-quality profile in this submarket — average credit score on applications, eviction rate, late-payment / NSF rate, and stable-employment percentage? A property-management company in the area should have these aggregated.
- How much new for-sale + rental construction is in the pipeline within 1–3 miles? Heavy new supply typically softens prices + rents 12–24 months out; constrained supply supports both.
Investment metrics
- 1% rule
- 0.99% ✗
- Cap rate
- 6.41%
- Cash-on-cash
- 0.41%
- DSCR
- 1.02
- GRM
- 8.4
CMA / ARV
- ARV (median comp)
- $299,642
- List price
- $249,000
- Delta
- -16.90%
- Verdict
- UNDERPRICED
- Comps
- 20 within 1.0 mi
Show comp detail 12 sales within ~0.75 mi
| Address | Dist | Beds/Ba | Sqft | Sold | Price | $/sf | Match |
|---|---|---|---|---|---|---|---|
| 3626 Bear Lake Dr | 0.04mi | 4/2.5 | 2,052 (-12%) | 1mo | $345,000 | $168 | 75 |
| 3215 Falling Brook Dr | 0.45mi | 4/2.5 | 2,373 (+1%) | 0mo | $289,900 | $122 | 75 |
| 3618 Riverwood Park Dr | 0.06mi | 3/2.0 (-1) | 1,997 (-15%) | 1mo | $269,990 | $135 | 67 |
| 3102 Greenwood Glen Dr | 0.62mi | 4/2.5 | 2,286 (-2%) | 2mo | $369,900 | $162 | 64 |
| 3115 Knoll Manor Dr | 0.53mi | 4/2.5 | 2,485 (+6%) | 0mo | $329,900 | $133 | 63 |
| 3211 Park Garden Dr | 0.66mi | 4/2.0 | 2,233 (-5%) | 1mo | $289,999 | $130 | 61 |
| 3902 Haven Pines Dr | 0.29mi | 3/2.0 (-1) | 2,639 (+13%) | 1mo | $399,000 | $151 | 60 |
| 3311 Knoll Manor Dr | 0.37mi | 4/2.5 | 2,058 (-12%) | 2mo | $310,000 | $151 | 59 |
| 3111 Falling Brook Dr | 0.54mi | 4/2.5 | 2,624 (+12%) | 2mo | $329,000 | $125 | 51 |
| 3007 Falling Brook Dr | 0.67mi | 4/2.5 | 2,593 (+11%) | 1mo | $435,000 | $168 | 48 |
| 3907 Holly Green Ct | 0.71mi | 4/2.0 | 2,035 (-13%) | 0mo | $269,786 | $133 | 45 |
| 3126 Holly Green Dr | 0.54mi | 3/2.0 (-1) | 1,997 (-15%) | 2mo | $260,000 | $130 | 44 |
Match score weights: distance 35% · size 25% · config 20% · recency 20%. Top-matched comps best support the ARV.
Projected returns pro-forma
0.45% appreciation · 3.0% rent growth · sell at horizon
- IRR
- -0.1%
- Equity multiple
- 1.00×
- Total profit
- $-273
- Equity at exit
- $77,986
- IRR
- 5.2%
- Equity multiple
- 1.59×
- Total profit
- $41,184
- Equity at exit
- $98,407
Cash invested: $69,720 (down + closing). Projections, not guarantees.
Landlord ↔ Tenant lean methodology
- Overall (STATE)
- 87 Strongly Landlord-Friendly
- State Texas
- 87 Strongly Landlord-Friendly · R+5
- County
- — inherits STATE
- City
- — inherits STATE
ZIP-level market 77345
- Home prices YoY
- 0.2%
- Active inventory
- 184
- Price-to-rent
- 8.4×
Monthly cashflow live
- Estimated rent
- $2,467 high interval (Pro) →
- Mortgage (P&I)
- −$1,306
- Tax from tax record
- −$515 /mo · $6,185/yr
- Insurance
- −$104
- HOA
- −$0
- Vacancy / Maint / Mgmt
- −$518
- Net cashflow
- $24
Break-even live
UW: 25.0% down · 7.5% · 30yr · 1.5% tax · 5.0% vac · 8.0% maint · 8.0% mgmt
Financing live
Cash to close
- Down payment
- $62,250
- Closing costs
- $7,470
- Reserves months
- —
- Total cash needed
- —
Loan-product check · same deal, 3 products live
Conventional
25% down · 7.5% · 30yr
- Down + closing
- —
- Monthly P&I
- —
- Monthly cashflow
- —
- DSCR
- —
- Eligible?
- —
Personal DTI + credit; lowest rate.
DSCR
20% down · 8.5% · 30yr
- Down + closing
- —
- Monthly P&I
- —
- Monthly cashflow
- —
- DSCR
- —
- Eligible?
- —
No personal income docs; deal must DSCR.
Hard money
10% down · 12.0% · 12mo
- Down + closing
- —
- Monthly P&I
- —
- Monthly cashflow
- —
- DSCR
- —
- Eligible?
- —
Short-term bridge; refi at stabilization.
Rent comps 16 comps
| Address | Beds | Baths | Sqft | Rent | $/sqft | DOM | Units | Dist |
|---|---|---|---|---|---|---|---|---|
| 3619 Maple Glen Dr Kingwood, TX | 4.0 | 2.0 | 2332 | $2,149 | $0.92 | 16d | 1 | 0.24mi |
| 4535 Echo Falls Dr Kingwood, TX | 4.0 | 2.5 | 2184 | $2,145 | $0.98 | 1d | 1 | 0.47mi |
| 3334 Birch Creek Dr Kingwood, TX | 5.0 | 3.5 | 2950 | $2,695 | $0.91 | 43d | 1 | 0.61mi |
| 3102 Hickory Falls Dr Kingwood, TX | 4.0 | 2.5 | 3336 | $2,485 | $0.74 | 2d | 1 | 0.67mi |
| 3327 Sycamore Springs Dr Kingwood, TX | 3.0 | 2.0 | 1619 | $1,683 | $1.04 | 22d | 1 | 0.74mi |
| 3327 Sycamore Springs Dr Kingwood, TX | 3.0 | 2.0 | 1619 | $1,575 | $0.97 | 18d | 1 | 0.74mi |
| 3303 Sycamore Springs Dr Kingwood, TX | 4.0 | 2.5 | 2010 | $2,006 | $1.00 | 5d | 1 | 0.78mi |
| 3007 Birch Creek Dr Humble, TX | 3.0 | 2.0 | 1603 | $1,795 | $1.12 | 24d | 1 | 0.81mi |
| 3514 Creek Manor Dr Kingwood, TX | 4.0 | 2.5 | 2274 | $1,995 | $0.88 | 43d | 1 | 1.16mi |
| 9323 Darby Knoll Way Porter, TX | 4.0 | 2.5 | 2182 | $2,595 | $1.19 | 43d | 1 | 1.16mi |
| 3918 Forest Village Dr Kingwood, TX | 4.0 | 2.5 | 2354 | $2,350 | $1.00 | 24d | 1 | 1.22mi |
| 2934 Apple Forest Ct Kingwood, TX | 4.0 | 3.0 | 3224 | $2,991 | $0.93 | 43d | 1 | 1.22mi |
| 3311 Pleasant Hollow Ln Porter, TX | 5.0 | 3.5 | 3196 | $3,320 | $1.04 | 16d | 1 | 1.27mi |
| 3806 Village Oaks Dr Kingwood, TX | 4.0 | 2.5 | 2465 | $2,300 | $0.93 | 22d | 1 | 1.27mi |
| 5706 Straight Way Kingwood, TX | 4.0 | 2.5 | 2346 | $2,095 | $0.89 | 15d | 1 | 1.38mi |
| 5714 Straight Way Kingwood, TX | 3.0 | 2.0 | 1788 | $1,830 | $1.02 | 19d | 1 | 1.40mi |
Listing history 43 events
-
2026-06-18days on market $249,000 Active 415 DOM
-
2026-06-17days on market $249,000 Active 414 DOM
-
2026-06-16days on market $249,000 Active 413 DOM
-
2026-06-15days on market $249,000 Active 412 DOM
-
2026-06-13days on market $249,000 Active 410 DOM
-
2026-06-13days on market $249,000 Active 409 DOM
-
2026-06-09days on market $249,000 Active 406 DOM
-
2026-06-08days on market $249,000 Active 405 DOM
-
2026-06-07days on market $249,000 Active 404 DOM
-
2026-06-04days on market $249,000 Active 401 DOM
-
2026-06-03days on market $249,000 Active 400 DOM
-
2026-06-02days on market $249,000 Active 399 DOM
-
2026-06-01days on market $249,000 Active 398 DOM
-
2026-05-31days on market $249,000 Active 397 DOM
-
2025-08-13price $249,000 26-char remark
Show marketing remark (26 chars)
TENANT OCCUPIED - No tours
-
2025-08-09historical $1,890
-
2025-08-09$1,890
-
2025-08-05historical $1,890
-
2025-07-19price $259,000 26-char remark
Show marketing remark (26 chars)
TENANT OCCUPIED - No tours
-
2025-07-11$1,890
-
2025-04-29$295,000 Active 26-char remark
Show marketing remark (26 chars)
TENANT OCCUPIED - No tours
-
2024-12-19historical
-
2024-10-09historical $1,990
-
2024-07-31$249,990 Active
-
2024-06-20$1,990
-
2024-05-02historical $1,799
-
2024-05-01historical
-
2024-03-22price $1,799
-
2024-03-21price $249,999
-
2024-02-06price $1,999
-
2024-02-05$269,999 Active
-
2024-02-05historical
-
2023-12-28price $274,999
-
2023-12-08status Active
-
2023-12-07status Pending
-
2023-11-29status Option Pending
-
2023-11-03$2,200
-
2023-11-02$286,000 Active
-
2023-05-22historical
-
2023-01-31$290,000 Active
-
2021-06-18soldstatus $76,000
-
1993-01-06soldstatus
-
1989-04-01soldstatus $87,900
ⓘ Source: listings_history table (triggers on properties + properties_extension) + one-shot
backfill from property_details.listing_events for pre-trigger history.
Tax reassessment forecast TX · Resets to sale price
- Current annual tax
- $6,185 · $515/mo
- Projected year-2 tax
- $6,185 · $515/mo
- Expected delta
- $0/yr ($0/mo · 0.0%)
ⓘ Screening estimate from a state-policy table — verify with the county assessor before closing.
Climate risk First Street
- Flood 1/10 Low FEMA zone X (unshaded) · 0% chance over 30 yrs
- Wildfire 1/10 Low
- Heat 9/10 Extreme 7 d/yr ≥110°F today · 24 d/yr by 30 yrs out
- Wind 9/10 Extreme 99% chance of damaging wind over 30 yrs
- Air quality 3/10 Moderate 2 unhealthy d/yr today · 3 by 30 yrs out
Nearby sold comps map
Loading sold comps map…
Walkable amenities ~0.75 mi
Loading nearby amenities…
Taxation est. · year 1
- Rental income
- $29,599
- − Mortgage interest
- −$13,948
- − Property taxes
- −$6,185
- − Insurance
- −$1,245
- − Repairs & maintenance
- −$2,368
- − Management
- −$2,368
- − Depreciation
- −$7,244
- Taxable loss
- −$3,758
- Est. tax savings @ 24.0%
- +$902
- After-tax cash flow
- $1,186/yr
For passive investors: Depreciation is non-cash, so a rental often shows a tax loss while cash-flowing — sheltering income. Rental losses are passive: they offset passive income freely, and up to $25,000/yr can offset ordinary (W-2) income if you actively participate and your MAGI is under $100k (phasing out to $0 by $150k); unused losses carry forward. On sale, claimed depreciation is recaptured at up to 25%, and gains may owe capital-gains tax (a 1031 exchange can defer both). Figures are a year-1 estimate at your 24.0% rate — not tax advice; consult a CPA.
Schools (NCES district)
- District
- Humble ISD
- NCES district ID
- 4823910
- Math proficiency
- 38% ▼ -11.00%
- Reading proficiency
- 44% ▼ -7.00%
- Median HH income
- $83,946
- Composite
- 38.55/100
- National rank
- #4171
- State rank
- #262 of 826 in TX
Livability — Houston
- Score
- 74/100
- State rank
- #184
- US rank
- #4771
Category grades
Schools grade is shown separately in the Schools card above.
Census & demographics
- Census place
- Houston, TX
- County
- Harris County · 4,702,590 people
- City population
- 3,226,434
- Metro
- Houston-The Woodlands-Sugar Land, TX
- Population (ZIP)
- 27,917
- Household income
- $150,742
- Rent vs Own
- Severe rent burden
- 307.0
Population outlook (Harris County) Hauer SSP2
- Today (2025)
- 5,571,493 people
- By 2030
- 6,089,821 · +9.3%
- By 2040
- 7,142,806 · +28.2%
- By 2050
- 8,185,864 · +46.9%
- By 2075
- 10,574,329 · +89.8%
- By 2100
- 12,109,958 · +117.4%
Race, ethnicity, and origin ACS 2023
- Neighborhood character
- Predominantly White (76%)
- Race & ethnicity
- White 76% Hispanic / Latino 14% Two or more races 10% Asian 3% Black 3%
- Hispanic origin (detail)
- Mexican 10%
- Common ancestry
- Lithuanian 6% Italian 4% Slovak 3%
- Foreign-born
- 8% · Canada, China, Dominican Republic
- Languages at home
- 89% English-only · Spanish 7% Other Indo-European 1% Other Asian/Pacific 1%
Political lean MEDSL · Harris
- 2024 margin
- Lean D (+5.5) · D 52.0% · R 46.4% · Other 1.6%
- 2008→2024 swing
- +3.9pp toward D · 2008: 1.6pp · 2024: 5.5pp
- All cycles
- 2024: D+5.5 2020: D+13.3 2016: D+12.4 2012: D+0.1 2008: D+1.6
Not yet ingested
- Civics
- —
Market trends
- HPI YoY
- ▲ 0.45%
- Current HPI
- 210.6244
- Rent YoY
- —
- Metro
- Houston-The Woodlands-Sugar Land, TX
- State GDP YoY
- ▲ 3.95%
- F500 in state
- 110
Industry mix (Fortune 500 HQ in TX)
| Industry | F500 HQs | Revenue |
|---|---|---|
| Energy | 16 | $1,198B |
|
||
| Technology | 5 | $198B |
|
||
| Engineering / Construction | 4 | $72B |
|
||
| Energy Services | 3 | $60B |
|
||
| Utilities | 3 | $41B |
|
||
| Healthcare | 2 | $330B |
|
||
Price history
+183.3% since first listed29 events — show timeline
- 2025-08-13 Price Changed $249,000 HARMLS
- 2025-08-09 Rental Removed $1,890 HARMLS
- 2025-08-09 Listed for Rent $1,890 HARMLS
- 2025-08-05 Rental Removed $1,890 HARMLS
- 2025-07-19 Price Changed $259,000 HARMLS
- 2025-07-11 Listed for Rent $1,890 HARMLS
- 2025-04-29 Listed $295,000 HARMLS
- 2024-12-19 Listing Removed — HARMLS
- 2024-10-09 Rental Removed $1,990 HARMLS
- 2024-07-31 Listed $249,990 HARMLS
- 2024-06-20 Listed for Rent $1,990 HARMLS
- 2024-05-02 Rental Removed $1,799 HARMLS
- 2024-05-01 Listing Removed — HARMLS
- 2024-03-22 Price Changed $1,799 HARMLS
- 2024-03-21 Price Changed $249,999 HARMLS
- 2024-02-06 Price Changed $1,999 HARMLS
- 2024-02-05 Listing Removed — HARMLS
- 2024-02-05 Listed $269,999 HARMLS
- 2023-12-28 Price Changed $274,999 HARMLS
- 2023-12-08 Relisted — HARMLS
- 2023-12-07 Pending — HARMLS
- 2023-11-29 Pending — HARMLS
- 2023-11-03 Listed for Rent $2,200 HARMLS
- 2023-11-02 Listed $286,000 HARMLS
- 2023-05-22 Listing Removed — HARMLS
- 2023-01-31 Listed $290,000 HARMLS
- 2021-06-18 Sold (Public Records) $76,000 Public Records
- 1993-01-06 Sold (Public Records) — Public Records
- 1989-04-01 Sold (Public Records) $87,900 Public Records
Property tax history
+6.7%/yrLatest (2025): $6,185 · -2.1% YoY. Source: county tax records.
Cash-flow waterfall
monthlySold comps — $/sqft
last 12 mo · ≤1 miLoading sold comps…