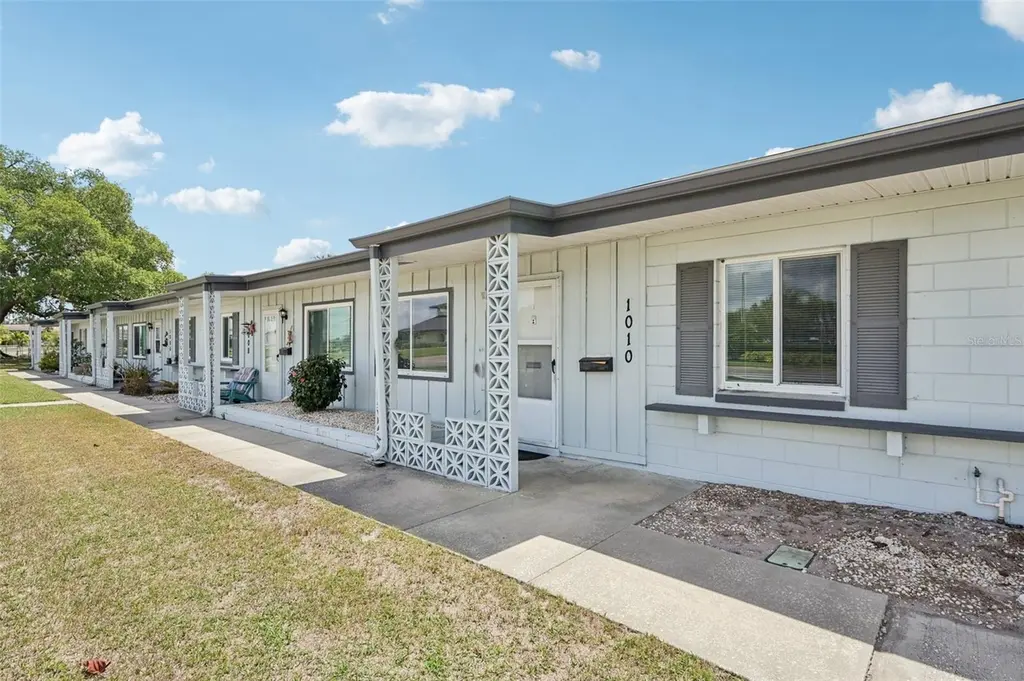
1010 N Pebble Beach Blvd · Sun City Center, FL
Flood risk 1/10 · Minimal
- FEMA flood zone
- X (unshaded)
- Chance of flooding over 30 yrs
- 0.0%
- Est. flood insurance / yr
- $507 – $1,088
Fire risk 4/10 · Minor
- Est. fire insurance / yr
- $947 – $1,759
Heat risk 10/10 · Severe
- Hot days now (above 109°F)
- 7 days/yr
- Hot days in 30 yrs
- 28 days/yr
Wind risk 9/10 · Severe
- Chance of severe wind over 30 yrs
- 99.0%
Air-quality risk 3/10 · Minor
- Unhealthy air days now
- 3 days/yr
- Unhealthy air days in 30 yrs
- 3 days/yr
Risk factors via First Street. Map © Google.
Why this score? — see what drove the C- grade
The composite is a weighted blend of 9 inputs, each scored 0–100. Each bar is that input's sub-score; the figure is the points it added to the 100-point composite (weight × sub-score).
- Cash flow +15.9/30.0
- ARV discount +7.5/15.0
- 1% rule +7.0/10.0
- DSCR +4.9/10.0
- Schools +4.2/10.0
- Livability +3.9/5.0
- Appreciation +3.4/10.0
- Rent growth +3.2/5.0
- Condition / age +2.5/5.0
$139,900
🖨 Deal sheet 📄 Offer letter ✓ Due diligence
Listing remarks MLS
This unit has been freshly painted and baseboards updated. New high grade laminate installed thru out . All in up to date colors. All new counter tops. New sink and tub enclosure. Private enclosed patio in back. In walking distance to the community campus, with its library, pools, clubs, exercise room and meeting rooms and restaurant.
Key facts
- Easy access
- Clean tub enclosure
- New sink
Tags
Property features AI
Finance
- Other: Home warranty included
- Financial info: Total monthly fees listed as about $228.83; Total annual fees listed as about $2,746; Lease restrictions apply
- HOA & community: HOA required (First Pebble Beach, POA); Monthly HOA approximately $200; Quarterly association fee approximately $600; Association approval required; HOA includes pool, management, and recreational facilities; Community amenities: fitness center, pool, golf, tennis courts, recreation facilities; Deed restrictions and special community restrictions; Golf carts allowed; Handicap modified accommodations; Pet restrictions apply (number and size limits)
Exterior
- Parking: Attached garage (1 car); Garage faces rear
- Utilities: Public water; Public sewer; Cable available; Electricity available
- Home design: Residential townhouse; Single-story; Faces northeast
- Construction: Block and stucco construction; Built-up roof; Slab foundation; Built in 1010 (building number noted)
- Exterior features: Covered front porch; Sidewalk; Sliding doors; Mature landscaping; Level lot; City limits location; In-county location; Asphalt road frontage
Interior
- Kitchen: Microwave; Range; Refrigerator
- Bedrooms: 2 bedrooms
- Flooring: Laminate flooring
- Bathrooms: 1 full bathroom
- Heating & cooling: Central heating; Central air conditioning
- Interior features: Ceiling fans; Eat-in kitchen; Kitchen/family room combo; Living room/dining room combo; Open floorplan; Inside utility room
- Laundry & utility: Laundry room inside
Neighborhood map
What this means for you Summary
Snapshot
- This is a 2-bed/1.0-bath townhouse listed at $140k.
Deal economics
- At list price, monthly cash flow is $66 ($791/yr) — positive.
- The deal already cash-flows at list — no discount required.
- Meets the 1% rule at list price ($2k rent vs $140k).
- Recommended offer: $136k (3.0% below list) — sets the bar for market timing.
Location & tenants
- Location reads 78/100 on livability (#178 in FL, #2,736 nationally) — a middle-class / working-renter tenant base. Strengths: housing A+, health & safety A+, crime B+; Watch: schools D+, amenities F.
- Hillsborough (suburban): math 47% / reading 50% proficiency, ranked #41 of 73 in FL (top 56%) — families likely to look elsewhere, expect single-tenant / working-renter base with shorter leases.
- Market conditions: Rents rising (+2.6%/yr); 602 active listings in the ZIP; 27 comparable units currently listed for rent nearby; rentals at typical pace (median 22d on market — plan ~3-4 weeks tenant-placement turnaround); 9,053 units permitted in Hillsborough County in 2024 (4,555 in 5+ unit buildings).
Forward outlook
- Local home prices are declining (-3.0%/yr); year-one equity from $967 of loan paydown is wiped out by about $4k of value loss. Plan a longer hold.
- Hillsborough County population projected at +37% by 2050 — long-run rental-demand tailwind backs the buy-and-hold thesis.
Negotiation context
- It's been on market 46 days — a 3% lower offer ($136k) is reasonable based on typical stale-listing flexibility.
- 4 sale attempts since 20y ago with the ask held roughly flat each time — persistent listings suggest the price (not the market) is what's stuck; bring a comps-based counter.
- Current owner paid $95k; 47% above their basis — modest negotiation headroom, anchor on the comps not their cost.
Risks & watch-outs
- Climate carrying-cost: severe wind risk, 99% chance of damaging wind over 30y; extreme-heat days projected 7→28/yr by 2055 (HVAC capex compounding) — expect insurance premiums to compound above CPI over the hold.
Questions for the listing agent
- It's been on market 46 days. Have you received any prior offers? Is the seller open to a 3% concession, seller financing, or rate buy-down credit?
- Built in 1962 — when were the roof, HVAC, electrical panel, plumbing, and water heater last replaced?
- What does the HOA fee cover, when was the last increase, and are there any pending special assessments or reserve-fund shortfalls?
- Is there a deadline driving the sale (1031 exchange, divorce, estate, relocation)? That informs how much negotiation room exists.
- Schools are D-rated, which usually means shorter tenancies and higher turnover. Who's the typical renter profile here, and what's been the actual vacancy rate?
- What's the average days-on-market for RENTAL listings here right now (not sales)? A rising rental-DOM trend means longer vacancies and softer asking-rent achievability than the comps imply.
- What's the recent tenant-quality profile in this submarket — average credit score on applications, eviction rate, late-payment / NSF rate, and stable-employment percentage? A property-management company in the area should have these aggregated.
- How much new for-sale + rental construction is in the pipeline within 1–3 miles? Heavy new supply typically softens prices + rents 12–24 months out; constrained supply supports both.
Investment metrics
- 1% rule
- 1.20% ✓
- Cap rate
- 6.86%
- Cash-on-cash
- 2.02%
- DSCR
- 1.09
- GRM
- 7.0
CMA / ARV
No comps found within radius.
Projected returns pro-forma
-3.0% appreciation · 2.65% rent growth · sell at horizon
- IRR
- -13.4%
- Equity multiple
- 0.52×
- Total profit
- $-18,857
- Equity at exit
- $20,860
- IRR
- -5.0%
- Equity multiple
- 0.68×
- Total profit
- $-12,583
- Equity at exit
- $12,096
Cash invested: $39,172 (down + closing). Projections, not guarantees.
Landlord ↔ Tenant lean methodology
- Overall (STATE)
- 87 Strongly Landlord-Friendly
- State Florida
- 87 Strongly Landlord-Friendly · R+3
- County
- — inherits STATE
- City
- — inherits STATE
ZIP-level market 33573
- Home prices YoY
- -1.2%
- Rents YoY
- 2.6%
- Active inventory
- 602
- Price-to-rent
- 7.0×
Monthly cashflow live
- Estimated rent
- $1,677 high interval (Pro) →
- Mortgage (P&I)
- −$734
- Tax from tax record
- −$239 /mo · $2,868/yr
- Insurance
- −$58
- HOA
- −$228
- Vacancy / Maint / Mgmt
- −$352
- Net cashflow
- $66
Break-even live
UW: 25.0% down · 7.5% · 30yr · 1.5% tax · 5.0% vac · 8.0% maint · 8.0% mgmt
Financing live
Cash to close
- Down payment
- $34,975
- Closing costs
- $4,197
- Reserves months
- —
- Total cash needed
- —
Loan-product check · same deal, 3 products live
Conventional
25% down · 7.5% · 30yr
- Down + closing
- —
- Monthly P&I
- —
- Monthly cashflow
- —
- DSCR
- —
- Eligible?
- —
Personal DTI + credit; lowest rate.
DSCR
20% down · 8.5% · 30yr
- Down + closing
- —
- Monthly P&I
- —
- Monthly cashflow
- —
- DSCR
- —
- Eligible?
- —
No personal income docs; deal must DSCR.
Hard money
10% down · 12.0% · 12mo
- Down + closing
- —
- Monthly P&I
- —
- Monthly cashflow
- —
- DSCR
- —
- Eligible?
- —
Short-term bridge; refi at stabilization.
Rent comps 27 comps
| Address | Beds | Baths | Sqft | Rent | $/sqft | DOM | Units | Dist |
|---|---|---|---|---|---|---|---|---|
| 1301 Warwick Ct Unit 1301 Sun City Center, FL | 1.0 | 1.0 | 1102 | $1,575 | $1.43 | 24d | 1 | 0.21mi |
| 207 Islip Way Sun City Center, FL | 2.0 | 1.5 | 992 | $1,500 | $1.51 | 18d | 1 | 0.34mi |
| 1802 Bedford Ter #182 Sun City Center, FL | 1.0 | 1.5 | 800 | $1,400 | $1.75 | 18d | 1 | 0.54mi |
| 1802 Bedford Ter #182 Sun City Center, FL | 1.0 | 1.5 | 960 | $1,375 | $1.43 | 22d | 1 | 0.54mi |
| 1802 Bedford Ln Sun City Center, FL | 1.0–2.0 | 2.0 | 952 | $1,800 | $1.89 | 11d | 2 | 0.57mi |
| 201 Bedford St #95 Sun City Center, FL | 1.0 | 1.5 | 800 | $1,450 | $1.81 | 15d | 1 | 0.60mi |
| 201 Kings Blvd #19 Sun City Center, FL | 1.0 | 1.5 | 800 | $1,495 | $1.87 | 24d | 1 | 0.60mi |
| 202 Bedford Trl #99 Sun City Center, FL | 1.0 | 1.0 | 800 | $1,500 | $1.88 | 5d | 1 | 0.64mi |
| 201 Bedford Trl Unit F128 Sun City Center, FL | 2.0 | 2.0 | 960 | $1,275 | $1.33 | 24d | 1 | 0.66mi |
| 1901 Andover Way #38 Sun City Center, FL | 1.0 | 1.5 | 800 | $1,495 | $1.87 | 24d | 1 | 0.67mi |
| 704 Torrey Pines Ave Sun City Center, FL | 2.0 | 1.0 | 981 | $1,675 | $1.71 | 24d | 1 | 0.69mi |
| 704 Torrey Pines Ave Sun City Center, FL | 2.0 | 1.0 | 981 | $1,700 | $1.73 | 15d | 1 | 0.69mi |
| 306 Fowling Ct Sun City Center, FL | 2.0 | 2.0 | 960 | $1,700 | $1.77 | 24d | 1 | 0.72mi |
| 1814 Foxhunt Dr Unit A Sun City Center, FL | 1.0 | 1.5 | 800 | $1,475 | $1.84 | 24d | 1 | 0.75mi |
| 403 Finchley Ct Unit B Sun City Center, FL | 2.0 | 2.0 | 960 | $2,000 | $2.08 | 24d | 1 | 0.78mi |
| 101 Cambridge Trl Sun City Center, FL | 1.0–2.0 | 1.5–2.0 | 880 | $1,650 | $1.88 | 11d | 1 | 0.78mi |
| 409 Feltham Trl Unit B Sun City Center, FL | 2.0 | 2.0 | 984 | $1,650 | $1.68 | 24d | 1 | 0.81mi |
| 301 Kings Blvd #138 Sun City Center, FL | 1.0 | 1.5 | 1020 | $1,800 | $1.76 | 22d | 1 | 0.86mi |
| 2202 Clubhouse Dr #169 Sun City Center, FL | 2.0 | 2.0 | 984 | $1,450 | $1.47 | 5d | 1 | 0.87mi |
| 2202 Clubhouse Dr #187 Sun City Center, FL | 1.0 | 1.5 | 800 | $1,550 | $1.94 | 24d | 1 | 0.87mi |
| 302 Canton Ct #62 Sun City Center, FL | 1.0 | 1.5 | 800 | $1,575 | $1.97 | 18d | 1 | 1.01mi |
| 323 Knottwood Ct #1 Sun City Center, FL | 1.0 | 1.0 | 908 | $1,090 | $1.20 | 5d | 1 | 1.09mi |
| 323 Knottwood Ct Sun City Center, FL | 1.0 | 1.0 | 908 | $1,290 | $1.42 | 24d | 1 | 1.09mi |
| 2345 Glenmore Cir Unit 294 Sun City Center, FL | 2.0 | 2.0 | 984 | $1,500 | $1.52 | 24d | 1 | 1.15mi |
| 1902 Dandridge St #12 Sun City Center, FL | 1.0 | 1.5 | 800 | $1,495 | $1.87 | 14d | 1 | 1.21mi |
| 704 Tremont Greens Ln Unit 107 Sun City Center, FL | 2.0 | 2.0 | 974 | $1,700 | $1.75 | 24d | 1 | 1.39mi |
| 4902 Cosmos Cir Wimauma, FL | 3.0 | 1.0–3.5 | 1231 | $2,348 | $1.91 | 2d | 39 | 1.41mi |
HOA detail
- Monthly dues
- $228 · $2,736/yr
- Likely covers
- pool
Listing history 7 events
-
2026-06-18days on market $139,900 Active 46 DOM
-
2026-06-17days on market $139,900 Active 45 DOM
-
2026-06-16days on market $139,900 Active 44 DOM
-
2026-06-15days on market $139,900 Active 43 DOM
-
2026-06-13days on market $139,900 Active 41 DOM
-
2026-06-13remarks 693-char remark
-
2026-06-13$139,900 Active 40 DOM
ⓘ Source: listings_history table (triggers on properties + properties_extension) + one-shot
backfill from property_details.listing_events for pre-trigger history.
Tax reassessment forecast FL · Resets to sale price
- Current annual tax
- $2,868 · $239/mo
- Projected year-2 tax
- $2,868 · $239/mo
- Expected delta
- $0/yr ($0/mo · 0.0%)
ⓘ Screening estimate from a state-policy table — verify with the county assessor before closing.
Climate risk First Street
- Flood 1/10 Low FEMA zone X (unshaded) · 0% chance over 30 yrs
- Wildfire 4/10 Moderate
- Heat 10/10 Extreme 7 d/yr ≥109°F today · 28 d/yr by 30 yrs out
- Wind 9/10 Extreme 99% chance of damaging wind over 30 yrs
- Air quality 3/10 Moderate 3 unhealthy d/yr today · 3 by 30 yrs out
Nearby sold comps map
Loading sold comps map…
Walkable amenities ~0.75 mi
Loading nearby amenities…
Taxation est. · year 1
- Rental income
- $20,124
- − Mortgage interest
- −$7,837
- − Property taxes
- −$2,868
- − Insurance
- −$700
- − Repairs & maintenance
- −$1,610
- − Management
- −$1,610
- − HOA
- −$2,736
- − Depreciation
- −$4,070
- Taxable loss
- −$1,306
- Est. tax savings @ 24.0%
- +$313
- After-tax cash flow
- $1,104/yr
For passive investors: Depreciation is non-cash, so a rental often shows a tax loss while cash-flowing — sheltering income. Rental losses are passive: they offset passive income freely, and up to $25,000/yr can offset ordinary (W-2) income if you actively participate and your MAGI is under $100k (phasing out to $0 by $150k); unused losses carry forward. On sale, claimed depreciation is recaptured at up to 25%, and gains may owe capital-gains tax (a 1031 exchange can defer both). Figures are a year-1 estimate at your 24.0% rate — not tax advice; consult a CPA.
Schools (NCES district)
- District
- Hillsborough
- NCES district ID
- 1200870
- Math proficiency
- 47% ▼ -8.00%
- Reading proficiency
- 50% ▼ -4.00%
- Median HH income
- $50,622
- Composite
- 41.6/100
- National rank
- #3435
- State rank
- #41 of 73 in FL
Livability — Sun City Center
- Score
- 78/100
- State rank
- #178
- US rank
- #2736
Category grades
Schools grade is shown separately in the Schools card above.
Census & demographics
- Census place
- Sun City Center, FL
- County
- Hillsborough County · 1,540,968 people
- City population
- 35,362
- Metro
- Tampa-St. Petersburg-Clearwater, FL
- Population (ZIP)
- 35,362
- Household income
- $72,834
- Rent vs Own
- Severe rent burden
- 1382.0
Population outlook (Hillsborough County) Hauer SSP2
- Today (2025)
- 1,607,022 people
- By 2030
- 1,733,968 · +7.9%
- By 2040
- 1,979,565 · +23.2%
- By 2050
- 2,203,427 · +37.1%
- By 2075
- 2,667,893 · +66.0%
- By 2100
- 2,891,558 · +79.9%
Race, ethnicity, and origin ACS 2023
- Neighborhood character
- Predominantly White (73%)
- Race & ethnicity
- White 73% Hispanic / Latino 13% Two or more races 11% Black 10% Asian 1%
- Hispanic origin (detail)
- Mexican 1% Puerto Rican 6% Cuban 2%
- Common ancestry
- Romanian 3% Lithuanian 3% Slovak 2%
- Foreign-born
- 8% · Canada, Vietnam
- Languages at home
- 86% English-only · Spanish 10% French/Haitian/Cajun 1% German/W. Germanic 1%
Political lean MEDSL · Hillsborough
- 2024 margin
- Toss-up / Even · D 47.8% · R 50.9% · Other 1.3%
- 2008→2024 swing
- -10.2pp toward R · 2008: 7.1pp · 2024: -3.1pp
- All cycles
- 2024: R+3.1 2020: D+6.9 2016: D+6.8 2012: D+6.7 2008: D+7.1
Not yet ingested
- Civics
- —
Market trends
- HPI YoY
- ▼ -3.27%
- Current HPI
- 272.9767
- Rent YoY
- ▲ 2.65%
- Metro
- Tampa-St. Petersburg-Clearwater, FL
- State GDP YoY
- ▲ 3.28%
- F500 in state
- 36
Industry mix (Fortune 500 HQ in FL)
| Industry | F500 HQs | Revenue |
|---|---|---|
| Industrial Technology | 2 | $29B |
|
||
| Insurance | 2 | $17B |
|
||
| Retail | 1 | $60B |
|
||
| Technology Distribution | 1 | $58B |
|
||
| Homebuilding | 1 | $35B |
|
||
| Technology Manufacturing | 1 | $35B |
|
||
Price history
+268.2% since first listed12 events — show timeline
- 2026-06-10 Relisted — Stellar MLS as Distributed by MLS Grid
- 2026-04-02 Listed $139,900 Stellar MLS as Distributed by MLS Grid
- 2020-06-27 Contingent — Stellar MLS as Distributed by MLS Grid
- 2020-05-29 Sold (Public Records) $95,000 Public Records
- 2020-05-20 Sold (MLS) $95,000 Stellar MLS as Distributed by MLS Grid
- 2020-03-27 Pending — Stellar MLS as Distributed by MLS Grid
- 2020-03-05 Listed $95,000 Stellar MLS as Distributed by MLS Grid
- 2011-11-01 Sold (Public Records) $49,000 Public Records
- 2006-05-24 Sold (Public Records) $78,500 Public Records
- 2006-04-28 Sold (MLS) $78,500 Stellar MLS as Distributed by MLS Grid
- 2006-03-28 Listed $78,900 Stellar MLS as Distributed by MLS Grid
- 1994-04-20 Sold (Public Records) $38,000 Public Records
Property tax history
+14.6%/yrLatest (2025): $2,868 · +14.3% YoY. Source: county tax records.
Cash-flow waterfall
monthlySold comps — $/sqft
last 12 mo · ≤1 miLoading sold comps…