 Duplex
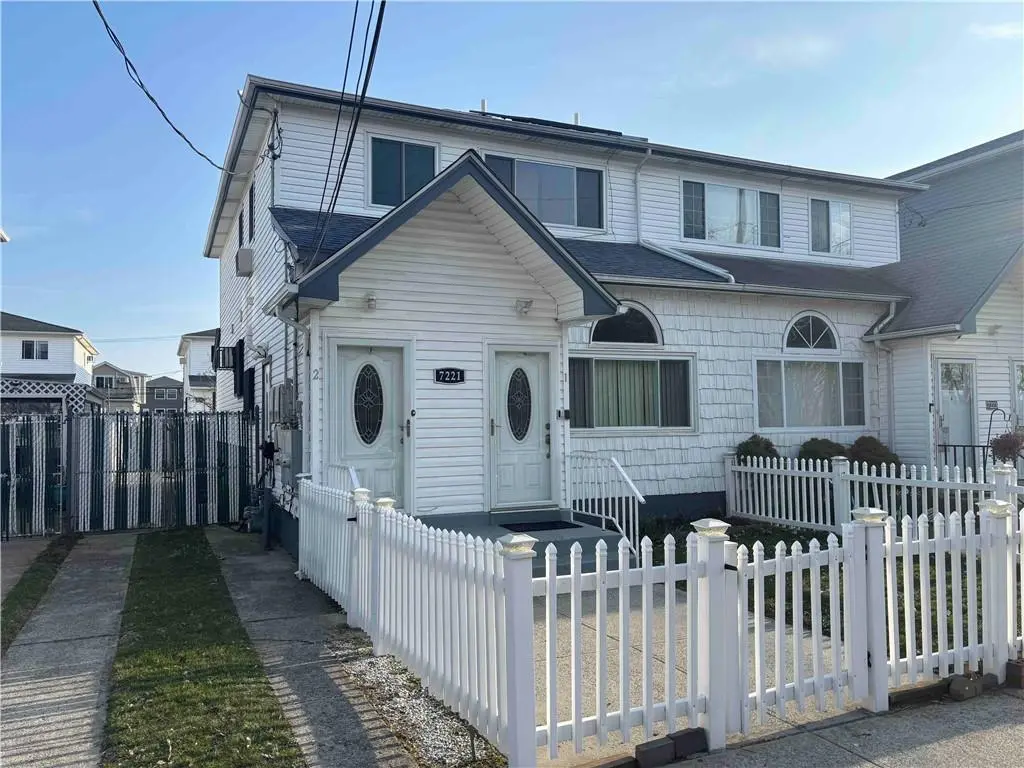
7221 Hillmeyer Ave · New York, NY
Flood risk 8/10 · Major
- FEMA flood zone
- AE
- Chance of flooding over 30 yrs
- 0.99%
- Est. flood insurance / yr
- $1,737 – $8,500
Fire risk 1/10 · Minimal
- Est. fire insurance / yr
- $691 – $1,283
Heat risk 6/10 · Moderate
- Hot days now (above 96°F)
- 7 days/yr
- Hot days in 30 yrs
- 16 days/yr
Wind risk 6/10 · Moderate
- Chance of severe wind over 30 yrs
- 77.0%
Air-quality risk 3/10 · Minor
- Unhealthy air days now
- 4 days/yr
- Unhealthy air days in 30 yrs
- 4 days/yr
Risk factors via First Street. Map © Google.
Why this score? — see what drove the B- grade
The composite is a weighted blend of 9 inputs, each scored 0–100. Each bar is that input's sub-score; the figure is the points it added to the 100-point composite (weight × sub-score).
- Cash flow +22.4/30.0
- Appreciation +10.0/10.0
- ARV discount +9.7/15.0
- DSCR +7.2/10.0
- Schools +5.0/10.0
- 1% rule +4.9/10.0
- Livability +3.8/5.0
- Rent growth +2.5/5.0
- Condition / age +2.5/5.0
$699,000
🖨 Deal sheet 📄 Offer letter ✓ Due diligence
Multi-family units
County records classify this as Multi-Family (2-4 Unit). Listing-text estimate: 2 units. confirmed
Listing remarks
Welcome to a fully renovated, move-in ready two-family home offering flexibility, efficiency, and immediate income potential. Both units are vacant and newly updated, making this the perfect opportunity for an end-user looking to live in one unit while generating passive income from the other — or for an investor seeking a turnkey rental property. This property features: • Two renovated units ready for immediate occupancy • Solar panels for improved energy efficiency • Tankless hot water system • Private driveway • Private backyard space • Separate entrances for added privacy Whether you're looking to offset your mortgage with rental income or expand yo
Key facts
- Renovated units
- Private driveway
- Solar panels
Tags
Property features AI
Finance
- Financial info: Financing available: bank mortgage, cash, exchange considered
Exterior
- Parking: Private drive with 2 parking spaces
- Utilities: 200 Amp electric service; Tankless hot water; Radiant heating (baseboard delivery)
- Home design: Semi-detached residential building; 2-unit building
- Construction: Block and wood frame construction; Siding exterior; Shingle roof; Slab concrete foundation
- Exterior features: Front yard; Back yard; Partially fenced
Interior
- Kitchen: Oven/Range; Refrigerator
- Bedrooms: Unit 1 (1st floor): 3 bedrooms; Unit 2 (2nd floor): 2 bedrooms
- Flooring: Carpeting; Laminate floors; Tile floors
- Bathrooms: Unit 1: 1 full bath; Unit 2: 1 full bath; Total full baths: 2
- Heating & cooling: Radiant heating with baseboard delivery; Tankless hot water
- Interior features: Refrigerator; Stove
- Laundry & utility: No central AC units listed
Neighborhood map
What this means for you Summary
Snapshot
- This is a 2 × 2-bed/1.0-bath units multifamily listed at $699k.
Deal economics
- At list price, monthly cash flow is $740 ($9k/yr) — positive. Per door: $370/mo.
- The deal already cash-flows at list — no discount required.
- To meet the 1% rule (rent ≥ 1% of price), the offer needs to be $694k (0.7% below list).
- Recommended offer: $694k (0.7% below list) — sets the bar for 1% rule.
- Cap rate 8.3% vs local median 2.6% in New York — top-decile yield for the area; either an underpriced asset or a hidden risk that comps aren't pricing in. Stress-test before assuming the spread holds.
Location & tenants
- Location reads 75/100 on livability (#268 in NY, #4,188 nationally) — a middle-class / working-renter tenant base. Strengths: amenities A+, commute A+, health & safety A; Watch: crime F, cost of living F.
- Market conditions: 80 active listings in the ZIP; 5 comparable units currently listed for rent nearby; rentals at typical pace (median 24d on market — plan ~3-4 weeks tenant-placement turnaround); 5,302 units permitted in Queens County in 2024 (4,918 in 5+ unit buildings).
- At $6,939/mo this rent would consume 167% of the median local household income ($50k/yr) (locally 1734% of renters already pay >50% of income on rent) — very limited rent-growth headroom before tenants either downsize or default.
Forward outlook
- In year one you build about $75k of equity ($5k loan paydown + $70k appreciation (10.0% local appreciation)).
- Queens County population projected at +16% by 2050 — long-run rental-demand tailwind backs the buy-and-hold thesis.
- At projected returns (10.0% appreciation + 3.0% rent growth), your $196k cash investment doubles in ~3 years — after that, you're playing with house money.
- By year 2, paydown + projected appreciation supports a ~$120k cash-out refi (75% LTV) — recoverable capital for the next deal without selling this one.
Negotiation context
- Only 1 days on market — expect competitive offers; lowballing is unlikely to land.
- 3 sale attempts; this cycle's ask has dropped $100k (13%) from the opening price — seller is motivated, your offer sets the floor, not the list.
- Current owner paid $211k; list at $699k implies a 231% gain — meaningful room to come down on a strong offer.
Risks & watch-outs
- Watch-outs: flood insurance adds $427/mo.
- Climate carrying-cost: in FEMA flood zone AE (mandatory federal flood insurance); major wind risk, 77% chance of damaging wind over 30y; extreme-heat days projected 7→16/yr by 2055 (HVAC capex compounding) — expect insurance premiums to compound above CPI over the hold.
Questions for the listing agent
- Can we see the unit-by-unit rent roll, current vacancy, and any below-market leases? What's the average tenancy length?
- What capital expenditures (roof, boiler, parking lot, exteriors) have been made in the last 5 years, and what's planned in the next 2?
- What's the actual annual flood-insurance premium (NFIP or private), and is the property in a SFHA with mandatory coverage?
- Is there a deadline driving the sale (1031 exchange, divorce, estate, relocation)? That informs how much negotiation room exists.
- Schools are B-rated — typically a magnet for longer-tenancy family renters. What's the average tenant stay here, and is there a school-zone premium baked into asking?
- Crime grade is F in this area — have there been break-ins, vandalism, or insurance claims at this property in the last 3 years? What carrier currently insures it and at what premium?
- What's the average days-on-market for RENTAL listings here right now (not sales)? A rising rental-DOM trend means longer vacancies and softer asking-rent achievability than the comps imply.
- What's the recent tenant-quality profile in this submarket — average credit score on applications, eviction rate, late-payment / NSF rate, and stable-employment percentage? A property-management company in the area should have these aggregated.
- How much new apartment / multifamily construction is in the pipeline within 1–3 miles? Heavy new supply (>2% of stock underway) typically softens rents 12–24 months out; light construction supports rent growth.
Investment metrics
- 1% rule
- 0.99% ✗
- Cap rate
- 8.30%
- Cash-on-cash
- 7.15%
- DSCR
- 1.32
- GRM
- 8.4
CMA / ARV
- ARV (on-the-fly)
- $734,367
- Comps found
- 7
Show comp detail 7 sales within ~0.75 mi
| Address | Dist | Beds/Ba | Sqft | Sold | Price | $/sf | Match |
|---|---|---|---|---|---|---|---|
| 618 Beach 67th St | 0.29mi | 4/2.0 | 1,946 (-3%) | 12mo | $715,000 | $367 | 72 |
| 69-43 Thursby Ave | 0.21mi | 5/2.0 (+1) | 2,068 (+3%) | 11mo | $810,000 | $392 | 70 |
| 6235 Burchell Rd | 0.50mi | 5/3.0 (+1) | 2,000 (-0%) | 5mo | $867,347 | $434 | 64 |
| 345 Beach 73rd St | 0.35mi | 5/2.0 (+1) | 1,926 (-4%) | 13mo | $550,000 | $286 | 62 |
| 609 Beach 63rd St | 0.47mi | 5/2.0 (+1) | 2,068 (+3%) | 7mo | $565,000 | $273 | 62 |
| 65-05 Beach Channel Dr | 0.50mi | 5/2.0 (+1) | 2,024 (+1%) | 21mo | $700,000 | $346 | 53 |
| 6523 Seaspray Ave | 0.72mi | 4/3.0 | 2,258 (+13%) | 8mo | $1,170,000 | $518 | 35 |
Match score weights: distance 35% · size 25% · config 20% · recency 20%. Top-matched comps best support the ARV.
Projected returns pro-forma
10.0% appreciation · 3.0% rent growth · sell at horizon
- IRR
- 27.6%
- Equity multiple
- 3.19×
- Total profit
- $427,870
- Equity at exit
- $629,715
- IRR
- 24.1%
- Equity multiple
- 7.25×
- Total profit
- $1,223,046
- Equity at exit
- $1,358,003
Cash invested: $195,720 (down + closing). Projections, not guarantees.
Landlord ↔ Tenant lean methodology
- Overall (CITY)
- 0 Strongly Tenant-Friendly
- State New York
- 15 Strongly Tenant-Friendly · D+10
- County
- — inherits STATE
- City New York
- 0 Strongly Tenant-Friendly · D+34
ZIP-level market 11692
- Home prices YoY
- 14.4%
- Active inventory
- 80
- Price-to-rent
- 16.8×
Monthly cashflow live
- Estimated rent
- $6,939 medium interval (Pro) →
- Mortgage (P&I)
- −$3,666
- Tax from tax record
- −$358 /mo · $4,302/yr
- Insurance
- −$291
- Flood insurance flood zone
- −$427 /mo · $5,118/yr
- HOA
- −$0
- Vacancy / Maint / Mgmt
- −$1,457
- Net cashflow
- $740
Break-even live
2-unit breakdown (identical units grouped — click to expand)
| Units | Beds | Baths | Est. rent |
|---|---|---|---|
| 2× units | 2 | 1 | $6,938 |
| #1 | 2 | 1 | $3,469 |
| #2 | 2 | 1 | $3,469 |
| Total (2 units) | $6,939 | ||
UW: 25.0% down · 7.5% · 30yr · 1.5% tax · 5.0% vac · 8.0% maint · 8.0% mgmt
Financing live
Cash to close
- Down payment
- $174,750
- Closing costs
- $20,970
- Reserves months
- —
- Total cash needed
- —
Loan-product check · same deal, 3 products live
Conventional
25% down · 7.5% · 30yr
- Down + closing
- —
- Monthly P&I
- —
- Monthly cashflow
- —
- DSCR
- —
- Eligible?
- —
Personal DTI + credit; lowest rate.
DSCR
20% down · 8.5% · 30yr
- Down + closing
- —
- Monthly P&I
- —
- Monthly cashflow
- —
- DSCR
- —
- Eligible?
- —
No personal income docs; deal must DSCR.
Hard money
10% down · 12.0% · 12mo
- Down + closing
- —
- Monthly P&I
- —
- Monthly cashflow
- —
- DSCR
- —
- Eligible?
- —
Short-term bridge; refi at stabilization.
Rent comps 5 comps
| Address | Beds | Baths | Sqft | Rent | $/sqft | DOM | Units | Dist |
|---|---|---|---|---|---|---|---|---|
| 6935 Hessler Ave Arverne, NY | 3.0 | 1.5 | 1596 | $3,300 | $2.07 | 24d | 1 | 0.25mi |
| 75-18 Aquatic Dr Unit B Arverne, NY | 3.0 | 2.5 | 2034 | $3,500 | $1.72 | 24d | 1 | 0.53mi |
| 1-76 Beach 97th St Unit 3 Rockaway Beach, NY | 3.0 | 1.0 | 1500 | $4,000 | $2.67 | 7d | 1 | 1.22mi |
| 325 Beach 46th St Far Rockaway, NY | 3.0 | 1.5 | 2250 | $3,100 | $1.38 | 24d | 1 | 1.30mi |
| 2-27R Beach 99th St Rockaway Park, NY | 3.0 | 1.0 | 2208 | $3,500 | $1.59 | 24d | 1 | 1.31mi |
Listing history 17 events
-
2026-06-17pricedays on market $699,000 Active 1 DOM
-
2026-06-17days on market $799,000 Active 71 DOM
-
2026-06-15days on market $799,000 Active 69 DOM
-
2026-06-13days on market $799,000 Active 67 DOM
-
2026-06-10days on market $799,000 Active 63 DOM
-
2026-06-08days on market $799,000 Active 62 DOM
-
2026-06-08days on market $799,000 Active 61 DOM
-
2026-06-04days on market $799,000 Active 58 DOM
-
2026-06-03days on market $799,000 Active 57 DOM
-
2026-06-01days on market $799,000 Active 55 DOM
-
2026-05-31days on market $799,000 Active 54 DOM
-
2026-04-07$799,000 Active
-
2026-04-06historical
-
2026-03-03$839,000 Active
-
2025-02-25historical $2,750
-
2025-02-07$2,750
-
2000-11-29soldstatus $211,000
ⓘ Source: listings_history table (triggers on properties + properties_extension) + one-shot
backfill from property_details.listing_events for pre-trigger history.
Tax reassessment forecast NY · Partial reset (capped growth)
- Current annual tax
- $4,302 · $358/mo
- Projected year-2 tax
- $8,057 · $671/mo
- Expected delta
- +$3,756/yr (+$313/mo · 87.3%)
ⓘ Screening estimate from a state-policy table — verify with the county assessor before closing.
Climate risk First Street
- Flood 8/10 Severe FEMA zone AE · 99% chance over 30 yrs
- Wildfire 1/10 Low
- Heat 6/10 Major 7 d/yr ≥96°F today · 16 d/yr by 30 yrs out
- Wind 6/10 Major 77% chance of damaging wind over 30 yrs
- Air quality 3/10 Moderate 4 unhealthy d/yr today · 4 by 30 yrs out
Nearby sold comps map
Loading sold comps map…
Walkable amenities ~0.75 mi
Loading nearby amenities…
Taxation est. · year 1
- Rental income
- $83,268
- − Mortgage interest
- −$39,155
- − Property taxes
- −$4,302
- − Insurance
- −$8,614
- − Repairs & maintenance
- −$6,661
- − Management
- −$6,661
- − Depreciation
- −$20,335
- Taxable loss
- −$2,459
- Est. tax savings @ 24.0%
- +$590
- After-tax cash flow
- $9,469/yr
For passive investors: Depreciation is non-cash, so a rental often shows a tax loss while cash-flowing — sheltering income. Rental losses are passive: they offset passive income freely, and up to $25,000/yr can offset ordinary (W-2) income if you actively participate and your MAGI is under $100k (phasing out to $0 by $150k); unused losses carry forward. On sale, claimed depreciation is recaptured at up to 25%, and gains may owe capital-gains tax (a 1031 exchange can defer both). Figures are a year-1 estimate at your 24.0% rate — not tax advice; consult a CPA.
Schools (NCES district)
No district data.
Livability — New York
- Score
- 75/100
- State rank
- #268
- US rank
- #4188
Category grades
Schools grade is shown separately in the Schools card above.
Census & demographics
- Census place
- New York, NY
- County
- Queens County · 1,914,869 people
- City population
- 7,731,280
- Metro
- New York-Newark-Jersey City, NY-NJ-PA
- Population (ZIP)
- 22,734
- Household income
- $49,720
- Rent vs Own
- Severe rent burden
- 1734.0
Population outlook (Queens County) Hauer SSP2
- Today (2025)
- 2,546,320 people
- By 2030
- 2,643,059 · +3.8%
- By 2040
- 2,815,563 · +10.6%
- By 2050
- 2,944,423 · +15.6%
- By 2075
- 3,123,338 · +22.7%
- By 2100
- 3,098,688 · +21.7%
Race, ethnicity, and origin ACS 2023
- Neighborhood character
- Diverse neighborhood (Simpson 0.64)
- Race & ethnicity
- Black 53% Hispanic / Latino 24% Two or more races 15% White 13% Asian 6%
- Hispanic origin (detail)
- Puerto Rican 10% Dominican 5%
- Common ancestry
- Romanian 1%
- Foreign-born
- 31% · Canada, China, Jamaica
- Languages at home
- 67% English-only · Spanish 18% Other Indo-European 3% Russian/Polish/Slavic 3%
Political lean MEDSL · Queens
- 2024 margin
- Strong D (+24.6) · D 62.3% · R 37.7%
- 2008→2024 swing
- -26.2pp toward R · 2008: 50.8pp · 2024: 24.6pp
- All cycles
- 2024: D+24.6 2020: D+45.2 2016: D+53.4 2012: D+58.5 2008: D+50.8
Not yet ingested
- Civics
- —
Market trends
- HPI YoY
- ▲ 44.49%
- Current HPI
- 354.2007
- Rent YoY
- —
- Metro
- New York-Newark-Jersey City, NY-NJ-PA
- State GDP YoY
- ▲ 2.60%
- F500 in state
- 92
Industry mix (Fortune 500 HQ in NY)
| Industry | F500 HQs | Revenue |
|---|---|---|
| Financial Services | 10 | $950B |
|
||
| Consumer Goods | 9 | $162B |
|
||
| Insurance | 4 | $225B |
|
||
| Telecommunications | 2 | $144B |
|
||
| Pharmaceuticals | 2 | $112B |
|
||
| Media / Entertainment | 2 | $69B |
|
||
Price history
+278.7% since first listed6 events — show timeline
- 2026-04-07 Listed $799,000 BNYMLS
- 2026-04-06 Listing Removed — OneKey® MLS as Distributed by MLS Grid
- 2026-03-03 Listed $839,000 OneKey® MLS as Distributed by MLS Grid
- 2025-02-25 Rental Removed $2,750 ONEKEY
- 2025-02-07 Listed for Rent $2,750 ONEKEY
- 2000-11-29 Sold (Public Records) $211,000 Public Records
Property tax history
+2.1%/yrLatest (2025): $4,302 · +147.7% YoY. Source: county tax records.
Cash-flow waterfall
monthlySold comps — $/sqft
last 12 mo · ≤1 miLoading sold comps…