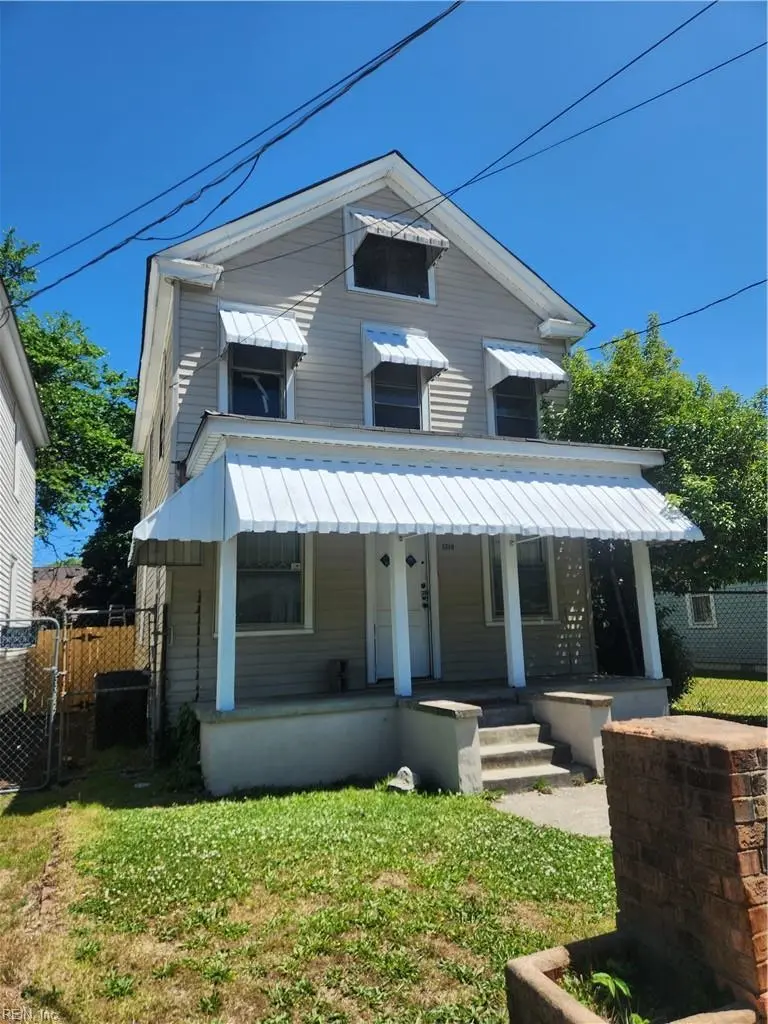
1917 Prentis Ave · Portsmouth, VA
Flood risk 5/10 · Moderate
- FEMA flood zone
- X (shaded)
- Chance of flooding over 30 yrs
- 0.5%
- Est. flood insurance / yr
- $507 – $1,088
Fire risk 1/10 · Minimal
- Est. fire insurance / yr
- $666 – $1,236
Heat risk 9/10 · Severe
- Hot days now (above 106°F)
- 7 days/yr
- Hot days in 30 yrs
- 16 days/yr
Wind risk 8/10 · Major
- Chance of severe wind over 30 yrs
- 80.0%
Air-quality risk 5/10 · Moderate
- Unhealthy air days now
- 6 days/yr
- Unhealthy air days in 30 yrs
- 7 days/yr
Risk factors via First Street. Map © Google.
Why this score? — see what drove the B grade
The composite is a weighted blend of 9 inputs, each scored 0–100. Each bar is that input's sub-score; the figure is the points it added to the 100-point composite (weight × sub-score).
- Cash flow +30.0/30.0
- 1% rule +10.0/10.0
- DSCR +10.0/10.0
- ARV discount +7.5/15.0
- Schools +3.9/10.0
- Livability +3.7/5.0
- Rent growth +3.3/5.0
- Condition / age +2.5/5.0
- Appreciation +0.0/10.0
$63,000
🖨 Deal sheet 📄 Offer letter ✓ Due diligence
Listing remarks
Investor Special. 5+ bdrms, 2 bath, open floor plan. Cash only w/ proof of funds. Have Inspections before offers. No contingencies. Make this a nice home in quaint Prentis Place.
Key facts
- Built 1920
- Listed 14 days
Property features AI
Finance
- Other: Fixer upper
- HOA & community: No HOA fees reported
Exterior
- Parking: Street parking
- Utilities: City/County water; City/County sewer; Other heating type
- Home design: Detached Victorian home; 3 stories with 3 living levels; Crawl foundation; Simple ownership
- Construction: Crawl foundation; Vinyl exterior; Asphalt shingle roof
- Exterior features: Vinyl siding; Back and full wood fence; Has fence; Asphalt shingle roof
Interior
- Bedrooms: Bedroom with full bathroom on the first floor
- Flooring: Wood flooring
- Bathrooms: 2 full bathrooms
- Interior features: Decorative fireplace(s) (5 total); Permanent attic stairs with walk-in attic; Attic; Pantry; Porch
- Laundry & utility: Washer hookup; Dryer hookup
Neighborhood map
What this means for you Summary
Snapshot
- This is a 3-bed/1.0-bath single-family listed at $63k.
Deal economics
- At list price, monthly cash flow is $918 ($11k/yr) — positive.
- The deal already cash-flows at list — no discount required.
- Meets the 1% rule at list price ($2k rent vs $63k).
- Cap rate 23.8% vs local median 4.6% in Portsmouth — top-decile yield for the area; either an underpriced asset or a hidden risk that comps aren't pricing in. Stress-test before assuming the spread holds.
Location & tenants
- Location reads 73/100 on livability (#172 in VA) — a middle-class / working-renter tenant base. Strengths: amenities A+, cost of living A+, housing A+; Watch: employment C-, crime F, commute F.
- Portsmouth City Public School District (urban): math 34% / reading 58% proficiency, ranked #107 of 131 in VA (top 82%) — families likely to look elsewhere, expect single-tenant / working-renter base with shorter leases.
- Zoned schools: Brighton Elementary (math 12% / reading 32%, grade F, #1,069 of 1,108 statewide, top 97%, 411 students, 97% FRL); I.C. Norcom High (math 39% / reading 58%, grade D, #301 of 319 statewide, top 95%, 1,043 students, 100% FRL) — zoned schools average 98% FRL vs 60% district-wide (38 pts higher); higher-poverty schools than district average — tighter screening recommended.
- Market conditions: Rents rising (+3.3%/yr); 131 active listings in the ZIP; 40 comparable units currently listed for rent nearby; rentals at typical pace (median 24d on market — plan ~3-4 weeks tenant-placement turnaround); 300 units permitted in Portsmouth city in 2024 (112 in 5+ unit buildings).
- This rent runs 41% of the median local income ($50k/yr) — at the standard rent-burdened threshold; future hikes will face affordability resistance.
Forward outlook
- Local home prices are declining (-3.0%/yr); year-one equity from $436 of loan paydown is wiped out by about $2k of value loss. Plan a longer hold.
- At projected returns (-3.0% appreciation + 3.3% rent growth), your $18k cash investment doubles in ~2 years — after that, you're playing with house money.
Negotiation context
- Only 14 days on market — expect competitive offers; lowballing is unlikely to land.
- 2 sale attempts since 11y ago; this cycle's ask is 12% above the opening price — seller raised mid-cycle; expect resistance to lowballs.
- Current owner paid $30k; list at $63k implies a 114% gain — meaningful room to come down on a strong offer.
Risks & watch-outs
- Watch-outs: built in 1920 — expect roof / HVAC / electrical / plumbing capex.
- Climate carrying-cost: moderate flood risk; severe wind risk, 80% chance of damaging wind over 30y; extreme-heat days projected 7→16/yr by 2055 (HVAC capex compounding) — expect insurance premiums to compound above CPI over the hold.
Questions for the listing agent
- Built in 1920 — when were the roof, HVAC, electrical panel, plumbing, and water heater last replaced?
- Is there a deadline driving the sale (1031 exchange, divorce, estate, relocation)? That informs how much negotiation room exists.
- Schools are B-rated — typically a magnet for longer-tenancy family renters. What's the average tenant stay here, and is there a school-zone premium baked into asking?
- Crime grade is F in this area — have there been break-ins, vandalism, or insurance claims at this property in the last 3 years? What carrier currently insures it and at what premium?
- What's the average days-on-market for RENTAL listings here right now (not sales)? A rising rental-DOM trend means longer vacancies and softer asking-rent achievability than the comps imply.
- What's the recent tenant-quality profile in this submarket — average credit score on applications, eviction rate, late-payment / NSF rate, and stable-employment percentage? A property-management company in the area should have these aggregated.
- How much new for-sale + rental construction is in the pipeline within 1–3 miles? Heavy new supply typically softens prices + rents 12–24 months out; constrained supply supports both.
Investment metrics
- 1% rule
- 2.72% ✓
- Cap rate
- 23.77%
- Cash-on-cash
- 62.42%
- DSCR
- 3.78
- GRM
- 3.1
CMA / ARV
- ARV (on-the-fly)
- $204,960
- Comps found
- 12
Show comp detail 12 sales within ~0.75 mi
| Address | Dist | Beds/Ba | Sqft | Sold | Price | $/sf | Match |
|---|---|---|---|---|---|---|---|
| 1915 Prentis Ave | 0.01mi | 3/1.0 | 1,120 (0%) | 1mo | $163,000 | $146 | 99 |
| 1022 Palmer St | 0.07mi | 3/1.0 | 1,135 (+1%) | 3mo | $205,000 | $181 | 92 |
| 1506 Camden Ave | 0.27mi | 2/1.0 (-1) | 1,138 (+2%) | 1mo | $235,000 | $207 | 79 |
| 2317 Azalea Ave | 0.55mi | 3/2.0 | 1,131 (+1%) | 3mo | $260,000 | $230 | 67 |
| 2008 Elm Ave | 0.08mi | 4/2.0 (+1) | 1,260 (+12%) | 2mo | $260,000 | $206 | 65 |
| 2713 Roanoke Ave | 0.65mi | 3/1.0 | 1,160 (+4%) | 3mo | $105,000 | $91 | 61 |
| 1808 Deep Creek Blvd | 0.57mi | 3/1.0 | 1,038 (-7%) | 2mo | $190,000 | $183 | 60 |
| 2711 Evergreen Pl | 0.70mi | 3/2.0 | 1,100 (-2%) | 2mo | $278,000 | $253 | 59 |
| 3000 George Washington Hwy | 0.56mi | 3/1.0 | 1,016 (-9%) | 2mo | $60,000 | $59 | 57 |
| 2214 Deep Creek Blvd | 0.64mi | 3/2.5 | 1,205 (+8%) | 1mo | $272,000 | $226 | 50 |
| 564 Portsmouth Blvd | 0.66mi | 3/2.0 | 1,220 (+9%) | 0mo | $189,000 | $155 | 50 |
| 1536 Centre Ave | 0.59mi | 3/1.5 | 975 (-13%) | 1mo | $110,000 | $113 | 48 |
Match score weights: distance 35% · size 25% · config 20% · recency 20%. Top-matched comps best support the ARV.
Projected returns pro-forma
-3.0% appreciation · 3.31% rent growth · sell at horizon
- IRR
- 61.7%
- Equity multiple
- 3.77×
- Total profit
- $48,800
- Equity at exit
- $9,394
- IRR
- 66.4%
- Equity multiple
- 7.81×
- Total profit
- $120,075
- Equity at exit
- $5,447
Cash invested: $17,640 (down + closing). Projections, not guarantees.
Landlord ↔ Tenant lean methodology
- Overall (STATE)
- 55 Moderately Landlord-Leaning
- State Virginia
- 55 Moderately Landlord-Leaning · D+2
- County
- — inherits STATE
- City
- — inherits STATE
ZIP-level market 23704
- Home prices YoY
- -4.6%
- Rents YoY
- 3.3%
- Active inventory
- 131
- Price-to-rent
- 3.1×
Monthly cashflow live
- Estimated rent
- $1,714 high interval (Pro) →
- Mortgage (P&I)
- −$330
- Tax from tax record
- −$80 /mo · $962/yr
- Insurance
- −$26
- HOA
- −$0
- Vacancy / Maint / Mgmt
- −$360
- Net cashflow
- $918
Break-even live
UW: 25.0% down · 7.5% · 30yr · 1.5% tax · 5.0% vac · 8.0% maint · 8.0% mgmt
Financing live
Cash to close
- Down payment
- $15,750
- Closing costs
- $1,890
- Reserves months
- —
- Total cash needed
- —
Loan-product check · same deal, 3 products live
Conventional
25% down · 7.5% · 30yr
- Down + closing
- —
- Monthly P&I
- —
- Monthly cashflow
- —
- DSCR
- —
- Eligible?
- —
Personal DTI + credit; lowest rate.
DSCR
20% down · 8.5% · 30yr
- Down + closing
- —
- Monthly P&I
- —
- Monthly cashflow
- —
- DSCR
- —
- Eligible?
- —
No personal income docs; deal must DSCR.
Hard money
10% down · 12.0% · 12mo
- Down + closing
- —
- Monthly P&I
- —
- Monthly cashflow
- —
- DSCR
- —
- Eligible?
- —
Short-term bridge; refi at stabilization.
Rent comps 40 comps
| Address | Beds | Baths | Sqft | Rent | $/sqft | DOM | Units | Dist |
|---|---|---|---|---|---|---|---|---|
| 2007 Elm Ave Portsmouth, VA | 3.0 | 1.0 | 903 | $1,300 | $1.44 | 20d | 1 | 0.07mi |
| 2111 Atlanta Ave Portsmouth, VA | 3.0 | 2.0 | 1418 | $2,395 | $1.69 | 43d | 1 | 0.19mi |
| 1802 Atlanta Ave Unit 2 Portsmouth, VA | 2.0 | 1.0 | 1200 | $1,500 | $1.25 | 23d | 1 | 0.20mi |
| 923 Randolph St Portsmouth, VA | 2.0 | 1.0 | 800 | $1,062 | $1.33 | 43d | 1 | 0.21mi |
| 1440 Lasalle Ave Portsmouth, VA | 4.0 | 2.0 | 1493 | $2,500 | $1.67 | 23d | 1 | 0.28mi |
| 818 Coolidge St Portsmouth, VA | 2.0 | 1.0 | 1230 | $2,100 | $1.71 | 43d | 1 | 0.33mi |
| 1915 Lansing Ave Portsmouth, VA | 3.0 | 1.0 | 1085 | $1,675 | $1.54 | 3d | 1 | 0.37mi |
| 1416 Richmond Ave Portsmouth, VA | 2.0 | 1.0 | 1024 | $1,150 | $1.12 | 43d | 1 | 0.40mi |
| 1915 Des Moines Ave Portsmouth, VA | 3.0 | 1.0 | 1070 | $1,700 | $1.59 | 23d | 1 | 0.41mi |
| 1915 Des Moines Ave Portsmouth, VA | 3.0 | 1.0 | 1070 | $1,700 | $1.59 | 16d | 1 | 0.41mi |
| 811 Randolph St Unit A Portsmouth, VA | 2.0 | 1.0 | 800 | $1,150 | $1.44 | 43d | 1 | 0.42mi |
| 2756 Peach St Portsmouth, VA | 2.0 | 1.5 | 1040 | $1,495 | $1.44 | 23d | 1 | 0.42mi |
| 1314 Summit Ave Portsmouth, VA | 3.0 | 1.5 | 1152 | $1,750 | $1.52 | 43d | 1 | 0.47mi |
| 2906 Chestnut St Unit 1328007P Portsmouth, VA | 2.0 | 1.0 | 947 | $4,650 | $4.91 | 7d | 1 | 0.53mi |
| 1029 Green St Portsmouth, VA | 2.0 | 1.5 | 802 | $1,199 | $1.50 | 17d | 1 | 0.58mi |
| 1003 Green St Unit 1003 Portsmouth, VA | 2.0 | 1.5 | 837 | $1,195 | $1.43 | 23d | 1 | 0.59mi |
| 548 Madison St Portsmouth, VA | 2.0 | 1.0 | 900 | $1,349 | $1.50 | 16d | 3 | 0.59mi |
| 548 Madison St Unit 542-21-C Portsmouth, VA | 2.0 | 1.0 | 900 | $1,349 | $1.50 | 23d | 1 | 0.60mi |
| 915 Green St Portsmouth, VA | 2.0 | 1.0 | 837 | $1,195 | $1.43 | 43d | 1 | 0.64mi |
| 1447 Talley Cir Portsmouth, VA | 3.0 | 2.5 | 1440 | $2,000 | $1.39 | 23d | 1 | 0.66mi |
| 2810 Roanoke Ave Portsmouth, VA | 3.0 | 1.5 | 1100 | $2,100 | $1.91 | 43d | 1 | 0.70mi |
| 622 Effingham St Portsmouth, VA | 2.0–3.0 | 1.5–2.0 | 1027 | $1,797 | $1.75 | 23d | 2 | 0.74mi |
| 533 Columbia St Portsmouth, VA | 2.0 | 2.0 | 1110 | $1,495 | $1.35 | 43d | 1 | 0.75mi |
| 2304 Nashville Ave Portsmouth, VA | 3.0 | 1.5 | 1226 | $1,395 | $1.14 | 43d | 1 | 0.77mi |
| 1100 High St Portsmouth, VA | 2.0–3.0 | 1.5–2.0 | 1003 | $1,545 | $1.54 | 2d | 5 | 0.78mi |
| 714 King St Portsmouth, VA | 2.0 | 2.0 | 935 | $1,899 | $2.03 | 43d | 1 | 0.79mi |
| 605 Dinwiddie St Unit B Portsmouth, VA | 2.0 | 1.0 | 900 | $1,650 | $1.83 | 43d | 1 | 0.86mi |
| 1140 London Blvd Portsmouth, VA | 2.0 | 2.0 | 1016 | $1,902 | $1.87 | 3d | 1 | 0.94mi |
| 1914 King St Portsmouth, VA | 3.0 | 2.5 | 1332 | $2,200 | $1.65 | 44d | 1 | 0.98mi |
| 231 Edison Ave Unit 231 Portsmouth, VA | 2.0 | 1.5 | 1050 | $1,275 | $1.21 | 10d | 1 | 1.02mi |
| 231 Edison Ave Portsmouth, VA | 2.0 | 1.5 | 1100 | $1,275 | $1.16 | 19d | 1 | 1.02mi |
| 111 High St #409 Portsmouth, VA | 2.0 | 2.5 | 1078 | $2,500 | $2.32 | 7d | 1 | 1.08mi |
| 412 North St Portsmouth, VA | 2.0 | 1.0 | 850 | $1,415 | $1.66 | 23d | 2 | 1.13mi |
| 303 Effingham St Unit N-2K Portsmouth, VA | 2.0 | 1.0 | 872 | $1,375 | $1.58 | 23d | 1 | 1.18mi |
| 303 Effingham St Unit S-2F Portsmouth, VA | 3.0 | 2.0 | 1122 | $1,950 | $1.74 | 23d | 1 | 1.18mi |
| 303 Effingham St Portsmouth, VA | 1.0–3.0 | 1.0–2.0 | 863 | $1,950 | $2.26 | 16d | 11 | 1.18mi |
| 303 Effingham St Unit S-6E Portsmouth, VA | 2.0 | 1.0 | 879 | $1,360 | $1.55 | 23d | 1 | 1.18mi |
| 303 Effingham St Portsmouth, VA | 2.0 | 1.0 | 872 | $1,385 | $1.59 | 43d | 1 | 1.18mi |
| 3304 Killian Ave Portsmouth, VA | 3.0 | 1.0 | 800 | $2,000 | $2.50 | 23d | 1 | 1.22mi |
| 129 Elm Ave Portsmouth, VA | 3.0 | 1.5 | 1160 | $2,600 | $2.24 | 43d | 1 | 1.28mi |
Listing history 14 events
-
2026-06-18days on market $63,000 Active 14 DOM
-
2026-06-17days on market $63,000 Active 13 DOM
-
2026-06-16days on market $63,000 Active 12 DOM
-
2026-06-15days on market $63,000 Active 11 DOM
-
2026-06-13pricestatusdays on market $63,000 Active 9 DOM
-
2026-05-20$56,000 Active
-
2015-12-16status Under Contract
-
2015-12-09historical
-
2015-11-20historical
-
2015-11-06price $12,000
-
2015-08-28price $15,000
-
2015-08-17price $20,000
-
2015-07-23$30,000 Active
-
2003-12-02soldstatus $29,500
ⓘ Source: listings_history table (triggers on properties + properties_extension) + one-shot
backfill from property_details.listing_events for pre-trigger history.
Tax reassessment forecast VA · Resets to sale price
- Current annual tax
- $962 · $80/mo
- Projected year-2 tax
- $962 · $80/mo
- Expected delta
- $0/yr ($0/mo · 0.0%)
ⓘ Screening estimate from a state-policy table — verify with the county assessor before closing.
Climate risk First Street
- Flood 5/10 Major FEMA zone X (shaded) · 50% chance over 30 yrs
- Wildfire 1/10 Low
- Heat 9/10 Extreme 7 d/yr ≥106°F today · 16 d/yr by 30 yrs out
- Wind 8/10 Severe 80% chance of damaging wind over 30 yrs
- Air quality 5/10 Major 6 unhealthy d/yr today · 7 by 30 yrs out
Nearby sold comps map
Loading sold comps map…
Walkable amenities ~0.75 mi
Loading nearby amenities…
Taxation est. · year 1
- Rental income
- $20,574
- − Mortgage interest
- −$3,529
- − Property taxes
- −$962
- − Insurance
- −$315
- − Repairs & maintenance
- −$1,646
- − Management
- −$1,646
- − Depreciation
- −$1,833
- Taxable income
- $10,643
- Est. tax owed @ 24.0%
- −$2,554
- After-tax cash flow
- $8,457/yr
For passive investors: Depreciation is non-cash, so a rental often shows a tax loss while cash-flowing — sheltering income. Rental losses are passive: they offset passive income freely, and up to $25,000/yr can offset ordinary (W-2) income if you actively participate and your MAGI is under $100k (phasing out to $0 by $150k); unused losses carry forward. On sale, claimed depreciation is recaptured at up to 25%, and gains may owe capital-gains tax (a 1031 exchange can defer both). Figures are a year-1 estimate at your 24.0% rate — not tax advice; consult a CPA.
Schools (NCES district)
- District
- Portsmouth City Public School District
- NCES district ID
- 5103000
- Math proficiency
- 34% ▼ -40.00%
- Reading proficiency
- 58% ▼ -12.00%
- Median HH income
- $46,152
- Composite
- 39.01/100
- National rank
- #4071
- State rank
- #107 of 131 in VA
Livability — Portsmouth
- Score
- 73/100
- State rank
- #172
- US rank
- #5381
Category grades
Schools grade is shown separately in the Schools card above.
Census & demographics
- Census place
- Portsmouth, VA
- County
- Portsmouth City · 96,366 people
- City population
- 96,366
- Metro
- Virginia Beach-Norfolk-Newport News, VA-NC
- Population (ZIP)
- 19,207
- Household income
- $49,583
- Rent vs Own
- Severe rent burden
- 1727.0
Population outlook (Portsmouth County) Hauer SSP2
- Today (2025)
- 96,730 people
- By 2030
- 96,760 · +0.0%
- By 2040
- 96,573 · -0.2%
- By 2050
- 95,606 · -1.2%
- By 2075
- 93,579 · -3.3%
- By 2100
- 83,756 · -13.4%
Race, ethnicity, and origin ACS 2023
- Neighborhood character
- Predominantly Black (66%)
- Race & ethnicity
- Black 66% White 24% Two or more races 6% Hispanic / Latino 4% Asian 2%
- Common ancestry
- Slovak 1% Romanian 1% Lithuanian 1%
- Foreign-born
- 2% · Canada
- Languages at home
- 96% English-only · Spanish 2%
Political lean MEDSL · Portsmouth
- 2024 margin
- Solid D (+38.6) · D 68.6% · R 30.0% · Other 1.4%
- 2008→2024 swing
- -0.7pp no change · 2008: 39.3pp · 2024: 38.6pp
- All cycles
- 2024: D+38.6 2020: D+40.8 2016: D+36.5 2012: D+39.6 2008: D+39.3
Not yet ingested
- Civics
- —
Market trends
- HPI YoY
- ▼ -15.69%
- Current HPI
- 322.7335
- Rent YoY
- ▲ 3.31%
- Metro
- Virginia Beach-Norfolk-Newport News, VA-NC
- State GDP YoY
- ▲ 2.40%
- F500 in state
- 50
Industry mix (Fortune 500 HQ in VA)
| Industry | F500 HQs | Revenue |
|---|---|---|
| Aerospace / Defense | 4 | $236B |
|
||
| Technology / Defense | 3 | $32B |
|
||
| Financial Services | 2 | $176B |
|
||
| Utilities | 2 | $27B |
|
||
| Insurance | 2 | $25B |
|
||
| Technology | 2 | $15B |
|
||
Price history
+89.8% since first listed9 events — show timeline
- 2026-05-20 Listed $56,000 REINMLS
- 2015-12-16 Pending — REINMLS
- 2015-12-09 Listing Removed — REINMLS
- 2015-11-20 Listing Removed — REINMLS
- 2015-11-06 Price Changed $12,000 REINMLS
- 2015-08-28 Price Changed $15,000 REINMLS
- 2015-08-17 Price Changed $20,000 REINMLS
- 2015-07-23 Listed $30,000 REINMLS
- 2003-12-02 Sold (Public Records) $29,500 Public Records
Property tax history
+1.8%/yrLatest (2025): $962 · +0.8% YoY. Source: county tax records.
Cash-flow waterfall
monthlySold comps — $/sqft
last 12 mo · ≤1 miLoading sold comps…