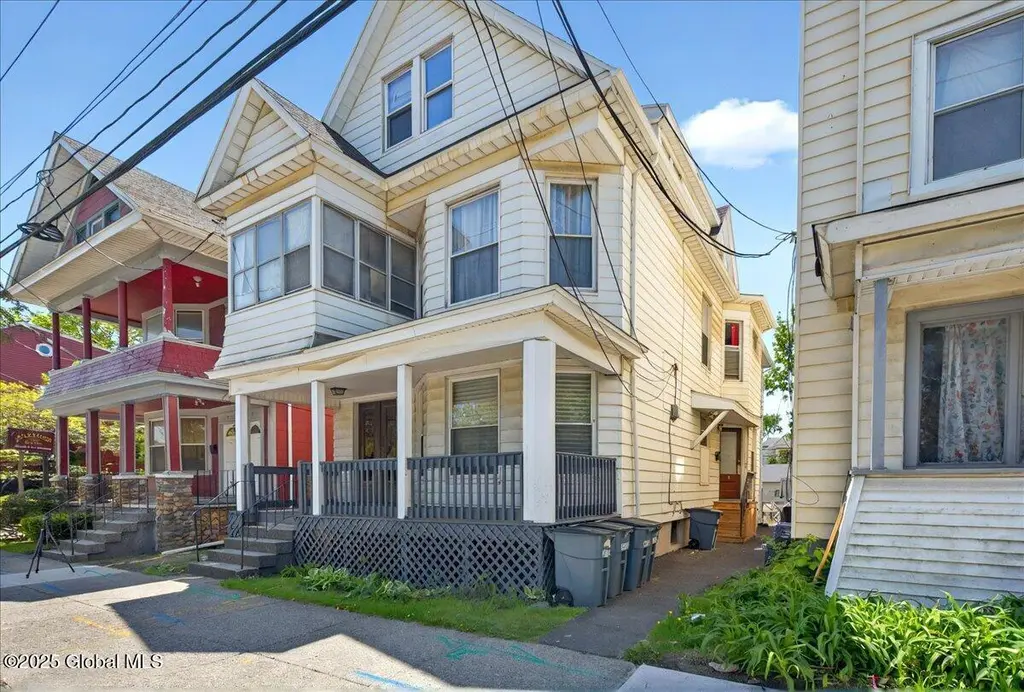
 Fourplex
272 Morton Ave · Albany, NY
Flood risk 1/10 · Minimal
- FEMA flood zone
- X (unshaded)
- Chance of flooding over 30 yrs
- 0.0%
- Est. flood insurance / yr
- $473 – $860
Fire risk 1/10 · Minimal
- Est. fire insurance / yr
- $691 – $1,283
Heat risk 4/10 · Minor
- Hot days now (above 99°F)
- 7 days/yr
- Hot days in 30 yrs
- 16 days/yr
Wind risk 3/10 · Minor
- Chance of severe wind over 30 yrs
- 7.0%
Air-quality risk 1/10 · Minimal
- Unhealthy air days now
- 0 days/yr
- Unhealthy air days in 30 yrs
- 0 days/yr
Risk factors via First Street. Map © Google.
Why this score? — see what drove the B grade
The composite is a weighted blend of 9 inputs, each scored 0–100. Each bar is that input's sub-score; the figure is the points it added to the 100-point composite (weight × sub-score).
- Cash flow +30.0/30.0
- ARV discount +11.4/15.0
- 1% rule +10.0/10.0
- DSCR +10.0/10.0
- Livability +4.0/5.0
- Schools +3.2/10.0
- Rent growth +2.5/5.0
- Condition / age +2.5/5.0
- Appreciation +0.0/10.0
$499,000
🖨 Deal sheet (PDF) 📄 Offer letter ✓ Due diligence
Multi-family units
County records classify this as Multi-Family (5+ Unit). Listing-text estimate: 4 units. estimate disagrees with records
5+ unit building — per-unit beds/baths from public records are typically unavailable; the breakdown below (if shown) is an estimate from the listing text.
Listing remarks
Well maintained 4-Unit Investment Property! Located on Morton Avenue, this solid 4-unit building offers a fantastic opportunity for investors seeking strong rental potential paired with valuable property upgrades. Recent improvements include 3 high-efficiency natural gas condensing boilers, 2 coin-operated washers + dryers for tenant convenience, a newer roof, gutters, sidewalk + hot water tanks. Inside the units have been updated: 3 units offer updated kitchens w/ granite. The property also features a 3-car detached garage, offering additional storage or rental income potential. Across from Lincoln Park.
Key facts
- Newer roof
- 4 unit building
- Updated kitchens
Tags
Property features AI
Finance
- Financial info: Multi-family property with 4 units; Tenants pay hot water, heat, electricity, and gas; Owner pays water, sewer, trash collection, and snow removal
Exterior
- Parking: Detached garage; 3 garage spaces (3 parking spaces total)
- Utilities: Public water; Public sewer; 100 amp electric service with circuit breakers
- Home design: Quadruplex; Level lot
- Construction: Aluminum siding; Concrete perimeter foundation; Asphalt roof; Built/renovated living area approximately 3,630
- Exterior features: Rear porch; Front porch; Wood fencing; Garage structures on property
Interior
- Kitchen: Each unit includes a kitchen (units 1–4)
- Bedrooms: Unit 1: 1 bedroom (1st floor); Unit 2: 1 bedroom (1st floor); Unit 3: 3 bedrooms (2nd floor); Unit 4: 2 bedrooms (3rd floor)
- Flooring: Vinyl; Ceramic tile; Hardwood; Linoleum
- Bathrooms: 4 full bathrooms total; Full baths located on 1st, 2nd and 3rd floors
- Heating & cooling: Has heating; Baseboard heating; Hot water heating; Natural gas heating
- Interior features: Solid surface counters; High-speed internet; Ceramic tile baths; Crown molding
- Laundry & utility: Common area laundry; In-basement laundry room
Neighborhood map
What this means for you Summary
Snapshot
- This is a 4 × 7-bed/4.0-bath units multifamily listed at $499k.
Deal economics
- At list price, monthly cash flow is $2k ($30k/yr) — positive. Per door: $620/mo.
- The deal already cash-flows at list — no discount required.
- Meets the 1% rule at list price ($8k rent vs $499k).
- Recommended offer: $484k (3.0% below list) — sets the bar for market timing.
- Cap rate 12.3% vs local median 5.7% in Albany — top-decile yield for the area; either an underpriced asset or a hidden risk that comps aren't pricing in. Stress-test before assuming the spread holds.
Location & tenants
- Location reads 79/100 on livability (#129 in NY, #2,083 nationally) — a middle-class / working-renter tenant base. Strengths: amenities A+, commute A+, housing A+; Watch: employment C-, crime F.
- Albany City School District (urban): math 37% / reading 40% proficiency, ranked #543 of 590 in NY (top 92%) — families likely to look elsewhere, expect single-tenant / working-renter base with shorter leases; 66% free/reduced lunch — lower-income household profile, screen leases tightly.
- Zoned schools: Albany High School (math 74% / reading 67%, grade B+, #710 of 1,100 statewide, top 65%, 2,676 students, 69% FRL) — zoned schools at 69% FRL track the district average.
- Zoned-school proficiency averages 70% at this address vs 38% district-wide (+32 pts) — the actual schools serving this property are materially stronger than the Albany City School District average implies; a family-tenant draw the district grade alone would hide.
- Market conditions: 47 active listings in the ZIP; 675 units permitted in Albany County in 2024 (451 in 5+ unit buildings).
Forward outlook
- Local home prices are declining (-3.0%/yr); year-one equity from $3k of loan paydown is wiped out by about $15k of value loss. Plan a longer hold.
- Albany County population projected at +9% by 2050 — modest demand growth; plan on rents tracking national, not racing it.
- At projected returns (-3.0% appreciation + 3.0% rent growth), your $140k cash investment doubles in ~6 years — after that, you're playing with house money.
Negotiation context
- It's been on market 55 days — a 3% lower offer ($484k) is reasonable based on typical stale-listing flexibility.
- 2 sale attempts; this cycle's ask has dropped $76k (13%) from the opening price — seller is motivated, your offer sets the floor, not the list.
- Current owner paid $150k; list at $499k implies a 233% gain — meaningful room to come down on a strong offer.
Risks & watch-outs
- Watch-outs: built in 1920 — expect roof / HVAC / electrical / plumbing capex.
Questions for the listing agent
- It's been on market 55 days. Have you received any prior offers? Is the seller open to a 3% concession, seller financing, or rate buy-down credit?
- Can we see the unit-by-unit rent roll, current vacancy, and any below-market leases? What's the average tenancy length?
- What capital expenditures (roof, boiler, parking lot, exteriors) have been made in the last 5 years, and what's planned in the next 2?
- Built in 1920 — when were the roof, HVAC, electrical panel, plumbing, and water heater last replaced?
- Is there a deadline driving the sale (1031 exchange, divorce, estate, relocation)? That informs how much negotiation room exists.
- Crime grade is F in this area — have there been break-ins, vandalism, or insurance claims at this property in the last 3 years? What carrier currently insures it and at what premium?
- What's the average days-on-market for RENTAL listings here right now (not sales)? A rising rental-DOM trend means longer vacancies and softer asking-rent achievability than the comps imply.
- What's the recent tenant-quality profile in this submarket — average credit score on applications, eviction rate, late-payment / NSF rate, and stable-employment percentage? A property-management company in the area should have these aggregated.
- How much new apartment / multifamily construction is in the pipeline within 1–3 miles? Heavy new supply (>2% of stock underway) typically softens rents 12–24 months out; light construction supports rent growth.
Investment metrics
- 1% rule
- 1.54% ✓
- Cap rate
- 12.26%
- Cash-on-cash
- 21.32%
- DSCR
- 1.95
- GRM
- 5.4
CMA / ARV
- ARV (median comp)
- $546,105
- List price
- $499,000
- Delta
- -8.63%
- Verdict
- FAIR
- Comps
- 20 within 1.0 mi
Projected returns pro-forma
-3.0% appreciation · 3.0% rent growth · sell at horizon
- IRR
- 13.9%
- Equity multiple
- 1.55×
- Total profit
- $77,414
- Equity at exit
- $74,403
- IRR
- 22.7%
- Equity multiple
- 2.94×
- Total profit
- $271,755
- Equity at exit
- $43,144
Cash invested: $139,720 (down + closing). Projections, not guarantees.
Landlord ↔ Tenant lean methodology
- Overall (STATE)
- 15 Strongly Tenant-Friendly
- State New York
- 15 Strongly Tenant-Friendly · D+10
- County
- — inherits STATE
- City
- — inherits STATE
ZIP-level market 12209
- Home prices YoY
- -7.3%
- Active inventory
- 47
- Price-to-rent
- 21.7×
Monthly cashflow live
- Estimated rent
- $7,671 medium interval (Pro) →
- Mortgage (P&I)
- −$2,617
- Tax from tax record
- −$753 /mo · $9,041/yr
- Insurance
- −$208
- HOA
- −$0
- Lot rent
- −$0
- Vacancy / Maint / Mgmt
- −$1,611
- Net cashflow
- $2,482
Break-even live
Sensitivity live
| Price | -10% $2,764 | -5% $2,623 | +0% $2,482 | +5% $2,341 | +10% $2,199 |
|---|---|---|---|---|---|
| Rent | -10% $1,876 | -5% $2,179 | +0% $2,482 | +5% $2,785 | +10% $3,088 |
| Rate | -1.0pp $2,733 | -0.5pp $2,609 | base $2,482 | +0.5pp $2,353 | +1.0pp $2,221 |
4-unit breakdown (identical units grouped — click to expand)
| Units | Beds | Baths | Est. rent |
|---|---|---|---|
| 4× units | 7 | 4 | $7,672 |
| #1 | 7 | 4 | $1,918 |
| #2 | 7 | 4 | $1,918 |
| #3 | 7 | 4 | $1,918 |
| #4 | 7 | 4 | $1,918 |
| Total (4 units) | $7,671 | ||
UW: 25.0% down · 7.5% · 30yr · 1.5% tax · 5.0% vac · 8.0% maint · 8.0% mgmt
Financing live
Cash to close
- Down payment
- $124,750
- Closing costs
- $14,970
- Reserves months
- —
- Total cash needed
- —
Loan-product check · same deal, 3 products live
Conventional
25% down · 7.5% · 30yr
- Down + closing
- —
- Monthly P&I
- —
- Monthly cashflow
- —
- DSCR
- —
- Eligible?
- —
Personal DTI + credit; lowest rate.
DSCR
20% down · 8.5% · 30yr
- Down + closing
- —
- Monthly P&I
- —
- Monthly cashflow
- —
- DSCR
- —
- Eligible?
- —
No personal income docs; deal must DSCR.
Hard money
10% down · 12.0% · 12mo
- Down + closing
- —
- Monthly P&I
- —
- Monthly cashflow
- —
- DSCR
- —
- Eligible?
- —
Short-term bridge; refi at stabilization.
Listing history 20 events
-
2026-06-23days on market $499,000 Active 55 DOM
-
2026-06-21days on market $499,000 Active 54 DOM
-
2026-06-18days on market $499,000 Active 51 DOM
-
2026-06-17days on market $499,000 Active 50 DOM
-
2026-06-16days on market $499,000 Active 49 DOM
-
2026-06-15days on market $499,000 Active 48 DOM
-
2026-06-14days on market $499,000 Active 46 DOM
-
2026-06-10days on market $499,000 Active 43 DOM
-
2026-06-08days on market $499,000 Active 41 DOM
-
2026-06-07pricedays on market $499,000 Active 40 DOM
-
2026-06-03days on market $575,000 Active 36 DOM
-
2026-06-02days on market $575,000 Active 35 DOM
-
2026-06-01days on market $575,000 Active 34 DOM
-
2026-05-31days on market $575,000 Active 33 DOM
-
2026-05-31days on market $575,000 Active 32 DOM
-
2026-04-28$575,000 Active 617-char remark
-
2025-09-11historical
-
2025-05-14$575,000 Active
-
2020-09-15soldstatus $150,000
-
2008-05-22soldstatus $164,300
ⓘ Source: listings_history table (triggers on properties + properties_extension) + one-shot
backfill from property_details.listing_events for pre-trigger history.
Tax reassessment forecast NY · Partial reset (capped growth)
- Current annual tax
- $9,041 · $753/mo
- Projected year-2 tax
- $9,041 · $753/mo
- Expected delta
- $0/yr ($0/mo · 0.0%)
ⓘ Screening estimate from a state-policy table — verify with the county assessor before closing.
Climate risk First Street
- Flood 1/10 Low FEMA zone X (unshaded) · 0% chance over 30 yrs
- Wildfire 1/10 Low
- Heat 4/10 Moderate 7 d/yr ≥99°F today · 16 d/yr by 30 yrs out
- Wind 3/10 Moderate 7% chance of damaging wind over 30 yrs
- Air quality 1/10 Low 0 unhealthy d/yr today · 0 by 30 yrs out
Nearby sold comps map
Loading sold comps map…
Walkable amenities ~0.75 mi
Loading nearby amenities…
Taxation est. · year 1
- Rental income
- $92,052
- − Mortgage interest
- −$27,952
- − Property taxes
- −$9,041
- − Insurance
- −$2,495
- − Repairs & maintenance
- −$7,364
- − Management
- −$7,364
- − Depreciation
- −$14,516
- Taxable income
- $23,320
- Est. tax owed @ 24.0%
- −$5,597
- After-tax cash flow
- $24,187/yr
For passive investors: Depreciation is non-cash, so a rental often shows a tax loss while cash-flowing — sheltering income. Rental losses are passive: they offset passive income freely, and up to $25,000/yr can offset ordinary (W-2) income if you actively participate and your MAGI is under $100k (phasing out to $0 by $150k); unused losses carry forward. On sale, claimed depreciation is recaptured at up to 25%, and gains may owe capital-gains tax (a 1031 exchange can defer both). Figures are a year-1 estimate at your 24.0% rate — not tax advice; consult a CPA.
Schools (NCES district)
- District
- Albany City School District
- NCES district ID
- 3602460
- Math proficiency
- 37% ▲ 6.00%
- Reading proficiency
- 40% ▲ 7.00%
- Median HH income
- $40,568
- Composite
- 32.34/100
- National rank
- #5744
- State rank
- #543 of 590 in NY
Livability — Albany
- Score
- 79/100
- State rank
- #129
- US rank
- #2083
Category grades
Schools grade is shown separately in the Schools card above.
Census & demographics
- Census place
- Albany, NY
- City population
- 116,921
- Population (ZIP)
- 10,754
Population outlook (Albany County) Hauer SSP2
- Today (2025)
- 320,794 people
- By 2030
- 327,401 · +2.1%
- By 2040
- 338,218 · +5.4%
- By 2050
- 348,467 · +8.6%
- By 2075
- 381,693 · +19.0%
- By 2100
- 393,809 · +22.8%
Race, ethnicity, and origin ACS 2023
- Neighborhood character
- Diverse neighborhood (Simpson 0.69)
- Race & ethnicity
- White 46% Black 23% Hispanic / Latino 19% Asian 8% Two or more races 7%
- Hispanic origin (detail)
- Puerto Rican 6%
- Common ancestry
- Romanian 4% Lithuanian 3% Serbian 1%
- Foreign-born
- 18% · Canada, Philippines, South Korea
- Languages at home
- 77% English-only · Spanish 13% Other Asian/Pacific 3% Tagalog/Filipino 1%
Political lean MEDSL · Albany
- 2024 margin
- Strong D (+25.8) · D 62.9% · R 37.1%
- 2008→2024 swing
- -3.6pp toward R · 2008: 29.4pp · 2024: 25.8pp
- All cycles
- 2024: D+25.8 2020: D+31.4 2016: D+24.3 2012: D+31.0 2008: D+29.4
Not yet ingested
- Civics
- —
Market trends
- HPI YoY
- ▼ -24.91%
- Current HPI
- 318.0191
- Rent YoY
- —
- Metro
- —
- State GDP YoY
- ▲ 2.60%
- F500 in state
- 92
Industry mix (Fortune 500 HQ in NY)
| Industry | F500 HQs | Revenue |
|---|---|---|
| Financial Services | 10 | $950B |
|
||
| Consumer Goods | 9 | $162B |
|
||
| Insurance | 4 | $225B |
|
||
| Telecommunications | 2 | $144B |
|
||
| Pharmaceuticals | 2 | $112B |
|
||
| Media / Entertainment | 2 | $69B |
|
||
Price history
+203.7% since first listed6 events — show timeline
- 2026-06-03 Price Changed $499,000 Global MLS
- 2026-04-28 Listed $575,000 Global MLS
- 2025-09-11 Listing Removed — Global MLS
- 2025-05-14 Listed $575,000 Global MLS
- 2020-09-15 Sold (Public Records) $150,000 Public Records
- 2008-05-22 Sold (Public Records) $164,300 Public Records
Property tax history
+3.1%/yrLatest (2025): $9,041 · +8.9% YoY. Source: county tax records.
Cash-flow waterfall
monthlySold comps — $/sqft
last 12 mo · ≤1 miLoading sold comps…