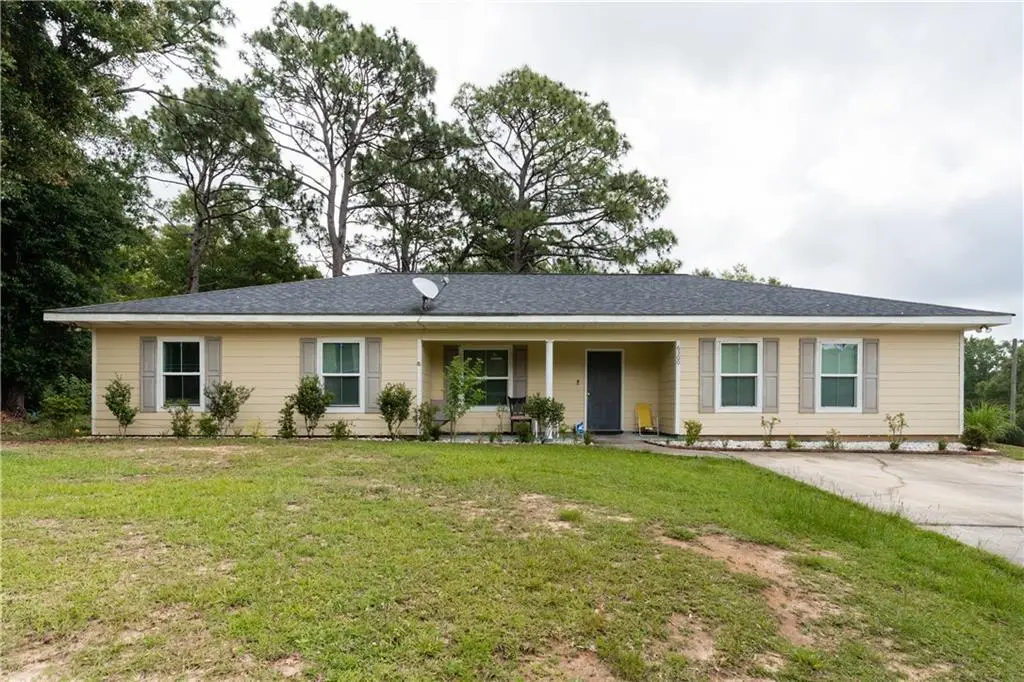
6300 Leflore Dr · Mobile, AL
Flood risk 1/10 · Minimal
- FEMA flood zone
- X (unshaded)
- Chance of flooding over 30 yrs
- 0.0%
- Est. flood insurance / yr
- $507 – $1,088
Fire risk 2/10 · Minimal
- Est. fire insurance / yr
- $916 – $1,700
Heat risk 9/10 · Severe
- Hot days now (above 104°F)
- 7 days/yr
- Hot days in 30 yrs
- 21 days/yr
Wind risk 9/10 · Severe
- Chance of severe wind over 30 yrs
- 99.0%
Air-quality risk 1/10 · Minimal
- Unhealthy air days now
- 0 days/yr
- Unhealthy air days in 30 yrs
- 0 days/yr
Risk factors via First Street. Map © Google.
Why this score? — see what drove the C- grade
The composite is a weighted blend of 9 inputs, each scored 0–100. Each bar is that input's sub-score; the figure is the points it added to the 100-point composite (weight × sub-score).
- Cash flow +22.2/30.0
- ARV discount +7.5/15.0
- DSCR +7.1/10.0
- 1% rule +4.6/10.0
- Rent growth +4.0/5.0
- Livability +3.8/5.0
- Condition / age +2.5/5.0
- Schools +2.3/10.0
- Appreciation +0.0/10.0
$190,210
🖨 Deal sheet 📄 Offer letter ✓ Due diligence
Listing remarks
* * VALUE RANGE MARKET: SELLER WILL ENTERTAIN OFFERS BETWEEN $190,000-$210,000 * * Spacious 6-bedroom, 2.5-bath home offering 1,985 square feet of comfortable living space. This open floor plan features hard flooring throughout, a spacious kitchen, and a split-bedroom layout that provides added privacy. Situated on a large corner lot, this property offers plenty of outdoor space and endless potential. Whether you're looking for a great family home or an excellent investment opportunity, this home is a must-see!
Key facts
- 0.36 acre lot
- 4 parking spots
- Built 2016
Property features AI
Exterior
- Parking: Driveway with space for 4 vehicles
- Utilities: Cable available; Electricity available (110V and 220V); Phone service available; Public sewer; Water available
- Home design: Single-family residence; Residential property; Located in the Hillsdale Heights subdivision
- Construction: Built in 2016; HardiPlank exterior; Shingle roof; Slab foundation
- Exterior features: Storage; No fencing; View available; No waterfront; No pool or spa; No other detached structures
Interior
- Kitchen: Electric range; Refrigerator; Laminate countertops
- Bedrooms: 6 bedrooms
- Flooring: Ceramic tile; Laminate
- Bathrooms: 2 full bathrooms; 1 half bathroom
- Heating & cooling: Central heating; Central air conditioning; Ceiling fans
- Interior features: 9-foot ceilings on the lower level; Open floorplan; Breakfast bar; Stained cabinets in the kitchen; Eat-in kitchen with pantry; Kitchen overlooks the family room; No fireplace; No basement
- Laundry & utility: Washer included; Electric water heater
Neighborhood map
What this means for you Summary
Snapshot
- This is a 6-bed/2.0-bath single-family listed at $190k.
Deal economics
- At list price, monthly cash flow is $308 ($4k/yr) — positive.
- The deal already cash-flows at list — no discount required.
- To meet the 1% rule (rent ≥ 1% of price), the offer needs to be $182k (4.4% below list).
- Recommended offer: $182k (4.4% below list) — sets the bar for 1% rule.
- Cap rate 8.2% vs local median 4.9% in Mobile — top-decile yield for the area; either an underpriced asset or a hidden risk that comps aren't pricing in. Stress-test before assuming the spread holds.
Location & tenants
- Location reads 75/100 on livability (#20 in AL, #4,262 nationally) — a middle-class / working-renter tenant base. Strengths: commute A+, cost of living A+, housing A+; Watch: crime F, employment D-.
- Mobile County (urban): math 15% / reading 39% proficiency, ranked #81 of 129 in AL (top 63%) — low school quality limits family demand, transient renter base, plan for 1-2y turnover; 67% free/reduced lunch — lower-income household profile, screen leases tightly.
- Zoned schools: John Will Elementary School (math 4% / reading 21%, grade F, #534 of 627 statewide, top 85%, 509 students, 89% FRL); Baker High School (math 25% / reading 28%, grade F, #107 of 305 statewide, top 36%, 2,491 students, 42% FRL) — zoned schools at 65% FRL track the district average.
- Market conditions: Rents rising fast (+6.2%/yr); 338 active listings in the ZIP; 1,678 units permitted in Mobile County in 2024 (264 in 5+ unit buildings).
- This rent runs 36% of the median local income ($61k/yr) — at the standard rent-burdened threshold; future hikes will face affordability resistance.
Forward outlook
- Local home prices are declining (-3.0%/yr); year-one equity from $1k of loan paydown is wiped out by about $6k of value loss. Plan a longer hold.
- Mobile County population projected to shrink 8% by 2050 — rents likely to lag national; underwrite the cash flow, not the appreciation.
- At projected returns (-3.0% appreciation + 6.2% rent growth), your $53k cash investment doubles in ~10 years — after that, you're playing with house money.
Negotiation context
- It's been on market 17 days — a 2% lower offer ($187k) is reasonable based on typical stale-listing flexibility.
Risks & watch-outs
- Climate carrying-cost: severe wind risk, 99% chance of damaging wind over 30y; extreme-heat days projected 7→21/yr by 2055 (HVAC capex compounding) — expect insurance premiums to compound above CPI over the hold.
Questions for the listing agent
- Is there a deadline driving the sale (1031 exchange, divorce, estate, relocation)? That informs how much negotiation room exists.
- Schools are D-rated, which usually means shorter tenancies and higher turnover. Who's the typical renter profile here, and what's been the actual vacancy rate?
- Crime grade is F in this area — have there been break-ins, vandalism, or insurance claims at this property in the last 3 years? What carrier currently insures it and at what premium?
- What's the average days-on-market for RENTAL listings here right now (not sales)? A rising rental-DOM trend means longer vacancies and softer asking-rent achievability than the comps imply.
- What's the recent tenant-quality profile in this submarket — average credit score on applications, eviction rate, late-payment / NSF rate, and stable-employment percentage? A property-management company in the area should have these aggregated.
- How much new for-sale + rental construction is in the pipeline within 1–3 miles? Heavy new supply typically softens prices + rents 12–24 months out; constrained supply supports both.
Investment metrics
- 1% rule
- 0.96% ✗
- Cap rate
- 8.24%
- Cash-on-cash
- 6.95%
- DSCR
- 1.31
- GRM
- 8.7
CMA / ARV
No comps found within radius.
Projected returns pro-forma
-3.0% appreciation · 6.15% rent growth · sell at horizon
- IRR
- -2.6%
- Equity multiple
- 0.90×
- Total profit
- $-5,314
- Equity at exit
- $28,361
- IRR
- 10.0%
- Equity multiple
- 1.87×
- Total profit
- $46,358
- Equity at exit
- $16,446
Cash invested: $53,259 (down + closing). Projections, not guarantees.
Landlord ↔ Tenant lean methodology
- Overall (STATE)
- 90 Strongly Landlord-Friendly
- State Alabama
- 90 Strongly Landlord-Friendly · R+15
- County
- — inherits STATE
- City
- — inherits STATE
ZIP-level market 36608
- Rents YoY
- 6.2%
- Active inventory
- 338
- Price-to-rent
- 8.7×
Monthly cashflow live
- Estimated rent
- $1,819 medium interval (Pro) →
- Mortgage (P&I)
- −$997
- Tax from tax record
- −$52 /mo · $624/yr
- Insurance
- −$79
- HOA
- −$0
- Vacancy / Maint / Mgmt
- −$382
- Net cashflow
- $308
Break-even live
UW: 25.0% down · 7.5% · 30yr · 1.5% tax · 5.0% vac · 8.0% maint · 8.0% mgmt
Financing live
Cash to close
- Down payment
- $47,552
- Closing costs
- $5,706
- Reserves months
- —
- Total cash needed
- —
Loan-product check · same deal, 3 products live
Conventional
25% down · 7.5% · 30yr
- Down + closing
- —
- Monthly P&I
- —
- Monthly cashflow
- —
- DSCR
- —
- Eligible?
- —
Personal DTI + credit; lowest rate.
DSCR
20% down · 8.5% · 30yr
- Down + closing
- —
- Monthly P&I
- —
- Monthly cashflow
- —
- DSCR
- —
- Eligible?
- —
No personal income docs; deal must DSCR.
Hard money
10% down · 12.0% · 12mo
- Down + closing
- —
- Monthly P&I
- —
- Monthly cashflow
- —
- DSCR
- —
- Eligible?
- —
Short-term bridge; refi at stabilization.
Listing history 14 events
-
2026-06-18days on market $190,210 Active 17 DOM
-
2026-06-17days on market $190,210 Active 16 DOM
-
2026-06-16days on market $190,210 Active 15 DOM
-
2026-06-15days on market $190,210 Active 14 DOM
-
2026-06-14days on market $190,210 Active 12 DOM
-
2026-06-13days on market $190,210 Active 11 DOM
-
2026-06-10days on market $190,210 Active 9 DOM
-
2026-06-09days on market $190,210 Active 8 DOM
-
2026-06-08days on market $190,210 Active 7 DOM
-
2026-06-07days on market $190,210 Active 6 DOM
-
2026-06-05days on market $190,210 Active 3 DOM
-
2026-06-03days on market $190,210 Active 2 DOM
-
2026-06-02remarks 520-char remark
-
2026-06-02$190,210 Active 1 DOM
ⓘ Source: listings_history table (triggers on properties + properties_extension) + one-shot
backfill from property_details.listing_events for pre-trigger history.
Tax reassessment forecast AL · Resets to sale price
- Current annual tax
- $624 · $52/mo
- Projected year-2 tax
- $780 · $65/mo
- Expected delta
- +$156/yr (+$13/mo · 25.0%)
ⓘ Screening estimate from a state-policy table — verify with the county assessor before closing.
Climate risk First Street
- Flood 1/10 Low FEMA zone X (unshaded) · 0% chance over 30 yrs
- Wildfire 2/10 Low
- Heat 9/10 Extreme 7 d/yr ≥104°F today · 21 d/yr by 30 yrs out
- Wind 9/10 Extreme 99% chance of damaging wind over 30 yrs
- Air quality 1/10 Low 0 unhealthy d/yr today · 0 by 30 yrs out
Nearby sold comps map
Loading sold comps map…
Walkable amenities ~0.75 mi
Loading nearby amenities…
Taxation est. · year 1
- Rental income
- $21,831
- − Mortgage interest
- −$10,655
- − Property taxes
- −$624
- − Insurance
- −$951
- − Repairs & maintenance
- −$1,746
- − Management
- −$1,746
- − Depreciation
- −$5,533
- Taxable income
- $575
- Est. tax owed @ 24.0%
- −$138
- After-tax cash flow
- $3,564/yr
For passive investors: Depreciation is non-cash, so a rental often shows a tax loss while cash-flowing — sheltering income. Rental losses are passive: they offset passive income freely, and up to $25,000/yr can offset ordinary (W-2) income if you actively participate and your MAGI is under $100k (phasing out to $0 by $150k); unused losses carry forward. On sale, claimed depreciation is recaptured at up to 25%, and gains may owe capital-gains tax (a 1031 exchange can defer both). Figures are a year-1 estimate at your 24.0% rate — not tax advice; consult a CPA.
Schools (NCES district)
- District
- Mobile County
- NCES district ID
- 0102370
- Math proficiency
- 15% ▼ -28.00%
- Reading proficiency
- 39% ▬ 0.00%
- Median HH income
- $42,455
- Composite
- 22.9/100
- National rank
- #8002
- State rank
- #81 of 129 in AL
Livability — Mobile
- Score
- 75/100
- State rank
- #20
- US rank
- #4262
Category grades
Schools grade is shown separately in the Schools card above.
Census & demographics
- Census place
- Mobile, AL
- County
- Mobile County · 246,577 people
- City population
- 205,729
- Metro
- Mobile, AL
- Population (ZIP)
- 38,890
- Household income
- $61,146
- Rent vs Own
- Severe rent burden
- 1823.0
Population outlook (Mobile County) Hauer SSP2
- Today (2025)
- 415,303 people
- By 2030
- 411,755 · -0.9%
- By 2040
- 399,670 · -3.8%
- By 2050
- 382,616 · -7.9%
- By 2075
- 337,353 · -18.8%
- By 2100
- 283,391 · -31.8%
Race, ethnicity, and origin ACS 2023
- Neighborhood character
- Diverse neighborhood (Simpson 0.56)
- Race & ethnicity
- White 56% Black 35% Two or more races 4% Hispanic / Latino 4% Asian 2%
- Common ancestry
- Lithuanian 3% Italian 2% Slovak 2%
- Foreign-born
- 4% · Canada
- Languages at home
- 95% English-only · Spanish 2% Arabic 1% Other Indo-European 1%
Political lean MEDSL · Mobile
- 2024 margin
- R (+16.4) · D 41.3% · R 57.7%
- 2008→2024 swing
- -7.7pp toward R · 2008: -8.7pp · 2024: -16.4pp
- All cycles
- 2024: R+16.4 2020: R+11.9 2016: R+13.9 2012: R+9.3 2008: R+8.7
Not yet ingested
- Civics
- —
Market trends
- HPI YoY
- ▼ -224.52%
- Current HPI
- 198.9469
- Rent YoY
- ▲ 6.15%
- Metro
- Mobile, AL
- State GDP YoY
- ▲ 2.94%
- F500 in state
- 4
Industry mix (Fortune 500 HQ in AL)
| Industry | F500 HQs | Revenue |
|---|---|---|
| Financial Services | 1 | $8B |
|
||
| Healthcare | 1 | $5B |
|
||
Price history
-84.1% since first listed3 events — show timeline
- 2026-06-01 Listed $190,210 GCMLS AL
- 2011-03-18 Sold (Public Records) $510,250 Public Records
- 2007-08-31 Sold (Public Records) $1,200,000 Public Records
Property tax history
+16.7%/yrLatest (2025): $624 · +6.0% YoY. Source: county tax records.
Cash-flow waterfall
monthlySold comps — $/sqft
last 12 mo · ≤1 miLoading sold comps…