5746 Tempest St · Jacksonville, FL
Flood risk 1/10 · Minimal
- FEMA flood zone
- X (unshaded)
- Chance of flooding over 30 yrs
- 0.0%
- Est. flood insurance / yr
- $507 – $1,088
Fire risk 4/10 · Minor
- Est. fire insurance / yr
- $947 – $1,759
Heat risk 8/10 · Major
- Hot days now (above 108°F)
- 7 days/yr
- Hot days in 30 yrs
- 20 days/yr
Wind risk 9/10 · Severe
- Chance of severe wind over 30 yrs
- 99.0%
Air-quality risk 3/10 · Minor
- Unhealthy air days now
- 3 days/yr
- Unhealthy air days in 30 yrs
- 4 days/yr
Risk factors via First Street. Map © Google.
Why this score? — see what drove the B grade
The composite is a weighted blend of 9 inputs, each scored 0–100. Each bar is that input's sub-score; the figure is the points it added to the 100-point composite (weight × sub-score).
- Cash flow +30.0/30.0
- 1% rule +10.0/10.0
- DSCR +10.0/10.0
- ARV discount +7.5/15.0
- Livability +4.2/5.0
- Schools +3.9/10.0
- Rent growth +3.1/5.0
- Condition / age +2.5/5.0
- Appreciation +0.0/10.0
$109,900
🖨 Deal sheet 📄 Offer letter ✓ Due diligence
Listing remarks
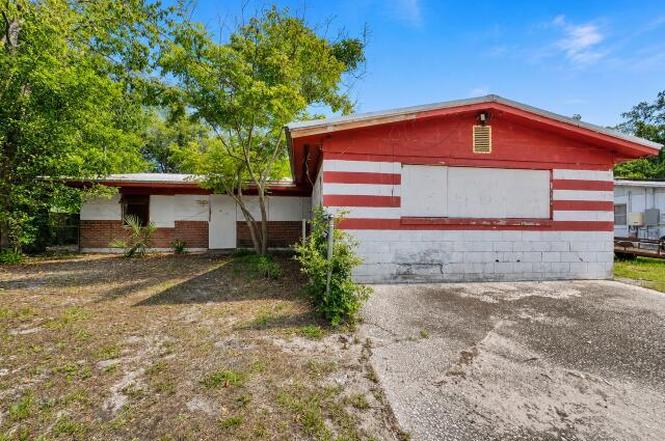
Bring your vision to this concrete block 3-bedroom, 2-bath home offering 1,768 square feet of living space in Jacksonville's established Westside. Located near Jacksonville Heights, this property sits in a convenient area with quick access to I-295, NAS Jacksonville, shopping, restaurants, parks, schools, and everyday services. The location makes it easy to enjoy everything the Westside has to offer while remaining just a short drive from downtown Jacksonville. Inside, you'll find a spacious floor plan with generously sized living areas and a layout that offers endless possibilities. The solid concrete block construction provides a strong foundation for your renovation plans, while the home
Key facts
- Desirable location
- Spacious floor plan
- 7,840 sq ft lot
Tags
Property features AI
Finance
- Other: Property currently used as residential single-family
- HOA & community: Not a senior community
Exterior
- Parking: Other parking type
- Utilities: Electricity available and connected
- Home design: Single-family residence; Ranch-style / single-story usage
- Exterior features: Lot around 0.18 acres
Interior
- Kitchen: Appliances included (unspecified)
- Bedrooms: 3 bedrooms
- Bathrooms: 2 full bathrooms
- Heating & cooling: Central heating (electric); Central air conditioning
- Interior features: Includes unspecified built-in appliances
Neighborhood map
What this means for you Summary
Snapshot
- This is a 3-bed/2.0-bath single-family listed at $110k.
Deal economics
- At list price, monthly cash flow is $484 ($6k/yr) — positive.
- The deal already cash-flows at list — no discount required.
- Meets the 1% rule at list price ($2k rent vs $110k).
- Cap rate 11.6% vs local median 4.0% in Jacksonville — top-decile yield for the area; either an underpriced asset or a hidden risk that comps aren't pricing in. Stress-test before assuming the spread holds.
Location & tenants
- Location reads 83/100 on livability (#50 in FL, #911 nationally) — a professional / high-income tenant draw. Strengths: amenities A+, commute A+, housing A+.
- Duval (urban): math 46% / reading 45% proficiency, ranked #48 of 73 in FL (top 66%) — families likely to look elsewhere, expect single-tenant / working-renter base with shorter leases.
- Market conditions: Rents rising (+2.2%/yr); 349 active listings in the ZIP; 40 comparable units currently listed for rent nearby; rentals at typical pace (median 17d on market — plan ~3-4 weeks tenant-placement turnaround); 6,503 units permitted in Duval County in 2024 (1,131 in 5+ unit buildings).
- This rent runs 34% of the median local income ($62k/yr) — at the standard rent-burdened threshold; future hikes will face affordability resistance.
Forward outlook
- Local home prices are declining (-3.0%/yr); year-one equity from $760 of loan paydown is wiped out by about $3k of value loss. Plan a longer hold.
- Duval County population projected at +19% by 2050 — long-run rental-demand tailwind backs the buy-and-hold thesis.
- At projected returns (-3.0% appreciation + 2.2% rent growth), your $31k cash investment doubles in ~7 years — after that, you're playing with house money.
Negotiation context
- Only 3 days on market — expect competitive offers; lowballing is unlikely to land.
Risks & watch-outs
- Watch-outs: property tax is 2.9% of price.
- Climate carrying-cost: severe wind risk, 99% chance of damaging wind over 30y; extreme-heat days projected 7→20/yr by 2055 (HVAC capex compounding) — expect insurance premiums to compound above CPI over the hold.
Questions for the listing agent
- Built in 1964 — when were the roof, HVAC, electrical panel, plumbing, and water heater last replaced?
- Property tax is high relative to price — has the assessment been appealed recently, and will the sale trigger a re-assessment?
- Is there a deadline driving the sale (1031 exchange, divorce, estate, relocation)? That informs how much negotiation room exists.
- Schools are B-rated — typically a magnet for longer-tenancy family renters. What's the average tenant stay here, and is there a school-zone premium baked into asking?
- What's the average days-on-market for RENTAL listings here right now (not sales)? A rising rental-DOM trend means longer vacancies and softer asking-rent achievability than the comps imply.
- What's the recent tenant-quality profile in this submarket — average credit score on applications, eviction rate, late-payment / NSF rate, and stable-employment percentage? A property-management company in the area should have these aggregated.
- How much new for-sale + rental construction is in the pipeline within 1–3 miles? Heavy new supply typically softens prices + rents 12–24 months out; constrained supply supports both.
Investment metrics
- 1% rule
- 1.58% ✓
- Cap rate
- 11.57%
- Cash-on-cash
- 18.86%
- DSCR
- 1.84
- GRM
- 5.3
CMA / ARV
- ARV (on-the-fly)
- $270,504
- Comps found
- 12
Show comp detail 12 sales within ~0.75 mi
| Address | Dist | Beds/Ba | Sqft | Sold | Price | $/sf | Match |
|---|---|---|---|---|---|---|---|
| 7856 Jaguar Dr | 0.18mi | 3/2.0 | 1,690 (-4%) | 5mo | $155,000 | $92 | 80 |
| 7860 Falcon St | 0.22mi | 3/2.0 | 1,682 (-5%) | 2mo | $260,000 | $155 | 80 |
| 7843 Lancia St N | 0.19mi | 4/2.0 (+1) | 1,640 (-7%) | 1mo | $274,000 | $167 | 73 |
| 7959 Lancia St N | 0.31mi | 4/1.0 (+1) | 1,680 (-5%) | 1mo | $250,000 | $149 | 68 |
| 8073 Violet Willow Ln | 0.55mi | 4/2.0 (+1) | 1,761 (-0%) | 3mo | $249,900 | $142 | 67 |
| 6097 Sage Willow Way | 0.59mi | 4/2.0 (+1) | 1,790 (+1%) | 5mo | $273,000 | $153 | 62 |
| 7474 Deepwood Dr N | 0.41mi | 3/2.0 | 1,553 (-12%) | 2mo | $175,000 | $113 | 60 |
| 7466 Deepwood Dr N | 0.41mi | 3/2.0 | 1,530 (-14%) | 3mo | $255,000 | $167 | 56 |
| 8079 Violet Willow Ln | 0.56mi | 4/2.0 (+1) | 1,640 (-7%) | 2mo | $254,000 | $155 | 56 |
| 8025 Triumph Ln S | 0.50mi | 3/2.0 | 1,572 (-11%) | 3mo | $224,000 | $142 | 56 |
| 6104 Golden Grove Rd W | 0.43mi | 3/2.0 | 1,504 (-15%) | 0mo | $166,500 | $111 | 55 |
| 7988 Renault Dr S | 0.39mi | 4/2.0 (+1) | 1,509 (-15%) | 2mo | $232,000 | $154 | 51 |
Match score weights: distance 35% · size 25% · config 20% · recency 20%. Top-matched comps best support the ARV.
Projected returns pro-forma
-3.0% appreciation · 2.25% rent growth · sell at horizon
- IRR
- 9.8%
- Equity multiple
- 1.38×
- Total profit
- $11,793
- Equity at exit
- $16,386
- IRR
- 18.3%
- Equity multiple
- 2.47×
- Total profit
- $45,095
- Equity at exit
- $9,502
Cash invested: $30,772 (down + closing). Projections, not guarantees.
Landlord ↔ Tenant lean methodology
- Overall (STATE)
- 87 Strongly Landlord-Friendly
- State Florida
- 87 Strongly Landlord-Friendly · R+3
- County
- — inherits STATE
- City
- — inherits STATE
ZIP-level market 32244
- Home prices YoY
- -17.8%
- Rents YoY
- 2.2%
- Active inventory
- 349
- Price-to-rent
- 5.3×
Monthly cashflow live
- Estimated rent
- $1,739 high interval (Pro) →
- Mortgage (P&I)
- −$576
- Tax from tax record
- −$268 /mo · $3,216/yr
- Insurance
- −$46
- HOA
- −$0
- Vacancy / Maint / Mgmt
- −$365
- Net cashflow
- $484
Break-even live
UW: 25.0% down · 7.5% · 30yr · 1.5% tax · 5.0% vac · 8.0% maint · 8.0% mgmt
Financing live
Cash to close
- Down payment
- $27,475
- Closing costs
- $3,297
- Reserves months
- —
- Total cash needed
- —
Loan-product check · same deal, 3 products live
Conventional
25% down · 7.5% · 30yr
- Down + closing
- —
- Monthly P&I
- —
- Monthly cashflow
- —
- DSCR
- —
- Eligible?
- —
Personal DTI + credit; lowest rate.
DSCR
20% down · 8.5% · 30yr
- Down + closing
- —
- Monthly P&I
- —
- Monthly cashflow
- —
- DSCR
- —
- Eligible?
- —
No personal income docs; deal must DSCR.
Hard money
10% down · 12.0% · 12mo
- Down + closing
- —
- Monthly P&I
- —
- Monthly cashflow
- —
- DSCR
- —
- Eligible?
- —
Short-term bridge; refi at stabilization.
Rent comps 40 comps
| Address | Beds | Baths | Sqft | Rent | $/sqft | DOM | Units | Dist |
|---|---|---|---|---|---|---|---|---|
| 7707 Falcon St Jacksonville, FL | 4.0 | 2.0 | 1300 | $2,000 | $1.54 | 17d | 1 | 0.15mi |
| 7901 Austin Rd Jacksonville, FL | 3.0 | 2.0 | 1268 | $1,815 | $1.43 | 24d | 1 | 0.20mi |
| 7948 Austin Rd Jacksonville, FL | 3.0 | 2.0 | 1335 | $1,775 | $1.33 | 4d | 1 | 0.26mi |
| 7947 Renault Dr Jacksonville, FL | 3.0 | 2.0 | 1285 | $1,500 | $1.17 | 17d | 1 | 0.26mi |
| 6019 Blank Dr Jacksonville, FL | 3.0 | 2.0 | 1520 | $1,500 | $0.99 | 24d | 1 | 0.32mi |
| 8050 103rd St Jacksonville, FL | 1.0–3.0 | 1.0–2.0 | 1025 | $1,575 | $1.54 | 2d | 11 | 0.43mi |
| 5524 Enchanted Dr Jacksonville, FL | 3.0 | 1.5 | 1237 | $1,580 | $1.28 | 3d | 1 | 0.43mi |
| 5905 Renault Dr W Jacksonville, FL | 4.0 | 2.0 | 1524 | $1,850 | $1.21 | 24d | 1 | 0.48mi |
| 8121 Cheryl Ann Ln Unit Le Sabre Townhouse Jacksonville, FL | 3.0 | 2.5 | 1601 | $1,950 | $1.22 | 4d | 1 | 0.50mi |
| 8180 Metto Rd Jacksonville, FL | 4.0 | 2.5 | 1665 | $1,859 | $1.12 | 16d | 1 | 0.58mi |
| 7796 Playschool Ln Jacksonville, FL | 3.0 | 2.5 | 1339 | $1,375 | $1.03 | 24d | 1 | 0.58mi |
| 7800 Playschool Ln Jacksonville, FL | 3.0 | 2.5 | 1339 | $1,361 | $1.02 | 15d | 1 | 0.58mi |
| 4781 Playschool Dr Jacksonville, FL | 3.0 | 2.5 | 1548 | $1,495 | $0.97 | 8d | 1 | 0.58mi |
| 7840 Playschool Ln Jacksonville, FL | 3.0 | 2.5 | 1339 | $1,398 | $1.04 | 15d | 1 | 0.58mi |
| 6241 Cranberry Ln E Jacksonville, FL | 4.0 | 2.0 | 2112 | $1,350 | $0.64 | 24d | 1 | 0.59mi |
| 7880 Playschool Ln Jacksonville, FL | 3.0 | 2.5 | 1339 | $1,495 | $1.12 | 16d | 1 | 0.60mi |
| 6109 Sage Willow Way Jacksonville, FL | 4.0 | 2.0 | 1760 | $1,921 | $1.09 | 21d | 1 | 0.62mi |
| 7851 Playschool Ln Jacksonville, FL | 3.0 | 3.0 | 1508 | $1,600 | $1.06 | 24d | 1 | 0.62mi |
| 4706 Playpen Dr Jacksonville, FL | 2.0 | 2.5 | 1330 | $1,321 | $0.99 | 8d | 1 | 0.70mi |
| 7364 Strato Rd Jacksonville, FL | 3.0 | 2.0 | 1412 | $1,750 | $1.24 | 24d | 1 | 0.71mi |
| 7911 Melvin Rd Jacksonville, FL | 3.0 | 2.5 | 1471 | $1,740 | $1.18 | 2d | 1 | 0.72mi |
| 7875 Melvin Rd Jacksonville, FL | 3.0 | 2.5 | 1464 | $1,650 | $1.13 | 4d | 1 | 0.73mi |
| 8325 Homeport Ct Jacksonville, FL | 3.0 | 2.0 | 1518 | $1,575 | $1.04 | 17d | 1 | 0.73mi |
| 8329 Homeport Ct Jacksonville, FL | 3.0 | 2.5 | 1281 | $1,695 | $1.32 | 15d | 1 | 0.74mi |
| 8341 Homeport Ct Jacksonville, FL | 3.0 | 2.5 | 1296 | $1,800 | $1.39 | 24d | 1 | 0.75mi |
| 7559 Proxima Rd Jacksonville, FL | 3.0 | 2.0 | 1308 | $1,499 | $1.15 | 24d | 1 | 0.77mi |
| 7952 118th St Jacksonville, FL | 4.0 | 2.5 | 1407 | $1,895 | $1.35 | 11d | 1 | 0.81mi |
| 7952 118th St Jacksonville, FL | 4.0 | 2.5 | 1407 | $1,895 | $1.35 | 8d | 1 | 0.81mi |
| 6263 Toyota Dr Jacksonville, FL | 3.0 | 2.0 | 1663 | $1,835 | $1.10 | 8d | 1 | 0.82mi |
| 8402 McGirts Village Ln Unit 7E Jacksonville, FL | 2.0 | 2.5 | 1319 | $1,198 | $0.91 | 8d | 1 | 0.89mi |
| 8419 McGirts Village Ln Jacksonville, FL | 3.0 | 2.5 | 1325 | $1,400 | $1.06 | 2d | 1 | 0.92mi |
| 8443 McGirts Village Ln Jacksonville, FL | 3.0 | 2.5 | 1325 | $1,381 | $1.04 | 8d | 1 | 0.95mi |
| 8515 Maple St Jacksonville, FL | 3.0 | 2.0 | 1255 | $1,499 | $1.19 | 3d | 1 | 0.96mi |
| 8460 McGirts Village Ln Jacksonville, FL | 3.0 | 2.5 | 1325 | $1,482 | $1.12 | 8d | 1 | 0.97mi |
| 8518 Maple St Jacksonville, FL | 3.0 | 2.0 | 1460 | $1,623 | $1.11 | 16d | 1 | 0.97mi |
| 8144 Colonnade Ct W Jacksonville, FL | 3.0 | 2.5 | 1307 | $1,745 | $1.34 | 24d | 1 | 0.98mi |
| 8485 McGirts Village Ln Jacksonville, FL | 3.0 | 2.5 | 1325 | $1,381 | $1.04 | 24d | 1 | 1.00mi |
| 4418 Melissa Ct W Unit Bedroom w/ private bath Jacksonville, FL | 3.0 | 2.5 | 1386 | $1,250 | $0.90 | 24d | 1 | 1.00mi |
| 4418 Melissa Ct W Jacksonville, FL | 3.0 | 2.5 | 1386 | $1,300 | $0.94 | 24d | 1 | 1.00mi |
| 4425 Jana Ln E Jacksonville, FL | 3.0 | 2.0 | 1284 | $1,690 | $1.32 | 12d | 1 | 1.00mi |
Listing history 4 events
-
2026-06-18days on market $109,900 Active 3 DOM
-
2026-06-17days on market $109,900 Active 2 DOM
-
2026-06-16remarks 699-char remark
-
2026-06-16$109,900 Active 1 DOM
ⓘ Source: listings_history table (triggers on properties + properties_extension) + one-shot
backfill from property_details.listing_events for pre-trigger history.
Tax reassessment forecast FL · Resets to sale price
- Current annual tax
- $3,216 · $268/mo
- Projected year-2 tax
- $3,216 · $268/mo
- Expected delta
- $0/yr ($0/mo · 0.0%)
ⓘ Screening estimate from a state-policy table — verify with the county assessor before closing.
Climate risk First Street
- Flood 1/10 Low FEMA zone X (unshaded) · 0% chance over 30 yrs
- Wildfire 4/10 Moderate
- Heat 8/10 Severe 7 d/yr ≥108°F today · 20 d/yr by 30 yrs out
- Wind 9/10 Extreme 99% chance of damaging wind over 30 yrs
- Air quality 3/10 Moderate 3 unhealthy d/yr today · 4 by 30 yrs out
Nearby sold comps map
Loading sold comps map…
Walkable amenities ~0.75 mi
Loading nearby amenities…
Taxation est. · year 1
- Rental income
- $20,866
- − Mortgage interest
- −$6,156
- − Property taxes
- −$3,216
- − Insurance
- −$550
- − Repairs & maintenance
- −$1,669
- − Management
- −$1,669
- − Depreciation
- −$3,197
- Taxable income
- $4,409
- Est. tax owed @ 24.0%
- −$1,058
- After-tax cash flow
- $4,745/yr
For passive investors: Depreciation is non-cash, so a rental often shows a tax loss while cash-flowing — sheltering income. Rental losses are passive: they offset passive income freely, and up to $25,000/yr can offset ordinary (W-2) income if you actively participate and your MAGI is under $100k (phasing out to $0 by $150k); unused losses carry forward. On sale, claimed depreciation is recaptured at up to 25%, and gains may owe capital-gains tax (a 1031 exchange can defer both). Figures are a year-1 estimate at your 24.0% rate — not tax advice; consult a CPA.
Schools (NCES district)
- District
- Duval
- NCES district ID
- 1200480
- Math proficiency
- 46% ▼ -11.00%
- Reading proficiency
- 45% ▼ -4.00%
- Median HH income
- $48,987
- Composite
- 38.97/100
- National rank
- #4076
- State rank
- #48 of 73 in FL
Livability — Jacksonville
- Score
- 83/100
- State rank
- #50
- US rank
- #911
Category grades
Schools grade is shown separately in the Schools card above.
Census & demographics
- Census place
- Jacksonville, FL
- County
- Duval County · 1,015,274 people
- City population
- 979,034
- Metro
- Jacksonville, FL
- Population (ZIP)
- 63,592
- Household income
- $62,204
- Rent vs Own
- Severe rent burden
- 2799.0
Population outlook (Duval County) Hauer SSP2
- Today (2025)
- 1,013,010 people
- By 2030
- 1,059,228 · +4.6%
- By 2040
- 1,141,439 · +12.7%
- By 2050
- 1,205,258 · +19.0%
- By 2075
- 1,324,282 · +30.7%
- By 2100
- 1,319,620 · +30.3%
Race, ethnicity, and origin ACS 2023
- Neighborhood character
- Highly diverse neighborhood (Simpson 0.70)
- Race & ethnicity
- White 39% Black 35% Hispanic / Latino 15% Two or more races 10% Asian 6%
- Hispanic origin (detail)
- Mexican 3% Puerto Rican 6% Cuban 3%
- Common ancestry
- Hispanic 1% Lithuanian 1% Romanian 1%
- Foreign-born
- 12% · Canada, Vietnam, China
- Languages at home
- 83% English-only · Spanish 9% Tagalog/Filipino 3% French/Haitian/Cajun 2%
Political lean MEDSL · Duval
- 2024 margin
- Toss-up / Even · D 48.7% · R 50.1% · Other 1.2%
- 2008→2024 swing
- +0.4pp no change · 2008: -1.9pp · 2024: -1.5pp
- All cycles
- 2024: R+1.5 2020: D+3.8 2016: R+1.5 2012: R+3.6 2008: R+1.9
Not yet ingested
- Civics
- —
Market trends
- HPI YoY
- ▼ -64.22%
- Current HPI
- 296.5375
- Rent YoY
- ▲ 2.25%
- Metro
- Jacksonville, FL
- State GDP YoY
- ▲ 3.28%
- F500 in state
- 36
Industry mix (Fortune 500 HQ in FL)
| Industry | F500 HQs | Revenue |
|---|---|---|
| Industrial Technology | 2 | $29B |
|
||
| Insurance | 2 | $17B |
|
||
| Retail | 1 | $60B |
|
||
| Technology Distribution | 1 | $58B |
|
||
| Homebuilding | 1 | $35B |
|
||
| Technology Manufacturing | 1 | $35B |
|
||
Price history
+4.2% since first listed2 events — show timeline
- 2026-06-15 Listed $109,900 realMLS
- 2024-01-24 Sold (Public Records) $105,500 Public Records
Property tax history
+15.3%/yrLatest (2025): $3,216 · +7.9% YoY. Source: county tax records.
Cash-flow waterfall
monthlySold comps — $/sqft
last 12 mo · ≤1 miLoading sold comps…