 Duplex
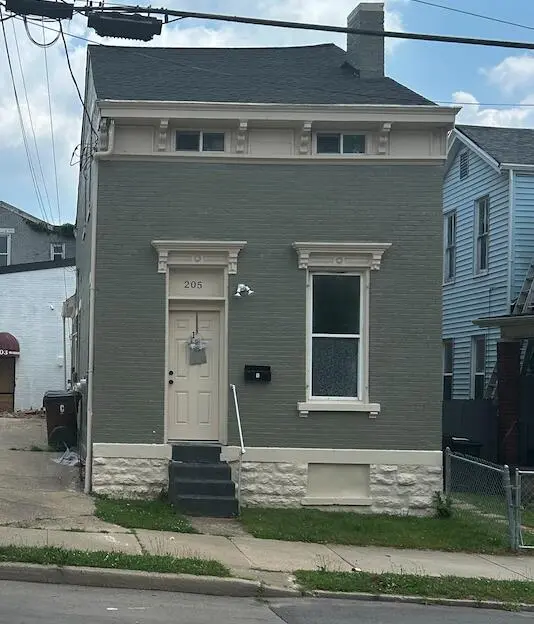
205 19th st St W · Covington, KY
Flood risk No data
- FEMA flood zone
- —
- Chance of flooding over 30 yrs
- —
- Est. flood insurance / yr
- —
Fire risk No data
- Est. fire insurance / yr
- —
Heat risk No data
- Hot days now (above threshold)
- —
- Hot days in 30 yrs
- —
Wind risk No data
- Chance of severe wind over 30 yrs
- —
Air-quality risk No data
- Unhealthy air days now
- —
- Unhealthy air days in 30 yrs
- —
Risk factors via First Street. Map © Google.
Why this score? — see what drove the C- grade
The composite is a weighted blend of 9 inputs, each scored 0–100. Each bar is that input's sub-score; the figure is the points it added to the 100-point composite (weight × sub-score).
- Cash flow +16.3/30.0
- ARV discount +13.8/15.0
- DSCR +5.0/10.0
- Condition / age +4.8/5.0
- 1% rule +4.4/10.0
- Livability +4.3/5.0
- Rent growth +3.8/5.0
- Schools +1.5/10.0
- Appreciation +0.0/10.0
$249,000
🖨 Deal sheet 📄 Offer letter ✓ Due diligence
Multi-family units
County records classify this as Multi-Family (2-4 Unit). Listing-text estimate: 2 units. confirmed
Listing remarks
Completely renovated and fully rented duplex. This was a complete rehab that was done with granite, luxury LVP, and quality finishes. Upgraded electrical. Brand new mini splits. All plumbing is brand new inside. Several New Windows. Unit 1 is a one bed one bath approximately 652 sq ft unit rented for 975 a month. Unit 2 is a one bed one bath with an additional large room downstairs that has the kitchen. It is approximately 918 sq ft and is rented for 1,275 a month. Both tenants have roughly 10 months remaining on their leases. Owner pays water. Building to be sold with 201-203 w 19th st.
Key facts
- Fully rented duplex
- Complete rehab
- Completely renovated
Tags
Property features AI
Finance
- Financial info: Total of 2 units
Exterior
- Parking: On-street parking
- Utilities: Public water; Public sewer; Sewer available; Water available
- Home design: Duplex (multi-family); Two levels; Existing structure
- Construction: Brick construction; Stone foundation
- Exterior features: Wood fencing; Vinyl window frames; Shingle roof; Has a view; Lot approximately 32 x 100
Interior
- Kitchen: Electric oven; Dishwasher; Microwave; Refrigerator
- Heating & cooling: Ductless cooling
- Interior features: Electric oven; Dishwasher; Microwave; Refrigerator
Neighborhood map
What this means for you Summary
Snapshot
- This is a 2 × 1-bed/1.0-bath units multifamily listed at $249k. Condition is rated excellent.
Deal economics
- At list price, monthly cash flow is $135 ($2k/yr) — positive. Per door: $67/mo.
- The deal already cash-flows at list — no discount required.
- To meet the 1% rule (rent ≥ 1% of price), the offer needs to be $235k (5.7% below list).
- Recommended offer: $235k (5.7% below list) — sets the bar for 1% rule.
- Cap rate 6.9% vs local median 5.3% in Covington — top-decile yield for the area; either an underpriced asset or a hidden risk that comps aren't pricing in. Stress-test before assuming the spread holds.
Location & tenants
- Location reads 86/100 on livability (#40 in KY, #376 nationally) — a professional / high-income tenant draw. Strengths: amenities A+, commute A+, cost of living A+; Watch: employment D+.
- Covington Independent (suburban): math 10% / reading 27% proficiency, ranked #162 of 165 in KY (top 98%) — low school quality limits family demand, transient renter base, plan for 1-2y turnover; 78% free/reduced lunch — lower-income household profile, screen leases tightly.
- Zoned schools: Glenn O Swing Elementary (math 29% / reading 50%, grade F, #208 of 676 statewide, top 34%, 407 students, 78% FRL); Holmes Middle School (math 8% / reading 26%, grade F, #211 of 217 statewide, top 97%, 656 students, 84% FRL); Holmes High School (math 12% / reading 17%, grade F, #227 of 254 statewide, top 89%, 878 students, 80% FRL) — zoned schools at 81% FRL track the district average.
- Market conditions: Rents rising fast (+5.1%/yr); 59 active listings in the ZIP; 18 comparable units currently listed for rent nearby; rentals leasing fast (median 8d on market — plan ~1-2 weeks tenant-placement turnaround); 699 units permitted in Kenton County in 2024 (287 in 5+ unit buildings).
- At $2,349/mo this rent would consume 46% of the median local household income ($61k/yr) (locally 511% of renters already pay >50% of income on rent) — very limited rent-growth headroom before tenants either downsize or default.
Forward outlook
- Local home prices are declining (-3.0%/yr); year-one equity from $2k of loan paydown is wiped out by about $7k of value loss. Plan a longer hold.
- Kenton County population projected at +5% by 2050 — modest demand growth; plan on rents tracking national, not racing it.
Negotiation context
- Only 7 days on market — expect competitive offers; lowballing is unlikely to land.
Questions for the listing agent
- Can we see the unit-by-unit rent roll, current vacancy, and any below-market leases? What's the average tenancy length?
- What capital expenditures (roof, boiler, parking lot, exteriors) have been made in the last 5 years, and what's planned in the next 2?
- Is there a deadline driving the sale (1031 exchange, divorce, estate, relocation)? That informs how much negotiation room exists.
- What's the average days-on-market for RENTAL listings here right now (not sales)? A rising rental-DOM trend means longer vacancies and softer asking-rent achievability than the comps imply.
- What's the recent tenant-quality profile in this submarket — average credit score on applications, eviction rate, late-payment / NSF rate, and stable-employment percentage? A property-management company in the area should have these aggregated.
- How much new apartment / multifamily construction is in the pipeline within 1–3 miles? Heavy new supply (>2% of stock underway) typically softens rents 12–24 months out; light construction supports rent growth.
Investment metrics
- 1% rule
- 0.94% ✗
- Cap rate
- 6.94%
- Cash-on-cash
- 2.32%
- DSCR
- 1.10
- GRM
- 8.8
CMA / ARV
- ARV (on-the-fly)
- $289,536
- Comps found
- 4
Show comp detail 4 sales within ~0.75 mi
| Address | Dist | Beds/Ba | Sqft | Sold | Price | $/sf | Match |
|---|---|---|---|---|---|---|---|
| 417 W 19th St | 0.17mi | 3/2.0 | 1,202 (-14%) | 7mo | $189,000 | $157 | 64 |
| 1823 Russell St | 0.07mi | 3/2.0 | 1,240 (-11%) | 19mo | $269,000 | $217 | 63 |
| 1616 Jefferson Ave | 0.39mi | 5/2.0 | 1,500 (+8%) | 14mo | $185,000 | $123 | 57 |
| 201 E 26th St | 0.68mi | 2/2.0 | 1,598 (+15%) | 8mo | $333,000 | $208 | 37 |
Match score weights: distance 35% · size 25% · config 20% · recency 20%. Top-matched comps best support the ARV.
Projected returns pro-forma
-3.0% appreciation · 5.13% rent growth · sell at horizon
- IRR
- -10.2%
- Equity multiple
- 0.62×
- Total profit
- $-26,579
- Equity at exit
- $37,127
- IRR
- 1.9%
- Equity multiple
- 1.14×
- Total profit
- $10,101
- Equity at exit
- $21,529
Cash invested: $69,720 (down + closing). Projections, not guarantees.
Landlord ↔ Tenant lean methodology
- Overall (STATE)
- 83 Strongly Landlord-Friendly
- State Kentucky
- 83 Strongly Landlord-Friendly · R+16
- County
- — inherits STATE
- City
- — inherits STATE
ZIP-level market 41014
- Rents YoY
- 5.1%
- Active inventory
- 59
- Price-to-rent
- 17.7×
Monthly cashflow live
- Estimated rent
- $2,349 high interval (Pro) →
- Mortgage (P&I)
- −$1,306
- Tax est. 1.5%
- −$311 /mo · $3,735/yr
- Insurance
- −$104
- HOA
- −$0
- Vacancy / Maint / Mgmt
- −$493
- Net cashflow
- $135
Break-even live
2-unit breakdown (identical units grouped — click to expand)
| Units | Beds | Baths | Est. rent |
|---|---|---|---|
| 2× units | 1 | 1 | $2,348 |
| #1 | 1 | 1 | $1,174 |
| #2 | 1 | 1 | $1,174 |
| Total (2 units) | $2,349 | ||
UW: 25.0% down · 7.5% · 30yr · 1.5% tax · 5.0% vac · 8.0% maint · 8.0% mgmt
Financing live
Cash to close
- Down payment
- $62,250
- Closing costs
- $7,470
- Reserves months
- —
- Total cash needed
- —
Loan-product check · same deal, 3 products live
Conventional
25% down · 7.5% · 30yr
- Down + closing
- —
- Monthly P&I
- —
- Monthly cashflow
- —
- DSCR
- —
- Eligible?
- —
Personal DTI + credit; lowest rate.
DSCR
20% down · 8.5% · 30yr
- Down + closing
- —
- Monthly P&I
- —
- Monthly cashflow
- —
- DSCR
- —
- Eligible?
- —
No personal income docs; deal must DSCR.
Hard money
10% down · 12.0% · 12mo
- Down + closing
- —
- Monthly P&I
- —
- Monthly cashflow
- —
- DSCR
- —
- Eligible?
- —
Short-term bridge; refi at stabilization.
Rent comps 18 comps
| Address | Beds | Baths | Sqft | Rent | $/sqft | DOM | Units | Dist |
|---|---|---|---|---|---|---|---|---|
| 1927 Scott St Apt 1 Covington, KY | 3.0 | 2.0 | 1865 | $2,100 | $1.13 | 20d | 1 | 0.29mi |
| 2307 Center St Covington, KY | 3.0 | 1.5 | 1216 | $1,950 | $1.60 | 7d | 1 | 0.42mi |
| 2030 Mackoy St Covington, KY | 3.0 | 1.5 | 1598 | $1,779 | $1.11 | 4d | 1 | 0.45mi |
| 1914 Eastern Ave Apt 3 Covington, KY | 1.0 | 1.0 | 900 | $995 | $1.11 | 14d | 1 | 0.63mi |
| 512 Wallace Ave Unit 512/18 Covington, KY | 2.0 | 2.0 | 900 | $1,299 | $1.44 | 7d | 1 | 0.66mi |
| 1205 Lee St Unit 3 Covington, KY | 3.0 | 2.5 | 1850 | $3,000 | $1.62 | 23d | 1 | 0.71mi |
| 344 E 13th St Unit 1 Covington, KY | 2.0 | 1.0 | 1000 | $1,275 | $1.27 | 23d | 1 | 0.87mi |
| 1025 Scott St Unit 2 Covington, KY | 2.0 | 2.0 | 1100 | $1,800 | $1.64 | 3d | 1 | 0.91mi |
| 1431 Dixie Hwy Park Hills, KY | 1.0–2.0 | 1.0–2.0 | 920 | $2,553 | $2.77 | 1d | 10 | 0.94mi |
| 1222 E Henry Clay Ave Fort Wright, KY | 3.0 | 1.5 | 1200 | $1,548 | $1.29 | 23d | 1 | 1.05mi |
| 2220 Cityscape Dr Covington, KY | 1.0–2.0 | 1.0–2.0 | 932 | $1,985 | $2.13 | 1d | 9 | 1.05mi |
| 119 W 33rd St Unit 1 Latonia, KY | 1.0 | 1.0 | 900 | $1,075 | $1.19 | 23d | 1 | 1.19mi |
| 634 Greenup St Covington, KY | 1.0 | 1.5 | 1050 | $1,595 | $1.52 | 7d | 1 | 1.20mi |
| 521 Garrard St Apt 3 Covington, KY | 1.0 | 1.0 | 875 | $1,996 | $2.28 | 14d | 1 | 1.30mi |
| 515 Main St Covington, KY | 1.0–2.0 | 1.0–2.0 | 934 | $2,215 | $2.37 | 1d | 8 | 1.32mi |
| 508 Greenup St Unit 508-02 Covington, KY | 2.0 | 1.0 | 1220 | $1,800 | $1.48 | 2d | 1 | 1.33mi |
| 1700 Aspen Pines Dr Wilder, KY | 1.0–3.0 | 1.0–2.5 | 1420 | $1,895 | $1.33 | 1d | 14 | 1.43mi |
| 103 E 3rd St Covington, KY | 2.0 | 2.5 | 1291 | $3,250 | $2.52 | 1d | 1 | 1.47mi |
Listing history 5 events
-
2026-06-18days on market $249,000 Active 7 DOM
-
2026-06-17days on market $249,000 Active 6 DOM
-
2026-06-16days on market $249,000 Active 5 DOM
-
2026-06-15remarks 594-char remark
-
2026-06-15$249,000 Active 4 DOM
ⓘ Source: listings_history table (triggers on properties + properties_extension) + one-shot
backfill from property_details.listing_events for pre-trigger history.
Nearby sold comps map
Loading sold comps map…
Walkable amenities ~0.75 mi
Loading nearby amenities…
Taxation est. · year 1
- Rental income
- $28,188
- − Mortgage interest
- −$13,948
- − Property taxes
- −$3,735
- − Insurance
- −$1,245
- − Repairs & maintenance
- −$2,255
- − Management
- −$2,255
- − Depreciation
- −$7,244
- Taxable loss
- −$2,494
- Est. tax savings @ 24.0%
- +$598
- After-tax cash flow
- $2,218/yr
For passive investors: Depreciation is non-cash, so a rental often shows a tax loss while cash-flowing — sheltering income. Rental losses are passive: they offset passive income freely, and up to $25,000/yr can offset ordinary (W-2) income if you actively participate and your MAGI is under $100k (phasing out to $0 by $150k); unused losses carry forward. On sale, claimed depreciation is recaptured at up to 25%, and gains may owe capital-gains tax (a 1031 exchange can defer both). Figures are a year-1 estimate at your 24.0% rate — not tax advice; consult a CPA.
Condition & rehab AI · 10 photos
This completely renovated and fully rented duplex is in excellent condition with no visible repairs needed. The property is move-in ready and offers high ROI for both resale and rental.
Value-add opportunities
- Both Landscaping — Enhances curb appeal and rental value
- Both Painting exterior — Maintains curb appeal and rental value
- Both Landscaping around the front door — Enhances curb appeal and rental value
Renovation cost estimate screening
Value-add ROI direction
- Both Landscaping — Enhances curb appeal and rental value ↑
- Both Painting exterior — Maintains curb appeal and rental value ↑
- Both Landscaping around the front door — Enhances curb appeal and rental value ↑
ⓘ Cost ranges are severity-bucket heuristics (US national rule-of-thumb). Get contractor quotes + a written scope before underwriting a rehab budget.
Schools (NCES district)
- District
- Covington Independent
- NCES district ID
- 2101350
- Math proficiency
- 10% ▼ -20.00%
- Reading proficiency
- 27% ▼ -14.00%
- Median HH income
- $33,681
- Composite
- 15.04/100
- National rank
- #9353
- State rank
- #162 of 165 in KY
Livability — Covington
- Score
- 86/100
- State rank
- #40
- US rank
- #376
Category grades
Schools grade is shown separately in the Schools card above.
Census & demographics
- Census place
- Covington, KY
- County
- Kenton County · 142,881 people
- City population
- 34,373
- Metro
- Cincinnati, OH-KY-IN
- Population (ZIP)
- 7,392
- Household income
- $61,382
- Rent vs Own
- Severe rent burden
- 511.0
Population outlook (Kenton County) Hauer SSP2
- Today (2025)
- 174,205 people
- By 2030
- 177,897 · +2.1%
- By 2040
- 182,671 · +4.9%
- By 2050
- 183,543 · +5.4%
- By 2075
- 178,977 · +2.7%
- By 2100
- 159,920 · -8.2%
Race, ethnicity, and origin ACS 2023
- Neighborhood character
- Predominantly White (71%)
- Race & ethnicity
- White 71% Two or more races 11% Hispanic / Latino 10% Black 8% Asian 2%
- Hispanic origin (detail)
- Mexican 1%
- Common ancestry
- Romanian 2% Lithuanian 1% Italian 1%
- Foreign-born
- 6% · Canada, China
- Languages at home
- 91% English-only · Spanish 8%
Political lean MEDSL · Kenton
- 2024 margin
- Strong R (+21.7) · D 38.2% · R 59.9% · Other 1.9%
- 2008→2024 swing
- -0.9pp no change · 2008: -20.9pp · 2024: -21.7pp
- All cycles
- 2024: R+21.7 2020: R+19.3 2016: R+26.1 2012: R+24.3 2008: R+20.9
Not yet ingested
- Civics
- —
Market trends
- HPI YoY
- ▼ -172.77%
- Current HPI
- 233.8216
- Rent YoY
- ▲ 5.13%
- Metro
- Cincinnati, OH-KY-IN
- State GDP YoY
- ▲ 1.81%
- F500 in state
- 4
Industry mix (Fortune 500 HQ in KY)
| Industry | F500 HQs | Revenue |
|---|---|---|
| Healthcare | 1 | $118B |
|
||
| Food / Beverage | 1 | $7B |
|
||
Price history
1 event — show timeline
- 2026-06-11 Listed $249,000 NKMLS
Cash-flow waterfall
monthlySold comps — $/sqft
last 12 mo · ≤1 miLoading sold comps…