3382 Dockside Ln · Melbourne Beach, FL
Flood risk 6/10 · Moderate
- FEMA flood zone
- X (unshaded)
- Chance of flooding over 30 yrs
- 0.72%
- Est. flood insurance / yr
- $507 – $1,088
Fire risk 1/10 · Minimal
- Est. fire insurance / yr
- $947 – $1,759
Heat risk 10/10 · Severe
- Hot days now (above 104°F)
- 7 days/yr
- Hot days in 30 yrs
- 22 days/yr
Wind risk 10/10 · Severe
- Chance of severe wind over 30 yrs
- 99.0%
Air-quality risk 1/10 · Minimal
- Unhealthy air days now
- 0 days/yr
- Unhealthy air days in 30 yrs
- 0 days/yr
Risk factors via First Street. Map © Google.
Why this score? — see what drove the D grade
The composite is a weighted blend of 9 inputs, each scored 0–100. Each bar is that input's sub-score; the figure is the points it added to the 100-point composite (weight × sub-score).
- Cash flow +12.0/30.0
- ARV discount +7.5/15.0
- Schools +4.7/10.0
- Livability +3.8/5.0
- 1% rule +3.6/10.0
- DSCR +3.5/10.0
- Rent growth +2.5/5.0
- Condition / age +2.5/5.0
- Appreciation +0.0/10.0
$289,900
🖨 Deal sheet (PDF) 📄 Offer letter ✓ Due diligence
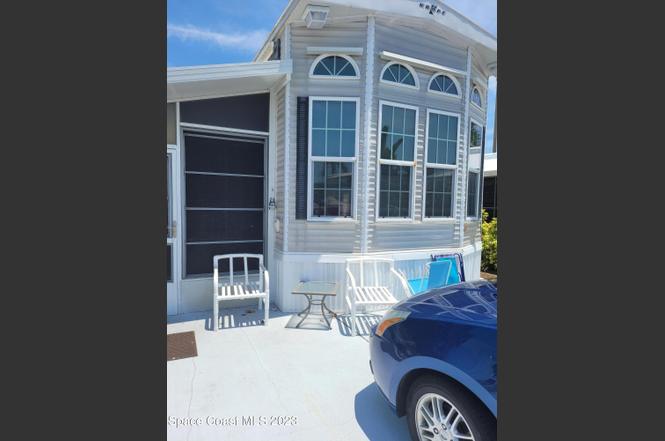
Listing remarks
1 bedroom with 2 lofts (3 queen beds), 3 pools, 2006 Kropt model. New Granite countertops. New vinyl flooring that looks like wood. Nicely furnished. Comes with everything. Fabulous rental history. You can rental daily, weekly, monthly. No restrictions. This unit has been reduced $30,000.00
Key facts
- 3,049 sq ft lot
- Community pool
- Built 2006
Property features AI
Finance
- Other: Unit is furnished
- HOA & community: Part of an association (Outdoor Resorts at Melbourne Beach); Quarterly association fee; Association amenities include boat dock, boat slip, cable TV, clubhouse, fitness center, laundry, grounds maintenance, full-time management, pickleball, shuffleboard, spa/hot tub, tennis courts, and trash service; Association fee covers cable TV, grounds maintenance, pest control, and trash
Exterior
- Parking: Additional parking
- Security: Key card entry; Security gate
- Utilities: Public sewer; Electricity connected; Water available; Cable available
- Home design: Manufactured home; Faces west; Single-family use
- Construction: Frame construction; Membrane roof
- Exterior features: Tennis court(s); Private boat ramp; Patio; Shed(s); Sprinklers in front and rear; Asphalt road frontage
Interior
- Kitchen: Electric range; Microwave; Refrigerator; Ice maker
- Bedrooms: 3 bedrooms
- Flooring: Vinyl
- Bathrooms: 1 full bathroom
- Heating & cooling: Central heating (electric); Central air conditioning (electric)
- Interior features: Ceiling fan(s); Eat-in kitchen; Primary bathroom with tub and shower; Primary bedroom on main floor
- Laundry & utility: Washer and dryer (in unit); Electric dryer hookup; Washer hookup; Electric water heater
Neighborhood map
What this means for you Summary
Snapshot
- This is a 3-bed/1.0-bath condo listed at $290k.
Deal economics
- At list price, monthly cash flow is $-71 ($-849/yr) — negative.
- To cash-flow at today's rent, offer at most $277k (4.3% below list).
- To meet the 1% rule (rent ≥ 1% of price), the offer needs to be $249k (14.1% below list).
- Recommended offer: $249k (14.1% below list) — sets the bar for 1% rule.
Location & tenants
- Location reads 75/100 on livability (#249 in FL, #3,935 nationally) — a middle-class / working-renter tenant base. Strengths: crime A+, health & safety A+, employment B+; Watch: amenities F, commute F, cost of living F.
- Brevard (suburban): math 53% / reading 57% proficiency, ranked #19 of 73 in FL (top 26%) — acceptable for families but not a draw, mixed tenant base, ~2y average lease.
- Zoned schools: Gemini Elementary School (math 80% / reading 79%, grade A, #116 of 2,144 statewide, top 6%, 468 students, 20% FRL); Herbert C. Hoover Middle School (math 67% / reading 64%, grade A-, #95 of 571 statewide, top 17%, 506 students, 38% FRL); Melbourne Senior High School (math 43% / reading 57%, grade D+, #175 of 667 statewide, top 27%, 2,249 students, 31% FRL).
- Market conditions: 218 active listings in the ZIP; solid renter incomes; 4,602 units permitted in Brevard County in 2024 (702 in 5+ unit buildings).
- This rent runs 30% of the median local income ($98k/yr) — at the standard rent-burdened threshold; future hikes will face affordability resistance.
Forward outlook
- Local home prices are declining (-3.0%/yr); year-one equity from $2k of loan paydown is wiped out by about $9k of value loss. Plan a longer hold.
- Brevard County population projected at +15% by 2050 — modest demand growth; plan on rents tracking national, not racing it.
Negotiation context
- It's been on market 886 days — a 12% lower offer ($255k) is reasonable based on typical stale-listing flexibility.
- 3 sale attempts since 3y ago; this cycle's ask has dropped $40k (12%) from the opening price — seller is motivated, your offer sets the floor, not the list.
- Current owner paid $75k; list at $290k implies a 287% gain — meaningful room to come down on a strong offer.
Risks & watch-outs
- Climate carrying-cost: major flood risk; severe wind risk, 99% chance of damaging wind over 30y; extreme-heat days projected 7→22/yr by 2055 (HVAC capex compounding) — expect insurance premiums to compound above CPI over the hold.
Questions for the listing agent
- What do current leases actually rent for vs. the listed asking? Can we see a recent rent roll and the last 12 months of T-12 income?
- It's been on market 886 days. Have you received any prior offers? Is the seller open to a 14% concession, seller financing, or rate buy-down credit?
- What does the HOA fee cover, when was the last increase, and are there any pending special assessments or reserve-fund shortfalls?
- Any open or pending special assessments — roof, HVAC, plumbing, elevator, façade? What's the per-unit balance and payoff schedule, and is the seller paying it off at close or rolling it to the buyer?
- Why hasn't it sold? Are there any deal-killer items the seller is aware of (foundation, flood, title, zoning, code violations)?
- Is there a deadline driving the sale (1031 exchange, divorce, estate, relocation)? That informs how much negotiation room exists.
- Schools are A-rated — typically a magnet for longer-tenancy family renters. What's the average tenant stay here, and is there a school-zone premium baked into asking?
- The area grade is low — what's the realistic commute time and amenity access for the typical tenant pool here? Any planned neighborhood developments (good or bad) we should know about?
- What's the average days-on-market for RENTAL listings here right now (not sales)? A rising rental-DOM trend means longer vacancies and softer asking-rent achievability than the comps imply.
- What's the recent tenant-quality profile in this submarket — average credit score on applications, eviction rate, late-payment / NSF rate, and stable-employment percentage? A property-management company in the area should have these aggregated.
- How much new apartment / multifamily construction is in the pipeline within 1–3 miles? Heavy new supply (>2% of stock underway) typically softens rents 12–24 months out; light construction supports rent growth.
Investment metrics
- 1% rule
- 0.86% ✗
- Cap rate
- 6.00%
- Cash-on-cash
- -1.05%
- DSCR
- 0.95
- GRM
- 9.7
CMA / ARV
No comps found within radius.
Projected returns pro-forma
-3.0% appreciation · 3.0% rent growth · sell at horizon
- IRR
- -18.0%
- Equity multiple
- 0.37×
- Total profit
- $-51,426
- Equity at exit
- $43,225
- IRR
- -10.2%
- Equity multiple
- 0.38×
- Total profit
- $-50,348
- Equity at exit
- $25,065
Cash invested: $81,172 (down + closing). Projections, not guarantees.
Landlord ↔ Tenant lean methodology
- Overall (STATE)
- 87 Strongly Landlord-Friendly
- State Florida
- 87 Strongly Landlord-Friendly · R+3
- County
- — inherits STATE
- City
- — inherits STATE
ZIP-level market 32951
- Active inventory
- 218
- Price-to-rent
- 9.7×
Monthly cashflow live
- Estimated rent
- $2,490 medium interval (Pro) →
- Mortgage (P&I)
- −$1,520
- Tax from tax record
- −$167 /mo · $1,998/yr
- Insurance
- −$121
- HOA
- −$230
- Vacancy / Maint / Mgmt
- −$523
- Net cashflow
- $-71
Break-even live
Sensitivity live
| Price | -10% $93 | -5% $11 | +0% $-71 | +5% $-153 | +10% $-235 |
|---|---|---|---|---|---|
| Rent | -10% $-267 | -5% $-169 | +0% $-71 | +5% $28 | +10% $126 |
| Rate | -1.0pp $75 | -0.5pp $3 | base $-71 | +0.5pp $-146 | +1.0pp $-222 |
UW: 25.0% down · 7.5% · 30yr · 1.5% tax · 5.0% vac · 8.0% maint · 8.0% mgmt
Financing live
Cash to close
- Down payment
- $72,475
- Closing costs
- $8,697
- Reserves months
- —
- Total cash needed
- —
Loan-product check · same deal, 3 products live
Conventional
25% down · 7.5% · 30yr
- Down + closing
- —
- Monthly P&I
- —
- Monthly cashflow
- —
- DSCR
- —
- Eligible?
- —
Personal DTI + credit; lowest rate.
DSCR
20% down · 8.5% · 30yr
- Down + closing
- —
- Monthly P&I
- —
- Monthly cashflow
- —
- DSCR
- —
- Eligible?
- —
No personal income docs; deal must DSCR.
Hard money
10% down · 12.0% · 12mo
- Down + closing
- —
- Monthly P&I
- —
- Monthly cashflow
- —
- DSCR
- —
- Eligible?
- —
Short-term bridge; refi at stabilization.
HOA detail condo
- Monthly dues
- $230 · $2,760/yr
- Likely covers
- pool
- Assessments
- None detected in remarks — confirm with the listing agent.
Listing history 31 events
-
2026-06-22days on market $289,900 Active 886 DOM
-
2026-06-18days on market $289,900 Active 883 DOM
-
2026-06-17days on market $289,900 Active 882 DOM
-
2026-06-16days on market $289,900 Active 881 DOM
-
2026-06-15days on market $289,900 Active 880 DOM
-
2026-06-14days on market $289,900 Active 878 DOM
-
2026-06-10days on market $289,900 Active 875 DOM
-
2026-06-08days on market $289,900 Active 873 DOM
-
2026-06-07days on market $289,900 Active 872 DOM
-
2026-06-05days on market $289,900 Active 869 DOM
-
2026-06-03days on market $289,900 Active 868 DOM
-
2026-06-02days on market $289,900 Active 867 DOM
-
2026-06-01days on market $289,900 Active 866 DOM
-
2026-05-31days on market $289,900 Active 865 DOM
-
2026-05-04status Active
-
2026-02-18historical
-
2026-02-18price $289,900
-
2026-01-08price $287,500
-
2026-01-06price $287,900
-
2025-12-11price $288,900
-
2025-12-03status Active
-
2025-11-28price $289,900
-
2025-11-28historical
-
2025-05-05price $299,900
-
2025-04-17price $309,900
-
2025-04-03price $319,900
-
2024-12-18price $324,900
-
2023-10-30$329,900 Active
-
2012-05-08soldstatus $75,000
-
1990-03-01soldstatus $22,000
-
1981-11-01soldstatus $26,500
ⓘ Source: listings_history table (triggers on properties + properties_extension) + one-shot
backfill from property_details.listing_events for pre-trigger history.
Tax reassessment forecast FL · Resets to sale price
- Current annual tax
- $1,998 · $167/mo
- Projected year-2 tax
- $2,406 · $201/mo
- Expected delta
- +$408/yr (+$34/mo · 20.4%)
ⓘ Screening estimate from a state-policy table — verify with the county assessor before closing.
Climate risk First Street
- Flood 6/10 Major FEMA zone X (unshaded) · 72% chance over 30 yrs
- Wildfire 1/10 Low
- Heat 10/10 Extreme 7 d/yr ≥104°F today · 22 d/yr by 30 yrs out
- Wind 10/10 Extreme 99% chance of damaging wind over 30 yrs
- Air quality 1/10 Low 0 unhealthy d/yr today · 0 by 30 yrs out
Nearby sold comps map
Loading sold comps map…
Walkable amenities ~0.75 mi
Loading nearby amenities…
Taxation est. · year 1
- Rental income
- $29,875
- − Mortgage interest
- −$16,239
- − Property taxes
- −$1,998
- − Insurance
- −$1,450
- − Repairs & maintenance
- −$2,390
- − Management
- −$2,390
- − HOA
- −$2,760
- − Depreciation
- −$8,433
- Taxable loss
- −$5,785
- Est. tax savings @ 24.0%
- +$1,388
- After-tax cash flow
- $539/yr
For passive investors: Depreciation is non-cash, so a rental often shows a tax loss while cash-flowing — sheltering income. Rental losses are passive: they offset passive income freely, and up to $25,000/yr can offset ordinary (W-2) income if you actively participate and your MAGI is under $100k (phasing out to $0 by $150k); unused losses carry forward. On sale, claimed depreciation is recaptured at up to 25%, and gains may owe capital-gains tax (a 1031 exchange can defer both). Figures are a year-1 estimate at your 24.0% rate — not tax advice; consult a CPA.
Schools (NCES district)
- District
- Brevard
- NCES district ID
- 1200150
- Math proficiency
- 53% ▼ -9.00%
- Reading proficiency
- 57% ▼ -4.00%
- Median HH income
- $49,426
- Composite
- 46.86/100
- National rank
- #2370
- State rank
- #19 of 73 in FL
Livability — Melbourne Beach
- Score
- 75/100
- State rank
- #249
- US rank
- #3935
Category grades
Schools grade is shown separately in the Schools card above.
Census & demographics
- County
- Brevard County · 602,871 people
- City population
- 11,299
- Metro
- Palm Bay-Melbourne-Titusville, FL
- Population (ZIP)
- 11,299
- Household income
- $98,420
- Rent vs Own
- Severe rent burden
- 196.0
Population outlook (Brevard County) Hauer SSP2
- Today (2025)
- 623,254 people
- By 2030
- 648,420 · +4.0%
- By 2040
- 690,009 · +10.7%
- By 2050
- 715,669 · +14.8%
- By 2075
- 775,744 · +24.5%
- By 2100
- 776,687 · +24.6%
Race, ethnicity, and origin ACS 2023
- Neighborhood character
- Predominantly White (89%)
- Race & ethnicity
- White 89% Two or more races 5% Hispanic / Latino 5% Asian 1%
- Common ancestry
- Romanian 6% Slovak 3% Lithuanian 3%
- Foreign-born
- 6% · Canada
- Languages at home
- 95% English-only · Spanish 3% French/Haitian/Cajun 1% Other Indo-European 1%
Political lean MEDSL · Brevard
- 2024 margin
- Strong R (+20.8) · D 39.1% · R 59.9% · Other 1.0%
- 2008→2024 swing
- -10.4pp toward R · 2008: -10.4pp · 2024: -20.8pp
- All cycles
- 2024: R+20.8 2020: R+16.4 2016: R+19.8 2012: R+12.7 2008: R+10.4
Not yet ingested
- Civics
- —
Market trends
- HPI YoY
- ▼ -209.56%
- Current HPI
- 379.9073
- Rent YoY
- —
- Metro
- Palm Bay-Melbourne-Titusville, FL
- State GDP YoY
- ▲ 3.28%
- F500 in state
- 36
Industry mix (Fortune 500 HQ in FL)
| Industry | F500 HQs | Revenue |
|---|---|---|
| Industrial Technology | 2 | $29B |
|
||
| Insurance | 2 | $17B |
|
||
| Retail | 1 | $60B |
|
||
| Technology Distribution | 1 | $58B |
|
||
| Homebuilding | 1 | $35B |
|
||
| Technology Manufacturing | 1 | $35B |
|
||
Price history
+994.0% since first listed17 events — show timeline
- 2026-05-04 Relisted — SCMLS
- 2026-02-18 Price Changed $289,900 SCMLS
- 2026-02-18 Listing Removed — SCMLS
- 2026-01-08 Price Changed $287,500 SCMLS
- 2026-01-06 Price Changed $287,900 SCMLS
- 2025-12-11 Price Changed $288,900 SCMLS
- 2025-12-03 Relisted — SCMLS
- 2025-11-28 Price Changed $289,900 SCMLS
- 2025-11-28 Listing Removed — SCMLS
- 2025-05-05 Price Changed $299,900 SCMLS
- 2025-04-17 Price Changed $309,900 SCMLS
- 2025-04-03 Price Changed $319,900 SCMLS
- 2024-12-18 Price Changed $324,900 SCMLS
- 2023-10-30 Listed $329,900 SCMLS
- 2012-05-08 Sold (Public Records) $75,000 Public Records
- 1990-03-01 Sold (Public Records) $22,000 Public Records
- 1981-11-01 Sold (Public Records) $26,500 Public Records
Property tax history
+6.3%/yrLatest (2025): $1,998 · +4.4% YoY. Source: county tax records.
Cash-flow waterfall
monthlySold comps — $/sqft
last 12 mo · ≤1 miLoading sold comps…