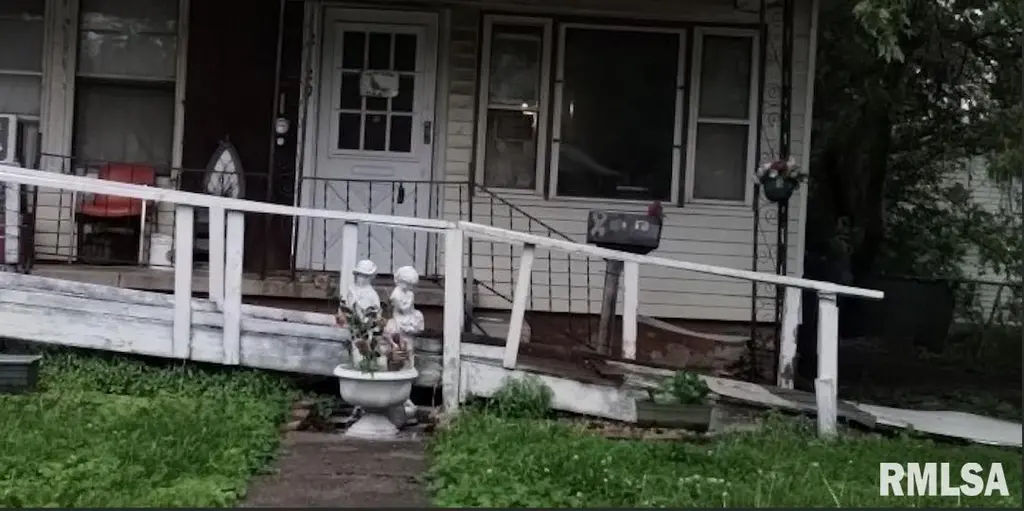
2129 N 16th St · Springfield, IL
Flood risk 3/10 · Minor
- FEMA flood zone
- X (unshaded)
- Chance of flooding over 30 yrs
- 0.2%
- Est. flood insurance / yr
- $473 – $860
Fire risk 1/10 · Minimal
- Est. fire insurance / yr
- $804 – $1,492
Heat risk 4/10 · Minor
- Hot days now (above 104°F)
- 7 days/yr
- Hot days in 30 yrs
- 20 days/yr
Wind risk 2/10 · Minimal
- Chance of severe wind over 30 yrs
- 1.0%
Air-quality risk 2/10 · Minimal
- Unhealthy air days now
- 1 days/yr
- Unhealthy air days in 30 yrs
- 1 days/yr
Risk factors via First Street. Map © Google.
Why this score? — see what drove the B- grade
The composite is a weighted blend of 9 inputs, each scored 0–100. Each bar is that input's sub-score; the figure is the points it added to the 100-point composite (weight × sub-score).
- Cash flow +30.0/30.0
- 1% rule +10.0/10.0
- DSCR +10.0/10.0
- ARV discount +7.5/15.0
- Livability +4.0/5.0
- Rent growth +3.7/5.0
- Condition / age +2.5/5.0
- Schools +1.7/10.0
- Appreciation +0.0/10.0
$42,900
🖨 Deal sheet 📄 Offer letter ✓ Due diligence
Listing remarks MLS
Calling those investors who are looking for a project with great potential for your portfolio or a home to fix up yourself at an affordable price. this home is ready for improvements located just blocks away from the state fair grounds. Features an ADA ramp and an unfinished basement. Selling As-Is.
Key facts
- Unfinished basement
- Ada ramp
- Parking
Tags
Neighborhood map
What this means for you Summary
Snapshot
- This is a 2-bed/1.0-bath single-family listed at $43k.
Deal economics
- At list price, monthly cash flow is $521 ($6k/yr) — positive.
- The deal already cash-flows at list — no discount required.
- Meets the 1% rule at list price ($1k rent vs $43k).
- Recommended offer: $42k (1.5% below list) — sets the bar for market timing.
- Cap rate 20.9% vs local median 4.9% in Springfield — top-decile yield for the area; either an underpriced asset or a hidden risk that comps aren't pricing in. Stress-test before assuming the spread holds.
Location & tenants
- Location reads 79/100 on livability (#122 in IL, #2,138 nationally) — a middle-class / working-renter tenant base. Strengths: amenities A+, commute A+, cost of living A+; Watch: schools D+, crime F.
- Springfield SD 186 (urban): math 17% / reading 22% proficiency, ranked #438 of 620 in IL (top 71%) — low school quality limits family demand, transient renter base, plan for 1-2y turnover; 64% free/reduced lunch — lower-income household profile, screen leases tightly.
- Market conditions: Rents rising fast (+5.0%/yr); 131 active listings in the ZIP; 7 comparable units currently listed for rent nearby; rentals at typical pace (median 21d on market — plan ~3-4 weeks tenant-placement turnaround); 43% of comp listings sitting > 30 days — soft ceiling on asking rent; 225 units permitted in Sangamon County in 2024 (48 in 5+ unit buildings).
Forward outlook
- Local home prices are declining (-3.0%/yr); year-one equity from $297 of loan paydown is wiped out by about $1k of value loss. Plan a longer hold.
- Sangamon County population projected to shrink 9% by 2050 — rents likely to lag national; underwrite the cash flow, not the appreciation.
- At projected returns (-3.0% appreciation + 5.0% rent growth), your $12k cash investment doubles in ~3 years — after that, you're playing with house money.
Negotiation context
- It's been on market 19 days — a 2% lower offer ($42k) is reasonable based on typical stale-listing flexibility.
- 6 sale attempts since 22y ago with the ask held roughly flat each time — persistent listings suggest the price (not the market) is what's stuck; bring a comps-based counter.
Risks & watch-outs
- Watch-outs: property tax is 3.1% of price; built in 1929 — expect roof / HVAC / electrical / plumbing capex.
Questions for the listing agent
- Built in 1929 — when were the roof, HVAC, electrical panel, plumbing, and water heater last replaced?
- Property tax is high relative to price — has the assessment been appealed recently, and will the sale trigger a re-assessment?
- Is there a deadline driving the sale (1031 exchange, divorce, estate, relocation)? That informs how much negotiation room exists.
- Schools are D-rated, which usually means shorter tenancies and higher turnover. Who's the typical renter profile here, and what's been the actual vacancy rate?
- Crime grade is F in this area — have there been break-ins, vandalism, or insurance claims at this property in the last 3 years? What carrier currently insures it and at what premium?
- What's the average days-on-market for RENTAL listings here right now (not sales)? A rising rental-DOM trend means longer vacancies and softer asking-rent achievability than the comps imply.
- What's the recent tenant-quality profile in this submarket — average credit score on applications, eviction rate, late-payment / NSF rate, and stable-employment percentage? A property-management company in the area should have these aggregated.
- How much new for-sale + rental construction is in the pipeline within 1–3 miles? Heavy new supply typically softens prices + rents 12–24 months out; constrained supply supports both.
Investment metrics
- 1% rule
- 2.58% ✓
- Cap rate
- 20.86%
- Cash-on-cash
- 52.02%
- DSCR
- 3.31
- GRM
- 3.2
CMA / ARV
- ARV (median comp)
- $102,528
- List price
- $42,900
- Delta
- -52.21%
- Verdict
- UNDERPRICED
- Comps
- 20 within 1.0 mi
Show comp detail 12 sales within ~0.75 mi
| Address | Dist | Beds/Ba | Sqft | Sold | Price | $/sf | Match |
|---|---|---|---|---|---|---|---|
| 2021 N Peoria Rd | 0.34mi | 2/1.0 | 1,102 (+2%) | 1mo | $80,000 | $73 | 81 |
| 1722 N Peoria Rd | 0.59mi | 2/1.0 | 1,133 (+5%) | 1mo | $135,000 | $119 | 64 |
| 1605 N 21st St | 0.65mi | 3/1.0 (+1) | 1,074 (-1%) | 1mo | $100,000 | $93 | 63 |
| 2072 N 20th St | 0.28mi | 2/1.5 | 947 (-13%) | 3mo | $134,000 | $141 | 62 |
| 1824 N 22nd St | 0.53mi | 3/2.0 (+1) | 1,100 (+2%) | 3mo | $152,500 | $139 | 61 |
| 1905 N 21st St | 0.42mi | 3/1.0 (+1) | 1,184 (+9%) | 2mo | $115,000 | $97 | 58 |
| 1908 N 19th St | 0.34mi | 3/1.0 (+1) | 1,216 (+12%) | 4mo | $98,000 | $81 | 56 |
| 1504 Carolina Ave | 0.74mi | 3/1.0 (+1) | 1,057 (-2%) | 3mo | $31,000 | $29 | 54 |
| 4 Midland Ct | 0.56mi | 3/1.0 (+1) | 1,175 (+8%) | 4mo | $113,500 | $97 | 51 |
| 1717 E Keys Ave | 0.73mi | 2/2.0 | 1,014 (-6%) | 1mo | $112,000 | $110 | 51 |
| 1516 Fairfield Dr | 0.55mi | 3/1.0 (+1) | 968 (-11%) | 2mo | $107,900 | $111 | 50 |
| 1301 E Morton Ave | 0.60mi | 3/1.0 (+1) | 1,210 (+12%) | 4mo | $77,500 | $64 | 44 |
Match score weights: distance 35% · size 25% · config 20% · recency 20%. Top-matched comps best support the ARV.
Projected returns pro-forma
-3.0% appreciation · 4.95% rent growth · sell at horizon
- IRR
- 52.4%
- Equity multiple
- 3.37×
- Total profit
- $28,481
- Equity at exit
- $6,397
- IRR
- 58.5%
- Equity multiple
- 7.43×
- Total profit
- $77,186
- Equity at exit
- $3,709
Cash invested: $12,012 (down + closing). Projections, not guarantees.
Landlord ↔ Tenant lean methodology
- Overall (STATE)
- 43 Moderately Tenant-Leaning
- State Illinois
- 43 Moderately Tenant-Leaning · D+7
- County
- — inherits STATE
- City
- — inherits STATE
ZIP-level market 62702
- Home prices YoY
- -34.9%
- Rents YoY
- 5.0%
- Active inventory
- 131
- Price-to-rent
- 3.2×
Monthly cashflow live
- Estimated rent
- $1,109 high interval (Pro) →
- Mortgage (P&I)
- −$225
- Tax from tax record
- −$112 /mo · $1,348/yr
- Insurance
- −$18
- HOA
- −$0
- Vacancy / Maint / Mgmt
- −$233
- Net cashflow
- $521
Break-even live
UW: 25.0% down · 7.5% · 30yr · 1.5% tax · 5.0% vac · 8.0% maint · 8.0% mgmt
Financing live
Cash to close
- Down payment
- $10,725
- Closing costs
- $1,287
- Reserves months
- —
- Total cash needed
- —
Loan-product check · same deal, 3 products live
Conventional
25% down · 7.5% · 30yr
- Down + closing
- —
- Monthly P&I
- —
- Monthly cashflow
- —
- DSCR
- —
- Eligible?
- —
Personal DTI + credit; lowest rate.
DSCR
20% down · 8.5% · 30yr
- Down + closing
- —
- Monthly P&I
- —
- Monthly cashflow
- —
- DSCR
- —
- Eligible?
- —
No personal income docs; deal must DSCR.
Hard money
10% down · 12.0% · 12mo
- Down + closing
- —
- Monthly P&I
- —
- Monthly cashflow
- —
- DSCR
- —
- Eligible?
- —
Short-term bridge; refi at stabilization.
Rent comps 7 comps
| Address | Beds | Baths | Sqft | Rent | $/sqft | DOM | Units | Dist |
|---|---|---|---|---|---|---|---|---|
| 3501 E Ridgely Ave Unit FR21 Springfield, IL | 3.0 | 2.0 | 1216 | $1,129 | $0.93 | 21d | 1 | 0.65mi |
| 2281 E Keys Ave Springfield, IL | 2.0 | 1.0 | 800 | $1,200 | $1.50 | 44d | 1 | 1.07mi |
| 1413 N 5th St Springfield, IL | 3.0 | 1.0 | 1200 | $1,200 | $1.00 | 21d | 1 | 1.10mi |
| 1127 N 6th St Unit 2 Springfield, IL | 1.0 | 1.0 | 900 | $900 | $1.00 | 44d | 1 | 1.26mi |
| 201 Eastman Ave Springfield, IL | 2.0 | 1.0 | 812 | $950 | $1.17 | 44d | 1 | 1.27mi |
| 920 N 19th St Springfield, IL | 3.0 | 1.0 | 1000 | $1,100 | $1.10 | 21d | 1 | 1.28mi |
| 3430 N Peoria Rd Springfield, IL | 3.0 | 2.0 | 1056 | $1,129 | $1.07 | 21d | 1 | 1.38mi |
Listing history 23 events
-
2026-06-08status $42,900 Pending 19 DOM
-
2026-06-07days on market $42,900 Active 19 DOM
-
2026-06-05days on market $42,900 Active 16 DOM
-
2026-06-03days on market $42,900 Active 15 DOM
-
2026-06-02days on market $42,900 Active 14 DOM
-
2026-06-01days on market $42,900 Active 13 DOM
-
2026-05-31days on market $42,900 Active 12 DOM
-
2026-05-30days on market $42,900 Active 11 DOM
-
2026-05-19$42,900 Active 300-char remark
Show marketing remark (300 chars)
Calling those investors who are looking for a project with great potential for your portfolio or a home to fix up yourself at an affordable price. this home is ready for improvements located just blocks away from the state fair grounds. Features an ADA ramp and an unfinished basement. Selling As-Is.
-
2026-05-08historical
-
2026-02-09Active
-
2025-09-12historical
-
2025-09-12status Temporarily No Showings
-
2025-08-16historical
-
2025-06-20Active
-
2025-04-17historical
-
2025-04-12price
-
2025-03-26price
-
2025-03-19price
-
2025-03-15Active
-
2004-07-09soldstatus $44,000
-
2004-07-01soldstatus $44,000
-
2004-04-08$44,000
ⓘ Source: listings_history table (triggers on properties + properties_extension) + one-shot
backfill from property_details.listing_events for pre-trigger history.
Tax reassessment forecast IL · Partial reset (capped growth)
- Current annual tax
- $1,348 · $112/mo
- Projected year-2 tax
- $1,348 · $112/mo
- Expected delta
- $0/yr ($0/mo · 0.0%)
ⓘ Screening estimate from a state-policy table — verify with the county assessor before closing.
Climate risk First Street
- Flood 3/10 Moderate FEMA zone X (unshaded) · 20% chance over 30 yrs
- Wildfire 1/10 Low
- Heat 4/10 Moderate 7 d/yr ≥104°F today · 20 d/yr by 30 yrs out
- Wind 2/10 Low 100% chance of damaging wind over 30 yrs
- Air quality 2/10 Low 1 unhealthy d/yr today · 1 by 30 yrs out
Nearby sold comps map
Loading sold comps map…
Walkable amenities ~0.75 mi
Loading nearby amenities…
Taxation est. · year 1
- Rental income
- $13,304
- − Mortgage interest
- −$2,403
- − Property taxes
- −$1,348
- − Insurance
- −$214
- − Repairs & maintenance
- −$1,064
- − Management
- −$1,064
- − Depreciation
- −$1,248
- Taxable income
- $5,962
- Est. tax owed @ 24.0%
- −$1,431
- After-tax cash flow
- $4,817/yr
For passive investors: Depreciation is non-cash, so a rental often shows a tax loss while cash-flowing — sheltering income. Rental losses are passive: they offset passive income freely, and up to $25,000/yr can offset ordinary (W-2) income if you actively participate and your MAGI is under $100k (phasing out to $0 by $150k); unused losses carry forward. On sale, claimed depreciation is recaptured at up to 25%, and gains may owe capital-gains tax (a 1031 exchange can defer both). Figures are a year-1 estimate at your 24.0% rate — not tax advice; consult a CPA.
Schools (NCES district)
- District
- Springfield SD 186
- NCES district ID
- 1737080
- Math proficiency
- 17% ▼ -7.00%
- Reading proficiency
- 22% ▼ -5.00%
- Median HH income
- $43,744
- Composite
- 16.89/100
- National rank
- #9142
- State rank
- #438 of 620 in IL
Livability — Springfield
- Score
- 79/100
- State rank
- #122
- US rank
- #2138
Category grades
Schools grade is shown separately in the Schools card above.
Census & demographics
- Census place
- Springfield, IL
- County
- Sangamon County · 115,414 people
- City population
- 59,955
- Metro
- Springfield, IL
- Population (ZIP)
- 31,033
- Household income
- $51,136
- Rent vs Own
- Severe rent burden
- 1230.0
Population outlook (Sangamon County) Hauer SSP2
- Today (2025)
- 198,317 people
- By 2030
- 196,127 · -1.1%
- By 2040
- 188,664 · -4.9%
- By 2050
- 179,624 · -9.4%
- By 2075
- 155,027 · -21.8%
- By 2100
- 122,588 · -38.2%
Race, ethnicity, and origin ACS 2023
- Neighborhood character
- Predominantly White (72%)
- Race & ethnicity
- White 72% Black 17% Two or more races 8% Hispanic / Latino 3%
- Common ancestry
- Romanian 2% Slovak 2% Serbian 1%
- Foreign-born
- 2% · Canada
- Languages at home
- 96% English-only · Spanish 1% French/Haitian/Cajun 1% Other Indo-European 1%
Political lean MEDSL · Sangamon
- 2024 margin
- Toss-up / Even · D 46.6% · R 51.6% · Other 1.8%
- 2008→2024 swing
- -9.3pp toward R · 2008: 4.4pp · 2024: -5.0pp
- All cycles
- 2024: R+5.0 2020: R+4.4 2016: R+9.4 2012: R+8.7 2008: D+4.4
Not yet ingested
- Civics
- —
Market trends
- HPI YoY
- ▼ -79.98%
- Current HPI
- 149.1926
- Rent YoY
- ▲ 4.95%
- Metro
- Springfield, IL
- State GDP YoY
- ▲ 1.59%
- F500 in state
- 60
Industry mix (Fortune 500 HQ in IL)
| Industry | F500 HQs | Revenue |
|---|---|---|
| Insurance | 4 | $201B |
|
||
| Consumer Goods | 4 | $87B |
|
||
| Industrial Machinery | 3 | $64B |
|
||
| Healthcare | 2 | $55B |
|
||
| Retail / Pharmacy | 1 | $148B |
|
||
| Agriculture / Food | 1 | $86B |
|
||
Price history
-2.5% since first listed15 events — show timeline
- 2026-05-19 Listed $42,900 RMLSA as Distributed by MLS Grid
- 2026-05-08 Listing Removed — RMLSA as Distributed by MLS Grid
- 2026-02-09 Listed — RMLSA as Distributed by MLS Grid
- 2025-09-12 Listing Removed — MRED as Distributed by MLS Grid
- 2025-09-12 Relisted — MRED as Distributed by MLS Grid
- 2025-08-16 Listing Removed — RMLSA as Distributed by MLS Grid
- 2025-06-20 Listed — RMLSA as Distributed by MLS Grid
- 2025-04-17 Listing Removed — MRED as Distributed by MLS Grid
- 2025-04-12 Price Changed — MRED as Distributed by MLS Grid
- 2025-03-26 Price Changed — MRED as Distributed by MLS Grid
- 2025-03-19 Price Changed — MRED as Distributed by MLS Grid
- 2025-03-15 Listed — MRED as Distributed by MLS Grid
- 2004-07-09 Sold (Public Records) $44,000 Public Records
- 2004-07-01 Sold (MLS) $44,000 RMLSA as Distributed by MLS Grid
- 2004-04-08 Listed $44,000 RMLSA as Distributed by MLS Grid
Property tax history
+3.5%/yrLatest (2024): $1,348 · +7.8% YoY. Source: county tax records.
Cash-flow waterfall
monthlySold comps — $/sqft
last 12 mo · ≤1 miLoading sold comps…