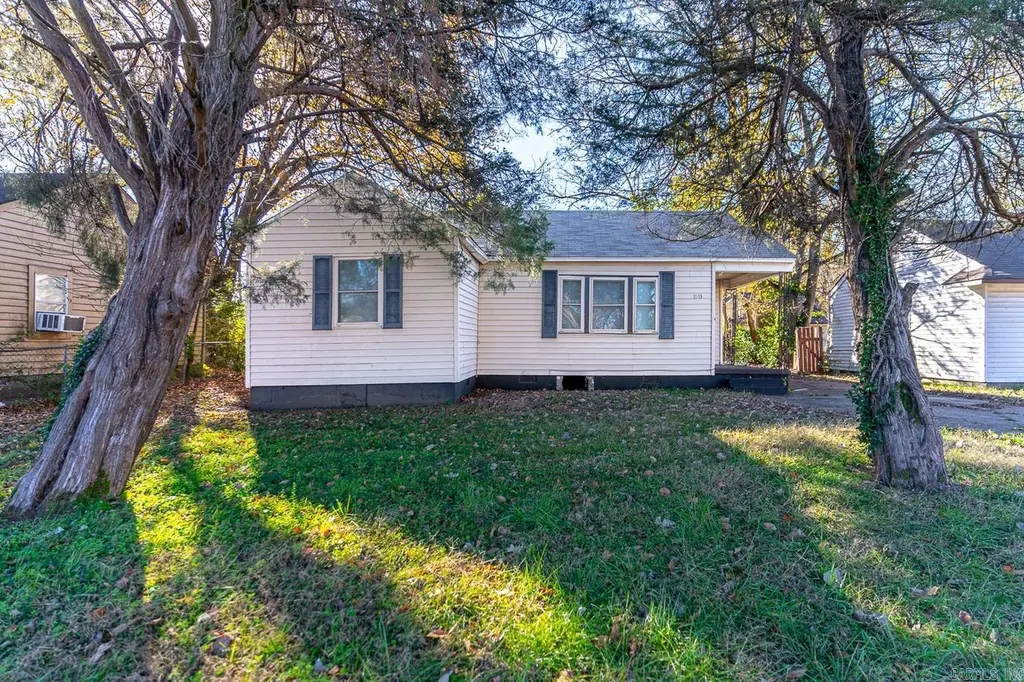
1913 Sula Ln · West Memphis, AR
Flood risk 4/10 · Minor
- FEMA flood zone
- X (shaded)
- Chance of flooding over 30 yrs
- 0.2%
- Est. flood insurance / yr
- $507 – $1,088
Fire risk 1/10 · Minimal
- Est. fire insurance / yr
- $1,499 – $2,785
Heat risk 6/10 · Moderate
- Hot days now (above 109°F)
- 7 days/yr
- Hot days in 30 yrs
- 21 days/yr
Wind risk 4/10 · Minor
- Chance of severe wind over 30 yrs
- 14.0%
Air-quality risk 2/10 · Minimal
- Unhealthy air days now
- 2 days/yr
- Unhealthy air days in 30 yrs
- 2 days/yr
Risk factors via First Street. Map © Google.
Why this score? — see what drove the B grade
The composite is a weighted blend of 9 inputs, each scored 0–100. Each bar is that input's sub-score; the figure is the points it added to the 100-point composite (weight × sub-score).
- Cash flow +30.0/30.0
- ARV discount +15.0/15.0
- 1% rule +10.0/10.0
- DSCR +10.0/10.0
- Livability +2.8/5.0
- Rent growth +2.5/5.0
- Condition / age +2.5/5.0
- Schools +1.2/10.0
- Appreciation +0.0/10.0
$79,900
🖨 Deal sheet 📄 Offer letter ✓ Due diligence
Listing remarks MLS
Welcome to market this charming home located in the Memphis View Subdivision Great investment opportunity cash flowing for $895 monthly. Home has 3 spacious bedrooms, 1 bathroom, and a large backyard. Home features a combination of hard wood and laminate flooring, spacious living room/dining room combo, separate laundry room, large den with a fireplace that can be easily used as an additional bedroom w/ a fire place and ceiling fans. Professionally managed by Crest Core. DO NOT DISTURB TENANTS. Home is apart of a 3 property package deal (1805 Goodwin & 208 s Center)
Key facts
- Large backyard
- Ceiling fans
- Detached
Tags
Neighborhood map
What this means for you Summary
Snapshot
- This is a 3-bed/1.0-bath single-family listed at $80k.
Deal economics
- At list price, monthly cash flow is $464 ($6k/yr) — positive.
- The deal already cash-flows at list — no discount required.
- Meets the 1% rule at list price ($1k rent vs $80k).
- Recommended offer: $73k (9.0% below list) — sets the bar for market timing.
- Cap rate 13.3% vs local median 7.0% in West Memphis — top-decile yield for the area; either an underpriced asset or a hidden risk that comps aren't pricing in. Stress-test before assuming the spread holds.
Location & tenants
- Location reads 55/100 on livability (#413 in AR) — a working-class tenant base; expect higher turnover. Strengths: cost of living A+, housing A; Watch: schools D-, crime F, amenities F.
- West Memphis School District (suburban): math 16% / reading 15% proficiency, ranked #224 of 238 in AR (top 94%) — low school quality limits family demand, transient renter base, plan for 1-2y turnover; 96% free/reduced lunch — lower-income household profile, screen leases tightly.
- Market conditions: 133 active listings in the ZIP; 12 comparable units currently listed for rent nearby; rentals at typical pace (median 16d on market — plan ~3-4 weeks tenant-placement turnaround); 42% of comp listings sitting > 30 days — soft ceiling on asking rent; 69 units permitted in Crittenden County in 2024 (0 in 5+ unit buildings).
Forward outlook
- Local home prices are declining (-3.0%/yr); year-one equity from $552 of loan paydown is wiped out by about $2k of value loss. Plan a longer hold.
- Crittenden County population projected at -26% by 2050 — secular population decline; favor cash flow + early exit over multi-decade hold.
- At projected returns (-3.0% appreciation + 3.0% rent growth), your $22k cash investment doubles in ~5 years — after that, you're playing with house money.
Negotiation context
- It's been on market 94 days — a 9% lower offer ($73k) is reasonable based on typical stale-listing flexibility.
- 6 sale attempts since 7y ago with the ask held roughly flat each time — persistent listings suggest the price (not the market) is what's stuck; bring a comps-based counter.
Risks & watch-outs
- Watch-outs: built in 1952 — expect roof / HVAC / electrical / plumbing capex.
- Climate carrying-cost: extreme-heat days projected 7→21/yr by 2055 (HVAC capex compounding) — expect insurance premiums to compound above CPI over the hold.
Questions for the listing agent
- It's been on market 94 days. Have you received any prior offers? Is the seller open to a 9% concession, seller financing, or rate buy-down credit?
- Built in 1952 — when were the roof, HVAC, electrical panel, plumbing, and water heater last replaced?
- Why hasn't it sold? Are there any deal-killer items the seller is aware of (foundation, flood, title, zoning, code violations)?
- Is there a deadline driving the sale (1031 exchange, divorce, estate, relocation)? That informs how much negotiation room exists.
- Schools are D-rated, which usually means shorter tenancies and higher turnover. Who's the typical renter profile here, and what's been the actual vacancy rate?
- Crime grade is F in this area — have there been break-ins, vandalism, or insurance claims at this property in the last 3 years? What carrier currently insures it and at what premium?
- What's the average days-on-market for RENTAL listings here right now (not sales)? A rising rental-DOM trend means longer vacancies and softer asking-rent achievability than the comps imply.
- What's the recent tenant-quality profile in this submarket — average credit score on applications, eviction rate, late-payment / NSF rate, and stable-employment percentage? A property-management company in the area should have these aggregated.
- How much new for-sale + rental construction is in the pipeline within 1–3 miles? Heavy new supply typically softens prices + rents 12–24 months out; constrained supply supports both.
Investment metrics
- 1% rule
- 1.50% ✓
- Cap rate
- 13.26%
- Cash-on-cash
- 24.90%
- DSCR
- 2.11
- GRM
- 5.6
CMA / ARV
- ARV (median comp)
- $100,083
- List price
- $79,900
- Delta
- -20.17%
- Verdict
- UNDERPRICED
- Comps
- 20 within 1.0 mi
Show comp detail 12 sales within ~0.75 mi
| Address | Dist | Beds/Ba | Sqft | Sold | Price | $/sf | Match |
|---|---|---|---|---|---|---|---|
| 1909 Sula Ln | 0.01mi | 3/1.0 | 1,200 (-2%) | 9mo | $52,000 | $43 | 88 |
| 1823 Goodwin Ave | 0.15mi | 4/2.0 (+1) | 1,187 (-3%) | 4mo | $150,000 | $126 | 75 |
| 703 Mcauley Cir | 0.20mi | 3/2.0 | 1,241 (+1%) | 13mo | $140,000 | $113 | 74 |
| 1603 Scottwood Ave | 0.26mi | 3/1.0 | 1,300 (+6%) | 6mo | $55,000 | $42 | 73 |
| 1121 S Mcauley Dr | 0.57mi | 3/1.0 | 1,210 (-2%) | 4mo | $136,000 | $112 | 68 |
| 1900 N Mcauley Dr | 0.12mi | 3/2.0 | 1,386 (+13%) | 9mo | $48,500 | $35 | 61 |
| 518 N 16th St | 0.33mi | 3/2.0 | 1,092 (-11%) | 4mo | $55,000 | $50 | 58 |
| 521 Johnson St | 0.46mi | 4/1.5 (+1) | 1,160 (-6%) | 10mo | $150,000 | $129 | 54 |
| 2724 Beatty St | 0.65mi | 3/1.0 | 1,277 (+4%) | 11mo | $57,000 | $45 | 54 |
| — | 0.69mi | 3/1.0 | 1,153 (-6%) | 10mo | $8,000 | $7 | 50 |
| 2692 Beatty St | 0.60mi | 3/1.0 | 1,053 (-14%) | 3mo | $137,000 | $130 | 46 |
| 701 Johnson St | 0.59mi | 4/1.5 (+1) | 1,348 (+10%) | 6mo | $169,900 | $126 | 44 |
Match score weights: distance 35% · size 25% · config 20% · recency 20%. Top-matched comps best support the ARV.
Projected returns pro-forma
-3.0% appreciation · 3.0% rent growth · sell at horizon
- IRR
- 18.3%
- Equity multiple
- 1.74×
- Total profit
- $16,591
- Equity at exit
- $11,913
- IRR
- 26.7%
- Equity multiple
- 3.34×
- Total profit
- $52,411
- Equity at exit
- $6,908
Cash invested: $22,372 (down + closing). Projections, not guarantees.
Landlord ↔ Tenant lean methodology
- Overall (STATE)
- 92 Strongly Landlord-Friendly
- State Arkansas
- 92 Strongly Landlord-Friendly · R+14
- County
- — inherits STATE
- City
- — inherits STATE
ZIP-level market 72301
- Active inventory
- 133
- Price-to-rent
- 5.6×
Monthly cashflow live
- Estimated rent
- $1,197 high interval (Pro) →
- Mortgage (P&I)
- −$419
- Tax from tax record
- −$29 /mo · $349/yr
- Insurance
- −$33
- HOA
- −$0
- Vacancy / Maint / Mgmt
- −$251
- Net cashflow
- $464
Break-even live
UW: 25.0% down · 7.5% · 30yr · 1.5% tax · 5.0% vac · 8.0% maint · 8.0% mgmt
Financing live
Cash to close
- Down payment
- $19,975
- Closing costs
- $2,397
- Reserves months
- —
- Total cash needed
- —
Loan-product check · same deal, 3 products live
Conventional
25% down · 7.5% · 30yr
- Down + closing
- —
- Monthly P&I
- —
- Monthly cashflow
- —
- DSCR
- —
- Eligible?
- —
Personal DTI + credit; lowest rate.
DSCR
20% down · 8.5% · 30yr
- Down + closing
- —
- Monthly P&I
- —
- Monthly cashflow
- —
- DSCR
- —
- Eligible?
- —
No personal income docs; deal must DSCR.
Hard money
10% down · 12.0% · 12mo
- Down + closing
- —
- Monthly P&I
- —
- Monthly cashflow
- —
- DSCR
- —
- Eligible?
- —
Short-term bridge; refi at stabilization.
Rent comps 12 comps
| Address | Beds | Baths | Sqft | Rent | $/sqft | DOM | Units | Dist |
|---|---|---|---|---|---|---|---|---|
| 741 N 18th St West Memphis, AR | 2.0 | 1.0 | 814 | $940 | $1.15 | 4d | 1 | 0.14mi |
| 2400 Goodwin Ave West Memphis, AR | 2.0 | 1.5 | 1100 | $775 | $0.70 | 44d | 1 | 0.33mi |
| 2401 Wheeler Ave West Memphis, AR | 2.0 | 1.0 | 1000 | $750 | $0.75 | 44d | 1 | 0.33mi |
| 1398 E Barton Ave West Memphis, AR | 3.0 | 2.0 | 1250 | $1,550 | $1.24 | 10d | 1 | 0.38mi |
| 2504 Tyler Cir West Memphis, AR | 3.0 | 2.0 | 1250 | $1,450 | $1.16 | 1d | 1 | 0.78mi |
| 2502 E Tyler Ave West Memphis, AR | 3.0 | 2.0 | 1250 | $1,550 | $1.24 | 44d | 1 | 0.83mi |
| 2506 E Tyler Ave West Memphis, AR | 3.0 | 2.0 | 1250 | $1,450 | $1.16 | 16d | 1 | 0.84mi |
| 2501 E Tyler Ave West Memphis, AR | 3.0 | 2.0 | 1220 | $1,500 | $1.23 | 44d | 1 | 0.86mi |
| 307 Westree St West Memphis, AR | 3.0 | 2.0 | 1220 | $1,550 | $1.27 | 10d | 1 | 0.87mi |
| 309 Westree St West Memphis, AR | 3.0 | 2.0 | 1220 | $1,550 | $1.27 | 1d | 1 | 0.88mi |
| 310 Chestnut St West Memphis, AR | 3.0 | 2.0 | 1250 | $1,350 | $1.08 | 1d | 1 | 0.95mi |
| 316 Chestnut St West Memphis, AR | 3.0 | 2.0 | 1250 | $1,450 | $1.16 | 44d | 1 | 0.97mi |
Listing history 30 events
-
2026-06-18days on market $79,900 Active 94 DOM
-
2026-06-17days on market $79,900 Active 93 DOM
-
2026-06-16days on market $79,900 Active 92 DOM
-
2026-06-15days on market $79,900 Active 91 DOM
-
2026-06-13days on market $79,900 Active 89 DOM
-
2026-06-10days on market $79,900 Active 86 DOM
-
2026-06-09days on market $79,900 Active 85 DOM
-
2026-06-08days on market $79,900 Active 84 DOM
-
2026-06-07days on market $79,900 Active 83 DOM
-
2026-06-03days on market $79,900 Active 79 DOM
-
2026-06-02days on market $79,900 Active 78 DOM
-
2026-06-01days on market $79,900 Active 77 DOM
-
2026-05-31days on market $79,900 Active 76 DOM
-
2026-03-16$79,900 New Listing 579-char remark
Show marketing remark (579 chars)
Welcome to market this charming home located in the Memphis View Subdivision Great investment opportunity cash flowing for $895 monthly. Home has 3 spacious bedrooms, 1 bathroom, and a large backyard. Home features a combination of hard wood and laminate flooring, spacious living room/dining room combo, separate laundry room, large den with a fireplace that can be easily used as an additional bedroom w/ a fire place and ceiling fans. Professionally managed by Crest Core. DO NOT DISTURB TENANTS. Home is apart of a 3 property package deal (1805 Goodwin & 208 s Center)
-
2025-10-01historical
-
2025-04-17price $85,900
-
2025-02-03$89,900 Active
-
2025-02-02$89,900 New Listing
-
2024-12-13historical $895
-
2024-12-05$895
-
2024-10-22price $79,000
-
2024-08-30price $99,000
-
2024-08-05price $89,900
-
2024-07-19price $99,000
-
2024-06-19$109,900 Active
-
2019-08-01$54,000
-
2016-05-19soldstatus $82,000
-
2013-09-26soldstatus $34,000
-
2008-05-05soldstatus $40,000
-
1996-09-05soldstatus $20,000
ⓘ Source: listings_history table (triggers on properties + properties_extension) + one-shot
backfill from property_details.listing_events for pre-trigger history.
Tax reassessment forecast AR · Resets to sale price
- Current annual tax
- $349 · $29/mo
- Projected year-2 tax
- $511 · $43/mo
- Expected delta
- +$162/yr (+$14/mo · 46.4%)
ⓘ Screening estimate from a state-policy table — verify with the county assessor before closing.
Climate risk First Street
- Flood 4/10 Moderate FEMA zone X (shaded) · 20% chance over 30 yrs
- Wildfire 1/10 Low
- Heat 6/10 Major 7 d/yr ≥109°F today · 21 d/yr by 30 yrs out
- Wind 4/10 Moderate 14% chance of damaging wind over 30 yrs
- Air quality 2/10 Low 2 unhealthy d/yr today · 2 by 30 yrs out
Nearby sold comps map
Loading sold comps map…
Walkable amenities ~0.75 mi
Loading nearby amenities…
Taxation est. · year 1
- Rental income
- $14,363
- − Mortgage interest
- −$4,476
- − Property taxes
- −$349
- − Insurance
- −$400
- − Repairs & maintenance
- −$1,149
- − Management
- −$1,149
- − Depreciation
- −$2,324
- Taxable income
- $4,516
- Est. tax owed @ 24.0%
- −$1,084
- After-tax cash flow
- $4,486/yr
For passive investors: Depreciation is non-cash, so a rental often shows a tax loss while cash-flowing — sheltering income. Rental losses are passive: they offset passive income freely, and up to $25,000/yr can offset ordinary (W-2) income if you actively participate and your MAGI is under $100k (phasing out to $0 by $150k); unused losses carry forward. On sale, claimed depreciation is recaptured at up to 25%, and gains may owe capital-gains tax (a 1031 exchange can defer both). Figures are a year-1 estimate at your 24.0% rate — not tax advice; consult a CPA.
Schools (NCES district)
- District
- West Memphis School District
- NCES district ID
- 0508040
- Math proficiency
- 16% ▼ -14.00%
- Reading proficiency
- 15% ▼ -14.00%
- Median HH income
- $29,382
- Composite
- 12.22/100
- National rank
- #9647
- State rank
- #224 of 238 in AR
Livability — West Memphis
- Score
- 55/100
- State rank
- #413
- US rank
- #23638
Category grades
Schools grade is shown separately in the Schools card above.
Census & demographics
- Census place
- West Memphis, AR
- City population
- 24,182
- Population (ZIP)
- 24,182
Population outlook (Crittenden County) Hauer SSP2
- Today (2025)
- 45,254 people
- By 2030
- 42,953 · -5.1%
- By 2040
- 38,235 · -15.5%
- By 2050
- 33,670 · -25.6%
- By 2075
- 24,315 · -46.3%
- By 2100
- 17,173 · -62.1%
Race, ethnicity, and origin ACS 2023
- Neighborhood character
- Majority Black (64%)
- Race & ethnicity
- Black 64% White 29% Two or more races 6% Hispanic / Latino 2%
- Common ancestry
- Serbian 1%
- Foreign-born
- 1% · Canada
- Languages at home
- 98% English-only · Spanish 1%
Political lean MEDSL · Crittenden
- 2024 margin
- Toss-up / Even · D 50.1% · R 47.9% · Other 2.0%
- 2008→2024 swing
- -12.4pp toward R · 2008: 14.7pp · 2024: 2.3pp
- All cycles
- 2024: D+2.3 2020: D+7.2 2016: D+9.0 2012: D+18.7 2008: D+14.7
Not yet ingested
- Civics
- —
Market trends
- HPI YoY
- ▼ -143.63%
- Current HPI
- 182.7665
- Rent YoY
- —
- Metro
- —
- State GDP YoY
- ▲ 3.80%
- F500 in state
- 10
Industry mix (Fortune 500 HQ in AR)
| Industry | F500 HQs | Revenue |
|---|---|---|
| Retail | 1 | $681B |
|
||
| Food / Agriculture | 1 | $53B |
|
||
| Retail / Energy | 1 | $22B |
|
||
| Transportation / Logistics | 1 | $12B |
|
||
| Energy | 1 | $4B |
|
||
Price history
+299.5% since first listed17 events — show timeline
- 2026-03-16 Listed $79,900 CARMLS
- 2025-10-01 Listing Removed — CARMLS
- 2025-04-17 Price Changed $85,900 CARMLS
- 2025-02-03 Listed $89,900 NEABOR MLS
- 2025-02-02 Listed $89,900 CARMLS
- 2024-12-13 Rental Removed $895 MMLS
- 2024-12-05 Listed for Rent $895 MMLS
- 2024-10-22 Price Changed $79,000 EARA
- 2024-08-30 Price Changed $99,000 EARA
- 2024-08-05 Price Changed $89,900 EARA
- 2024-07-19 Price Changed $99,000 EARA
- 2024-06-19 Listed $109,900 EARA
- 2019-08-01 Listed $54,000 NEABOR MLS
- 2016-05-19 Sold (Public Records) $82,000 Public Records
- 2013-09-26 Sold (Public Records) $34,000 Public Records
- 2008-05-05 Sold (Public Records) $40,000 Public Records
- 1996-09-05 Sold (Public Records) $20,000 Public Records
Property tax history
+14.2%/yrLatest (2025): $349 · +9.8% YoY. Source: county tax records.
Cash-flow waterfall
monthlySold comps — $/sqft
last 12 mo · ≤1 miLoading sold comps…