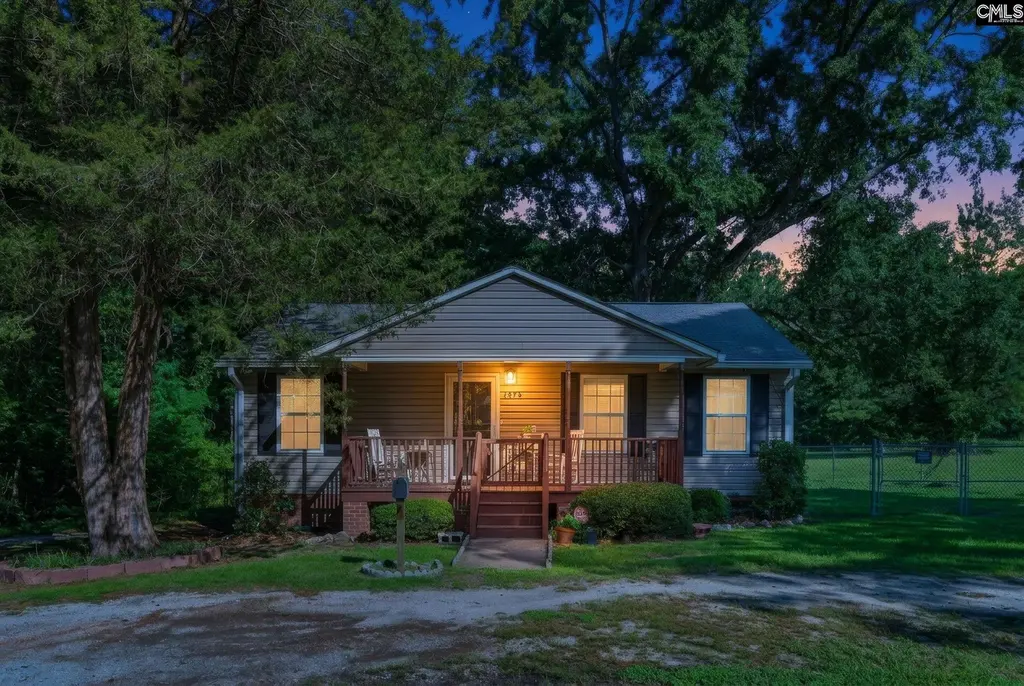
1375 Langford Rd · Elgin, SC
Flood risk 1/10 · Minimal
- FEMA flood zone
- —
- Chance of flooding over 30 yrs
- 0.0%
- Est. flood insurance / yr
- $435 – $905
Fire risk 2/10 · Minimal
- Est. fire insurance / yr
- $783 – $1,453
Heat risk 6/10 · Moderate
- Hot days now (above threshold)
- 7 days/yr
- Hot days in 30 yrs
- 16 days/yr
Wind risk No data
- Chance of severe wind over 30 yrs
- —
Air-quality risk No data
- Unhealthy air days now
- —
- Unhealthy air days in 30 yrs
- —
Risk factors via First Street. Map © Google.
Why this score? — see what drove the C- grade
The composite is a weighted blend of 9 inputs, each scored 0–100. Each bar is that input's sub-score; the figure is the points it added to the 100-point composite (weight × sub-score).
- Cash flow +21.6/30.0
- ARV discount +7.5/15.0
- DSCR +6.9/10.0
- 1% rule +4.5/10.0
- Schools +3.6/10.0
- Livability +2.8/5.0
- Rent growth +2.5/5.0
- Condition / age +2.5/5.0
- Appreciation +0.0/10.0
$180,000
🖨 Deal sheet 📄 Offer letter ✓ Due diligence
Listing remarks
MOVE-IN READY!! Country charm meets modern convenience at 1375 Langford Road! Set on more than an acre of land, this adorable 2-bedroom, 1-bath home was completely redone in 2021 and is ready for its next owner. From the updated interior to the spacious fenced backyard, every detail has been designed for comfortable, low-maintenance living. Enjoy the privacy and flexibility of a large lot while still being just minutes from all that Blythewood has to give. Move-in ready and full of charm, this is the perfect place to call home! Disclaimer: CMLS has not reviewed and, therefore, does not endorse vendors who may appear in listings.
Key facts
- Large lot
- Updated interior
- Move in ready
Tags
Property features AI
Exterior
- Parking: 4 parking spaces
- Utilities: Well water; Septic sewer
- Home design: Single-story home
- Construction: Crawlspace foundation
- Exterior features: Vinyl exterior finish; Chain-link fence at rear only; Paved road access
Interior
- Kitchen: Formica countertops; Painted cabinets; Vinyl floor; Free-standing self-cleaning smooth-surface range; Refrigerator
- Bedrooms: Master bedroom on the main level with private closet and shared-bath setup; Second bedroom on the main level with private closet and shared-bath setup
- Flooring: Luxury vinyl plank in main living areas and bedrooms; Vinyl flooring in the kitchen
- Bathrooms: One full bathroom
- Heating & cooling: Central heating; Central cooling
- Interior features: Ceiling fans in living room and bedrooms; Luxury vinyl plank flooring in living room and bedrooms; Formica countertops; Painted kitchen cabinets; Vinyl kitchen flooring; Heated laundry space located in the kitchen; Free-standing, self-cleaning, smooth-surface range; Refrigerator, washer, and dryer included; Central heating and central cooling
- Laundry & utility: Washer and dryer included; Laundry in heated space in the kitchen (main level)
Neighborhood map
What this means for you Summary
Snapshot
- This is a 2-bed/1.0-bath single-family listed at $180k.
Deal economics
- At list price, monthly cash flow is $274 ($3k/yr) — positive.
- The deal already cash-flows at list — no discount required.
- To meet the 1% rule (rent ≥ 1% of price), the offer needs to be $172k (4.5% below list).
- Recommended offer: $172k (4.5% below list) — sets the bar for 1% rule.
- Cap rate 8.1% vs local median 4.2% in Elgin — top-decile yield for the area; either an underpriced asset or a hidden risk that comps aren't pricing in. Stress-test before assuming the spread holds.
Location & tenants
- Location reads 55/100 on livability (#302 in SC) — a working-class tenant base; expect higher turnover. Strengths: cost of living A+, housing A+; Watch: crime F, amenities F, commute F.
- Richland 02 (suburban): math 35% / reading 47% proficiency, ranked #29 of 80 in SC (top 36%) — families likely to look elsewhere, expect single-tenant / working-renter base with shorter leases.
- Zoned schools: Langford Elementary (math 39% / reading 43%, grade F, #276 of 597 statewide, top 48%, 609 students, 64% FRL); Blythewood High (math 72% / reading 92%, grade A, #19 of 196 statewide, top 10%, 2,094 students, 39% FRL).
- Zoned-school proficiency averages 62% at this address vs 41% district-wide (+20 pts) — the actual schools serving this property are materially stronger than the Richland 02 average implies; a family-tenant draw the district grade alone would hide.
- Market conditions: 650 active listings in the ZIP; solid renter incomes; 3,472 units permitted in Richland County in 2024 (1,096 in 5+ unit buildings).
Forward outlook
- Local home prices are declining (-3.0%/yr); year-one equity from $1k of loan paydown is wiped out by about $5k of value loss. Plan a longer hold.
- Richland County population projected at +30% by 2050 — long-run rental-demand tailwind backs the buy-and-hold thesis.
Negotiation context
- Only 10 days on market — expect competitive offers; lowballing is unlikely to land.
Risks & watch-outs
- Climate carrying-cost: extreme-heat days projected 7→16/yr by 2055 (HVAC capex compounding) — expect insurance premiums to compound above CPI over the hold.
Questions for the listing agent
- Is there a deadline driving the sale (1031 exchange, divorce, estate, relocation)? That informs how much negotiation room exists.
- Schools are D-rated, which usually means shorter tenancies and higher turnover. Who's the typical renter profile here, and what's been the actual vacancy rate?
- Crime grade is F in this area — have there been break-ins, vandalism, or insurance claims at this property in the last 3 years? What carrier currently insures it and at what premium?
- What's the average days-on-market for RENTAL listings here right now (not sales)? A rising rental-DOM trend means longer vacancies and softer asking-rent achievability than the comps imply.
- What's the recent tenant-quality profile in this submarket — average credit score on applications, eviction rate, late-payment / NSF rate, and stable-employment percentage? A property-management company in the area should have these aggregated.
- How much new for-sale + rental construction is in the pipeline within 1–3 miles? Heavy new supply typically softens prices + rents 12–24 months out; constrained supply supports both.
Investment metrics
- 1% rule
- 0.95% ✗
- Cap rate
- 8.12%
- Cash-on-cash
- 6.52%
- DSCR
- 1.29
- GRM
- 8.7
CMA / ARV
No comps found within radius.
Projected returns pro-forma
-3.0% appreciation · 3.0% rent growth · sell at horizon
- IRR
- -6.3%
- Equity multiple
- 0.77×
- Total profit
- $-11,793
- Equity at exit
- $26,839
- IRR
- 3.3%
- Equity multiple
- 1.24×
- Total profit
- $11,902
- Equity at exit
- $15,563
Cash invested: $50,400 (down + closing). Projections, not guarantees.
Landlord ↔ Tenant lean methodology
- Overall (STATE)
- 90 Strongly Landlord-Friendly
- State South Carolina
- 90 Strongly Landlord-Friendly · R+6
- County
- — inherits STATE
- City
- — inherits STATE
ZIP-level market 29016
- Home prices YoY
- -26.3%
- Active inventory
- 650
- Price-to-rent
- 8.7×
Monthly cashflow live
- Estimated rent
- $1,719 medium interval (Pro) →
- Mortgage (P&I)
- −$944
- Tax from tax record
- −$65 /mo · $778/yr
- Insurance
- −$75
- HOA
- −$0
- Vacancy / Maint / Mgmt
- −$361
- Net cashflow
- $274
Break-even live
UW: 25.0% down · 7.5% · 30yr · 1.5% tax · 5.0% vac · 8.0% maint · 8.0% mgmt
Financing live
Cash to close
- Down payment
- $45,000
- Closing costs
- $5,400
- Reserves months
- —
- Total cash needed
- —
Loan-product check · same deal, 3 products live
Conventional
25% down · 7.5% · 30yr
- Down + closing
- —
- Monthly P&I
- —
- Monthly cashflow
- —
- DSCR
- —
- Eligible?
- —
Personal DTI + credit; lowest rate.
DSCR
20% down · 8.5% · 30yr
- Down + closing
- —
- Monthly P&I
- —
- Monthly cashflow
- —
- DSCR
- —
- Eligible?
- —
No personal income docs; deal must DSCR.
Hard money
10% down · 12.0% · 12mo
- Down + closing
- —
- Monthly P&I
- —
- Monthly cashflow
- —
- DSCR
- —
- Eligible?
- —
Short-term bridge; refi at stabilization.
Listing history 9 events
-
2026-06-18days on market $180,000 Active 10 DOM
-
2026-06-17pricedays on market $180,000 Active 9 DOM
-
2026-06-16days on market $190,000 Active 8 DOM
-
2026-06-15days on market $190,000 Active 7 DOM
-
2026-06-14days on market $190,000 Active 5 DOM
-
2026-06-13days on market $190,000 Active 4 DOM
-
2026-06-10days on market $190,000 Active 2 DOM
-
2026-06-09remarks 637-char remark
-
2026-06-09$190,000 Active 1 DOM
ⓘ Source: listings_history table (triggers on properties + properties_extension) + one-shot
backfill from property_details.listing_events for pre-trigger history.
Tax reassessment forecast SC · Resets to sale price
- Current annual tax
- $778 · $65/mo
- Projected year-2 tax
- $1,026 · $86/mo
- Expected delta
- +$248/yr (+$21/mo · 31.9%)
ⓘ Screening estimate from a state-policy table — verify with the county assessor before closing.
Climate risk First Street
- Flood 1/10 Low 0% chance over 30 yrs
- Wildfire 2/10 Low
- Heat 6/10 Major
Nearby sold comps map
Loading sold comps map…
Walkable amenities ~0.75 mi
Loading nearby amenities…
Taxation est. · year 1
- Rental income
- $20,623
- − Mortgage interest
- −$10,083
- − Property taxes
- −$778
- − Insurance
- −$900
- − Repairs & maintenance
- −$1,650
- − Management
- −$1,650
- − Depreciation
- −$5,236
- Taxable income
- $327
- Est. tax owed @ 24.0%
- −$78
- After-tax cash flow
- $3,209/yr
For passive investors: Depreciation is non-cash, so a rental often shows a tax loss while cash-flowing — sheltering income. Rental losses are passive: they offset passive income freely, and up to $25,000/yr can offset ordinary (W-2) income if you actively participate and your MAGI is under $100k (phasing out to $0 by $150k); unused losses carry forward. On sale, claimed depreciation is recaptured at up to 25%, and gains may owe capital-gains tax (a 1031 exchange can defer both). Figures are a year-1 estimate at your 24.0% rate — not tax advice; consult a CPA.
Schools (NCES district)
- District
- Richland 02
- NCES district ID
- 4503390
- Math proficiency
- 35% ▼ -15.00%
- Reading proficiency
- 47% ▼ -5.00%
- Median HH income
- $59,684
- Composite
- 36.2/100
- National rank
- #4730
- State rank
- #29 of 80 in SC
Livability — Elgin
- Score
- 55/100
- State rank
- #302
- US rank
- #23258
Category grades
Schools grade is shown separately in the Schools card above.
Census & demographics
- County
- Richland County · 389,530 people
- City population
- 31,372
- Metro
- Columbia, SC
- Population (ZIP)
- 30,454
- Household income
- $95,082
- Rent vs Own
- Severe rent burden
- 559.0
Population outlook (Richland County) Hauer SSP2
- Today (2025)
- 459,667 people
- By 2030
- 487,524 · +6.1%
- By 2040
- 542,035 · +17.9%
- By 2050
- 595,371 · +29.5%
- By 2075
- 732,998 · +59.5%
- By 2100
- 820,415 · +78.5%
Race, ethnicity, and origin ACS 2023
- Neighborhood character
- Diverse neighborhood (Simpson 0.64)
- Race & ethnicity
- Black 43% White 42% Two or more races 7% Hispanic / Latino 7% Asian 3%
- Hispanic origin (detail)
- Mexican 1% Puerto Rican 2%
- Common ancestry
- Lithuanian 2% Romanian 2% Slovak 2%
- Foreign-born
- 5% · Canada, China
- Languages at home
- 90% English-only · Spanish 5% Other Indo-European 1% German/W. Germanic 1%
Political lean MEDSL · Richland
- 2024 margin
- Solid D (+34.6) · D 66.4% · R 31.8% · Other 1.8%
- 2008→2024 swing
- +5.7pp toward D · 2008: 28.9pp · 2024: 34.6pp
- All cycles
- 2024: D+34.6 2020: D+38.3 2016: D+32.9 2012: D+33.3 2008: D+28.9
Not yet ingested
- Civics
- —
Market trends
- HPI YoY
- ▼ -65.48%
- Current HPI
- 183.5933
- Rent YoY
- —
- Metro
- Columbia, SC
- State GDP YoY
- ▲ 4.51%
- F500 in state
- 2
Industry mix (Fortune 500 HQ in SC)
| Industry | F500 HQs | Revenue |
|---|---|---|
| Packaging | 1 | $7B |
|
||
Price history
1 event — show timeline
- 2026-06-08 Listed $190,000 Consolidated MLS
Property tax history
+2.8%/yrLatest (2025): $778 · +3.6% YoY. Source: county tax records.
Cash-flow waterfall
monthlySold comps — $/sqft
last 12 mo · ≤1 miLoading sold comps…