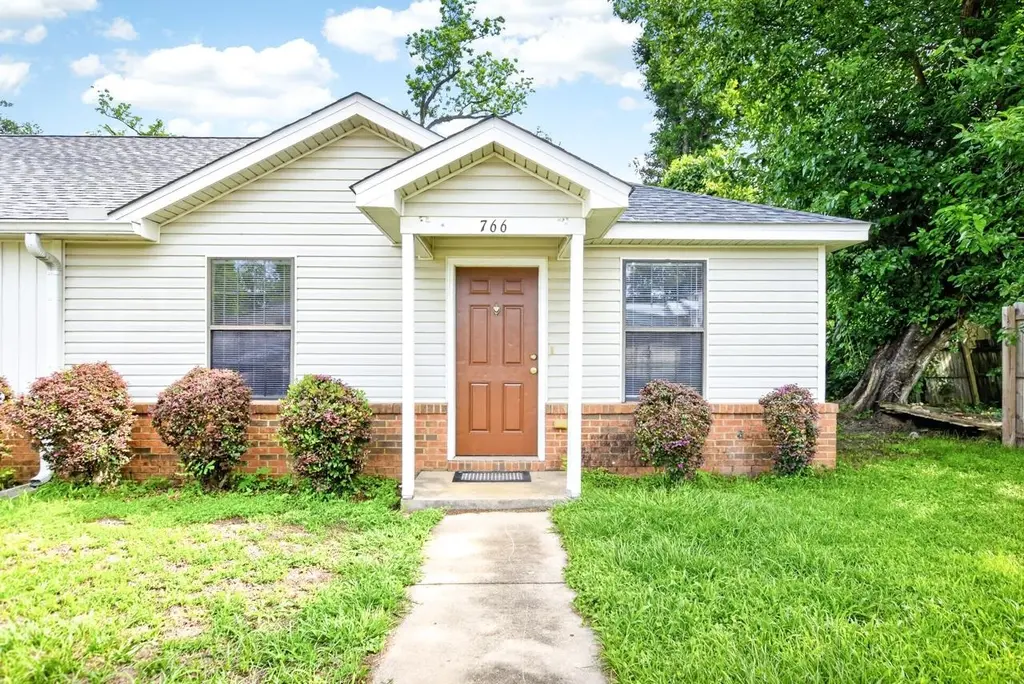
766 Wailes St · Tallahassee, FL
Flood risk 1/10 · Minimal
- FEMA flood zone
- X (unshaded)
- Chance of flooding over 30 yrs
- 0.0%
- Est. flood insurance / yr
- $507 – $1,088
Fire risk 1/10 · Minimal
- Est. fire insurance / yr
- $947 – $1,759
Heat risk 8/10 · Major
- Hot days now (above 108°F)
- 7 days/yr
- Hot days in 30 yrs
- 20 days/yr
Wind risk 9/10 · Severe
- Chance of severe wind over 30 yrs
- 99.0%
Air-quality risk 4/10 · Minor
- Unhealthy air days now
- 5 days/yr
- Unhealthy air days in 30 yrs
- 6 days/yr
Risk factors via First Street. Map © Google.
Why this score? — see what drove the C+ grade
The composite is a weighted blend of 9 inputs, each scored 0–100. Each bar is that input's sub-score; the figure is the points it added to the 100-point composite (weight × sub-score).
- Cash flow +17.8/30.0
- ARV discount +15.0/15.0
- DSCR +5.6/10.0
- Appreciation +4.7/10.0
- Schools +4.3/10.0
- Livability +4.3/5.0
- 1% rule +4.2/10.0
- Rent growth +2.5/5.0
- Condition / age +2.5/5.0
$150,000
🖨 Deal sheet 📄 Offer letter ✓ Due diligence
Listing remarks MLS
great townhome for firstimers, students or investors.
Key facts
- Move-in ready
- Separate kitchen
- Townhome
Tags
Property features AI
Finance
- Financial info: Offered for sale
Exterior
- Parking: Driveway
- Utilities: Public sewer
- Home design: Single-story
- Exterior features: Deck; Public-maintained paved road access
Interior
- Kitchen: Oven; Range; Dishwasher
- Bathrooms: 2 full bathrooms; 1 half bathroom
- Interior features: End unit (common wall)
- Laundry & utility: Washer; Dryer
Neighborhood map
What this means for you Summary
Snapshot
- This is a 2-bed/1.0-bath townhouse listed at $150k.
Deal economics
- At list price, monthly cash flow is $125 ($1k/yr) — positive.
- The deal already cash-flows at list — no discount required.
- To meet the 1% rule (rent ≥ 1% of price), the offer needs to be $138k (7.9% below list).
- Recommended offer: $138k (7.9% below list) — sets the bar for 1% rule.
- Cap rate 7.3% vs local median 4.2% in Tallahassee — top-decile yield for the area; either an underpriced asset or a hidden risk that comps aren't pricing in. Stress-test before assuming the spread holds.
Location & tenants
- Location reads 86/100 on livability (#19 in FL, #429 nationally) — a professional / high-income tenant draw. Strengths: amenities A+, commute A+, health & safety A+; Watch: employment D.
- Leon (urban): math 48% / reading 53% proficiency, ranked #33 of 73 in FL (top 45%) — acceptable for families but not a draw, mixed tenant base, ~2y average lease.
- Market conditions: 94 active listings in the ZIP; 40 comparable units currently listed for rent nearby; rentals at typical pace (median 22d on market — plan ~3-4 weeks tenant-placement turnaround); lower-income renter base — watch delinquency; 1,765 units permitted in Leon County in 2024 (975 in 5+ unit buildings).
- This rent runs 43% of the median local income ($38k/yr) — at the standard rent-burdened threshold; future hikes will face affordability resistance.
Forward outlook
- In year one you build about $225 of equity ($1k loan paydown + $-812 appreciation (-0.5% local appreciation)).
- Leon County population projected at +23% by 2050 — long-run rental-demand tailwind backs the buy-and-hold thesis.
Negotiation context
- Only 11 days on market — expect competitive offers; lowballing is unlikely to land.
- 5 sale attempts since 20y ago with the ask held roughly flat each time — persistent listings suggest the price (not the market) is what's stuck; bring a comps-based counter.
- Current owner paid $40k; list at $150k implies a 275% gain — meaningful room to come down on a strong offer.
Risks & watch-outs
- Climate carrying-cost: severe wind risk, 99% chance of damaging wind over 30y; extreme-heat days projected 7→20/yr by 2055 (HVAC capex compounding) — expect insurance premiums to compound above CPI over the hold.
Questions for the listing agent
- Is there a deadline driving the sale (1031 exchange, divorce, estate, relocation)? That informs how much negotiation room exists.
- Schools are B-rated — typically a magnet for longer-tenancy family renters. What's the average tenant stay here, and is there a school-zone premium baked into asking?
- What's the average days-on-market for RENTAL listings here right now (not sales)? A rising rental-DOM trend means longer vacancies and softer asking-rent achievability than the comps imply.
- What's the recent tenant-quality profile in this submarket — average credit score on applications, eviction rate, late-payment / NSF rate, and stable-employment percentage? A property-management company in the area should have these aggregated.
- How much new for-sale + rental construction is in the pipeline within 1–3 miles? Heavy new supply typically softens prices + rents 12–24 months out; constrained supply supports both.
Investment metrics
- 1% rule
- 0.92% ✗
- Cap rate
- 7.29%
- Cash-on-cash
- 3.56%
- DSCR
- 1.16
- GRM
- 9.0
CMA / ARV
- ARV (on-the-fly)
- $183,768
- Comps found
- 12
Show comp detail 12 sales within ~0.75 mi
| Address | Dist | Beds/Ba | Sqft | Sold | Price | $/sf | Match |
|---|---|---|---|---|---|---|---|
| 1319 Airport Dr Unit F02 | 0.49mi | 2/2.5 | 1,035 (+5%) | 3mo | $185,000 | $179 | 61 |
| 815 W Pensacola St #14 | 0.58mi | 2/2.5 | 959 (-3%) | 1mo | $295,000 | $308 | 61 |
| 1302 Warrior Way | 0.63mi | 3/2.0 (+1) | 1,012 (+2%) | 1mo | $280,000 | $277 | 57 |
| 1323 Airport Dr Unit E09 | 0.53mi | 2/2.5 | 1,083 (+10%) | 3mo | $201,000 | $186 | 51 |
| 1337 Airport Dr Unit G5 | 0.47mi | 2/2.5 | 1,110 (+12%) | 2mo | $187,700 | $169 | 50 |
| 1305 Airport Dr Unit A03 | 0.53mi | 2/2.5 | 1,083 (+10%) | 4mo | $195,000 | $180 | 49 |
| 426 Indian Village Trl | 0.63mi | 3/2.0 (+1) | 1,052 (+6%) | 4mo | $235,322 | $224 | 47 |
| 1319 Airport Dr Unit F04 | 0.49mi | 2/2.5 | 1,083 (+10%) | 11mo | $192,000 | $177 | 46 |
| 1317 Airport Dr | 0.50mi | 2/2.5 | 1,083 (+10%) | 11mo | $185,000 | $171 | 46 |
| 415 Saint Francis St #137 | 0.66mi | 1/1.0 (-1) | 900 (-9%) | 10mo | $250,000 | $278 | 41 |
| 1355 Warrior Way #67 | 0.66mi | 3/2.0 (+1) | 1,052 (+6%) | 11mo | $185,000 | $176 | 40 |
| 415 Saint Francis St #133 | 0.66mi | 1/1.0 (-1) | 900 (-9%) | 12mo | $260,000 | $289 | 39 |
Match score weights: distance 35% · size 25% · config 20% · recency 20%. Top-matched comps best support the ARV.
Projected returns pro-forma
-0.54% appreciation · 3.0% rent growth · sell at horizon
- IRR
- -0.1%
- Equity multiple
- 0.99×
- Total profit
- $-241
- Equity at exit
- $39,540
- IRR
- 6.0%
- Equity multiple
- 1.61×
- Total profit
- $25,447
- Equity at exit
- $44,433
Cash invested: $42,000 (down + closing). Projections, not guarantees.
Landlord ↔ Tenant lean methodology
- Overall (STATE)
- 87 Strongly Landlord-Friendly
- State Florida
- 87 Strongly Landlord-Friendly · R+3
- County
- — inherits STATE
- City
- — inherits STATE
ZIP-level market 32310
- Home prices YoY
- -0.2%
- Active inventory
- 94
- Price-to-rent
- 9.0×
Monthly cashflow live
- Estimated rent
- $1,382 high interval (Pro) →
- Mortgage (P&I)
- −$787
- Tax from tax record
- −$118 /mo · $1,411/yr
- Insurance
- −$62
- HOA
- −$0
- Vacancy / Maint / Mgmt
- −$290
- Net cashflow
- $125
Break-even live
UW: 25.0% down · 7.5% · 30yr · 1.5% tax · 5.0% vac · 8.0% maint · 8.0% mgmt
Financing live
Cash to close
- Down payment
- $37,500
- Closing costs
- $4,500
- Reserves months
- —
- Total cash needed
- —
Loan-product check · same deal, 3 products live
Conventional
25% down · 7.5% · 30yr
- Down + closing
- —
- Monthly P&I
- —
- Monthly cashflow
- —
- DSCR
- —
- Eligible?
- —
Personal DTI + credit; lowest rate.
DSCR
20% down · 8.5% · 30yr
- Down + closing
- —
- Monthly P&I
- —
- Monthly cashflow
- —
- DSCR
- —
- Eligible?
- —
No personal income docs; deal must DSCR.
Hard money
10% down · 12.0% · 12mo
- Down + closing
- —
- Monthly P&I
- —
- Monthly cashflow
- —
- DSCR
- —
- Eligible?
- —
Short-term bridge; refi at stabilization.
Rent comps 40 comps
| Address | Beds | Baths | Sqft | Rent | $/sqft | DOM | Units | Dist |
|---|---|---|---|---|---|---|---|---|
| 833 W Gaines St Tallahassee, FL | 2.0 | 2.0 | 1080 | $2,350 | $2.18 | 14d | 2 | 0.38mi |
| 510 All Saints St Unit 101 Tallahassee, FL | 1.0 | 1.0 | 720 | $1,900 | $2.64 | 14d | 1 | 0.50mi |
| 510 All Saints St Unit 203 Tallahassee, FL | 1.0 | 1.0 | 720 | $1,600 | $2.22 | 14d | 1 | 0.50mi |
| 643 Kissimmee St Tallahassee, FL | 2.0 | 1.0 | 800 | $1,595 | $1.99 | 21d | 1 | 0.55mi |
| 1303 Airport Dr Unit A08 Tallahassee, FL | 2.0 | 2.5 | 1083 | $1,475 | $1.36 | 21d | 1 | 0.58mi |
| 1313 Airport Dr Unit DRE6 Tallahassee, FL | 1.0 | 1.5 | 1100 | $1,300 | $1.18 | 14d | 1 | 0.61mi |
| 1426 Pepper Dr Tallahassee, FL | 2.0 | 1.0 | 858 | $1,250 | $1.46 | 21d | 1 | 0.61mi |
| 635 Palm Beach St Apt 125 Tallahassee, FL | 2.0 | 2.0 | 900 | $900 | $1.00 | 21d | 1 | 0.66mi |
| 318 W Harrison St Unit 324 Tallahassee, FL | 2.0 | 1.0 | 525 | $1,000 | $1.90 | 21d | 1 | 0.66mi |
| 1632 Highland St Apt 9 Tallahassee, FL | 1.0 | 1.0 | 600 | $825 | $1.38 | 14d | 1 | 0.68mi |
| 1606 Airport Dr Tallahassee, FL | 3.0 | 2.0 | 1008 | $1,395 | $1.38 | 21d | 1 | 0.71mi |
| 1402 Melvin St #1 Tallahassee, FL | 2.0 | 1.0 | 550 | $1,100 | $2.00 | 21d | 1 | 0.72mi |
| 1533 S Bronough St Tallahassee, FL | 2.0 | 1.0 | 750 | $1,150 | $1.53 | 14d | 1 | 0.73mi |
| 900 Taylor St Unit B Tallahassee, FL | 1.0 | 1.0 | 864 | $1,000 | $1.16 | 21d | 1 | 0.75mi |
| 1643 Sharkey St Tallahassee, FL | 3.0 | 1.0 | 912 | $1,350 | $1.48 | 21d | 1 | 0.77mi |
| 1737 S M L King Jr Blvd Tallahassee, FL | 3.0 | 1.0 | 701 | $1,450 | $2.07 | 21d | 1 | 0.79mi |
| 1616 McCaskill Ave Tallahassee, FL | 1.0–2.0 | 1.0 | 750 | $969 | $1.29 | 21d | 43 | 0.82mi |
| 1504 S Adams St #1 Tallahassee, FL | 2.0 | 2.0 | 1088 | $1,300 | $1.19 | 14d | 1 | 0.83mi |
| 1515 Levy Ave Tallahassee, FL | 1.0 | 1.0 | 600 | $774 | $1.29 | 14d | 6 | 0.86mi |
| 2332 Keith St Tallahassee, FL | 2.0 | 1.0 | 650 | $1,050 | $1.62 | 21d | 1 | 0.89mi |
| 394 Prince St Unit 394-PRI Tallahassee, FL | 1.0 | 1.0 | 600 | $1,250 | $2.08 | 21d | 1 | 0.94mi |
| 300 S Duval St #804 Tallahassee, FL | 1.0 | 1.0 | 703 | $2,000 | $2.84 | 14d | 1 | 0.95mi |
| 215 W College Ave Unit 706B Tallahassee, FL | 2.0 | 1.0 | 823 | $2,600 | $3.16 | 21d | 1 | 1.02mi |
| 215 W College Ave #302 Tallahassee, FL | 1.0 | 1.0 | 726 | $1,800 | $2.48 | 21d | 1 | 1.02mi |
| 850 S Gadsden St Tallahassee, FL | 2.0 | 1.0–2.0 | 828 | $3,549 | $4.29 | 14d | 34 | 1.04mi |
| 509 Famcee Ave Tallahassee, FL | 3.0 | 2.0 | 1079 | $1,700 | $1.58 | 21d | 1 | 1.10mi |
| 220 Atkinson Dr Unit D Tallahassee, FL | 2.0 | 1.0 | 928 | $1,100 | $1.19 | 21d | 1 | 1.12mi |
| 930 S Lipona Rd Unit D Tallahassee, FL | 2.0 | 2.0 | 896 | $1,295 | $1.45 | 21d | 1 | 1.17mi |
| 1854 Belle Vue Way Tallahassee, FL | 2.0–4.0 | 1.0–2.0 | 1100 | $1,235 | $1.12 | 21d | 1 | 1.17mi |
| 301 S Lipona Rd #24 Tallahassee, FL | 2.0 | 1.5 | 896 | $1,350 | $1.51 | 21d | 1 | 1.21mi |
| 2205 Magnolia Cir Tallahassee, FL | 1.0–2.0 | 1.0–2.0 | 750 | $1,225 | $1.63 | 21d | 1 | 1.27mi |
| 2205 Magnolia Cir Tallahassee, FL | 1.0–2.0 | 1.0–2.0 | 750 | $1,225 | $1.63 | 14d | 9 | 1.27mi |
| 2218 Magnolia Cir Tallahassee, FL | 1.0–2.0 | 1.0–2.0 | 700 | $1,200 | $1.71 | 21d | 7 | 1.27mi |
| 322 Conradi St Tallahassee, FL | 3.0 | 2.0 | 1100 | $1,950 | $1.77 | 21d | 4 | 1.29mi |
| 420 E Park Ave Unit 50 Tallahassee, FL | 2.0 | 1.0 | 770 | $1,050 | $1.36 | 14d | 1 | 1.39mi |
| 534 E College Ave Tallahassee, FL | 1.0 | 1.0 | 709 | $925 | $1.30 | 21d | 1 | 1.42mi |
| 420 E Park Ave Apt 22 Tallahassee, FL | 1.0 | 1.0 | 550 | $800 | $1.45 | 14d | 1 | 1.42mi |
| 412 W Brevard St Unit 412 Tallahassee, FL | 3.0 | 2.0 | 900 | $800 | $0.89 | 21d | 1 | 1.44mi |
| 440 N Monroe St Tallahassee, FL | 3.0 | 1.0–3.0 | 1311 | $3,121 | $2.38 | 14d | 15 | 1.45mi |
| 401 Putnam Dr Tallahassee, FL | 1.0–2.0 | 1.0–2.0 | 766 | $1,250 | $1.63 | 21d | 1 | 1.47mi |
Listing history 9 events
-
2026-06-18days on market $150,000 Active 11 DOM
-
2026-06-17days on market $150,000 Active 10 DOM
-
2026-06-16days on market $150,000 Active 9 DOM
-
2026-06-15days on market $150,000 Active 8 DOM
-
2026-06-14days on market $150,000 Active 6 DOM
-
2026-06-10days on market $150,000 Active 3 DOM
-
2026-06-09days on market $150,000 Active 2 DOM
-
2026-06-07remarks 508-char remark
-
2026-06-07$150,000 Active 1 DOM
ⓘ Source: listings_history table (triggers on properties + properties_extension) + one-shot
backfill from property_details.listing_events for pre-trigger history.
Tax reassessment forecast FL · Resets to sale price
- Current annual tax
- $1,411 · $118/mo
- Projected year-2 tax
- $1,411 · $118/mo
- Expected delta
- $0/yr ($0/mo · 0.0%)
ⓘ Screening estimate from a state-policy table — verify with the county assessor before closing.
Climate risk First Street
- Flood 1/10 Low FEMA zone X (unshaded) · 0% chance over 30 yrs
- Wildfire 1/10 Low
- Heat 8/10 Severe 7 d/yr ≥108°F today · 20 d/yr by 30 yrs out
- Wind 9/10 Extreme 99% chance of damaging wind over 30 yrs
- Air quality 4/10 Moderate 5 unhealthy d/yr today · 6 by 30 yrs out
Nearby sold comps map
Loading sold comps map…
Walkable amenities ~0.75 mi
Loading nearby amenities…
Taxation est. · year 1
- Rental income
- $16,579
- − Mortgage interest
- −$8,402
- − Property taxes
- −$1,411
- − Insurance
- −$750
- − Repairs & maintenance
- −$1,326
- − Management
- −$1,326
- − Depreciation
- −$4,364
- Taxable loss
- −$1,001
- Est. tax savings @ 24.0%
- +$240
- After-tax cash flow
- $1,737/yr
For passive investors: Depreciation is non-cash, so a rental often shows a tax loss while cash-flowing — sheltering income. Rental losses are passive: they offset passive income freely, and up to $25,000/yr can offset ordinary (W-2) income if you actively participate and your MAGI is under $100k (phasing out to $0 by $150k); unused losses carry forward. On sale, claimed depreciation is recaptured at up to 25%, and gains may owe capital-gains tax (a 1031 exchange can defer both). Figures are a year-1 estimate at your 24.0% rate — not tax advice; consult a CPA.
Schools (NCES district)
- District
- Leon
- NCES district ID
- 1201110
- Math proficiency
- 48% ▼ -13.00%
- Reading proficiency
- 53% ▼ -5.00%
- Median HH income
- $46,339
- Composite
- 42.84/100
- National rank
- #3131
- State rank
- #33 of 73 in FL
Livability — Tallahassee
- Score
- 86/100
- State rank
- #19
- US rank
- #429
Category grades
Schools grade is shown separately in the Schools card above.
Census & demographics
- Census place
- Tallahassee, FL
- County
- Leon County · 294,472 people
- City population
- 294,472
- Metro
- Tallahassee, FL
- Population (ZIP)
- 14,888
- Household income
- $38,288
- Rent vs Own
- Severe rent burden
- 1272.0
Population outlook (Leon County) Hauer SSP2
- Today (2025)
- 315,507 people
- By 2030
- 330,677 · +4.8%
- By 2040
- 358,465 · +13.6%
- By 2050
- 386,804 · +22.6%
- By 2075
- 465,480 · +47.5%
- By 2100
- 519,959 · +64.8%
Race, ethnicity, and origin ACS 2023
- Neighborhood character
- Diverse neighborhood (Simpson 0.61)
- Race & ethnicity
- Black 50% White 36% Hispanic / Latino 9% Two or more races 5%
- Hispanic origin (detail)
- Mexican 3%
- Common ancestry
- Italian 1% Lithuanian 1% Slovak 1%
- Foreign-born
- 4% · Canada
- Languages at home
- 92% English-only · Spanish 6% French/Haitian/Cajun 1% German/W. Germanic 1%
Political lean MEDSL · Leon
- 2024 margin
- Strong D (+21.8) · D 60.3% · R 38.5% · Other 1.2%
- 2008→2024 swing
- -2.5pp toward R · 2008: 24.3pp · 2024: 21.8pp
- All cycles
- 2024: D+21.8 2020: D+28.3 2016: D+25.1 2012: D+23.6 2008: D+24.3
Not yet ingested
- Civics
- —
Market trends
- HPI YoY
- ▼ -0.54%
- Current HPI
- 270.5721
- Rent YoY
- —
- Metro
- Tallahassee, FL
- State GDP YoY
- ▲ 3.28%
- F500 in state
- 36
Industry mix (Fortune 500 HQ in FL)
| Industry | F500 HQs | Revenue |
|---|---|---|
| Industrial Technology | 2 | $29B |
|
||
| Insurance | 2 | $17B |
|
||
| Retail | 1 | $60B |
|
||
| Technology Distribution | 1 | $58B |
|
||
| Homebuilding | 1 | $35B |
|
||
| Technology Manufacturing | 1 | $35B |
|
||
Price history
-57.7% since first listed10 events — show timeline
- 2026-06-07 Listed $150,000 CATRS
- 2012-08-12 Sold (MLS) $40,000 CATRS
- 2010-03-24 Listed $108,000 CATRS
- 2007-07-03 Listing Removed — CATRS
- 2007-06-21 Sold (Public Records) $115,000 Public Records
- 2007-06-05 Listed $119,500 CATRS
- 2006-12-12 Listing Removed — CATRS
- 2006-08-31 Listing Removed — CATRS
- 2006-05-11 Listed $330,000 CATRS
- 2006-05-01 Listed $355,000 CATRS
Property tax history
+5.1%/yrLatest (2025): $1,411 · +9.0% YoY. Source: county tax records.
Cash-flow waterfall
monthlySold comps — $/sqft
last 12 mo · ≤1 miLoading sold comps…