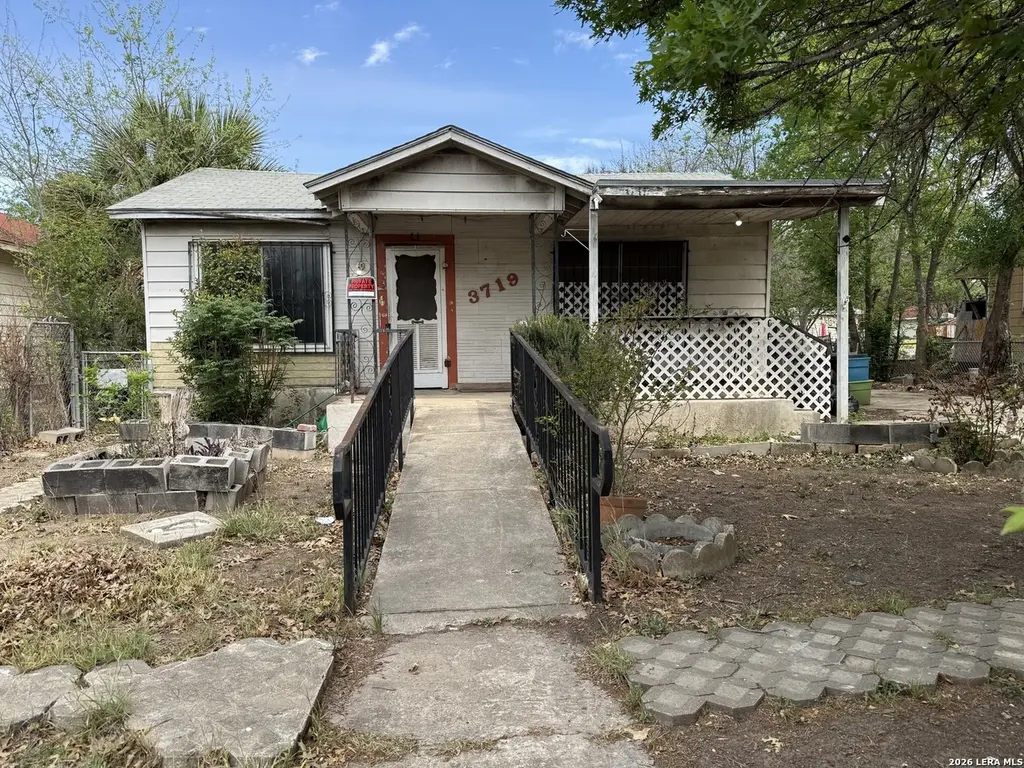
3719 W Houston St · San Antonio, TX
Flood risk 6/10 · Moderate
- FEMA flood zone
- AE
- Chance of flooding over 30 yrs
- 0.73%
- Est. flood insurance / yr
- $1,737 – $8,500
Fire risk 1/10 · Minimal
- Est. fire insurance / yr
- $1,222 – $2,270
Heat risk 8/10 · Major
- Hot days now (above 109°F)
- 7 days/yr
- Hot days in 30 yrs
- 22 days/yr
Wind risk 6/10 · Moderate
- Chance of severe wind over 30 yrs
- 77.0%
Air-quality risk 2/10 · Minimal
- Unhealthy air days now
- 1 days/yr
- Unhealthy air days in 30 yrs
- 2 days/yr
Risk factors via First Street. Map © Google.
Why this score? — see what drove the A grade
The composite is a weighted blend of 9 inputs, each scored 0–100. Each bar is that input's sub-score; the figure is the points it added to the 100-point composite (weight × sub-score).
- Cash flow +29.5/30.0
- ARV discount +15.0/15.0
- DSCR +10.0/10.0
- Appreciation +10.0/10.0
- 1% rule +9.9/10.0
- Rent growth +4.4/5.0
- Livability +4.0/5.0
- Condition / age +2.5/5.0
- Schools +1.4/10.0
$100,000
🖨 Deal sheet 📄 Offer letter ✓ Due diligence
Listing remarks MLS
Located in the established Prospect Hill area of San Antonio, this 3-bedroom, 2-bath single-story home offers approximately 1,368 sq ft of living space on a generously sized lot. Built in 1952, the property presents a strong value-add opportunity for investors or buyers looking to customize and renovate. The home features a functional layout with solid bones and sits in a developing area with ongoing revitalization and comparable sales activity nearby. Conveniently positioned with quick access to major roads and just minutes from downtown, this property is ideal for a fix-and-flip, rental portfolio addition, or long-term hold. With nearby homes selling in the mid-range price points and a buyer's market trend in the area, this property offers upside potential for the right buyer willing to add improvements and vision. Value-add opportunity in growing west-side corridor. Needs updates but priced accordingly-ideal for rehab, rental, or resale. Strong ARV potential supported by nearby comps. Sold as-is.
Key facts
- Functional layout
- Built 1952
- Listed 66 days
Tags
Neighborhood map
What this means for you Summary
Snapshot
- This is a 3-bed/2.0-bath single-family listed at $100k.
Deal economics
- At list price, monthly cash flow is $-69 ($-833/yr) — negative.
- To cash-flow at today's rent, offer at most $88k (12.3% below list).
- Meets the 1% rule at list price ($1k rent vs $100k).
- Recommended offer: $88k (12.3% below list) — sets the bar for cash-flow.
- Cap rate 10.6% vs local median 3.8% in San Antonio — top-decile yield for the area; either an underpriced asset or a hidden risk that comps aren't pricing in. Stress-test before assuming the spread holds.
Location & tenants
- Location reads 80/100 on livability (#31 in TX, #1,616 nationally) — a professional / high-income tenant draw. Strengths: amenities A+, commute A+, cost of living A+; Watch: schools C-, crime F.
- San Antonio ISD (urban): math 12% / reading 22% proficiency, ranked #805 of 826 in TX (top 98%) — low school quality limits family demand, transient renter base, plan for 1-2y turnover; 80% free/reduced lunch — lower-income household profile, screen leases tightly.
- Market conditions: Rents rising fast (+7.7%/yr); 154 active listings in the ZIP; 28 comparable units currently listed for rent nearby; rentals at typical pace (median 24d on market — plan ~3-4 weeks tenant-placement turnaround); lower-income renter base — watch delinquency; 8,308 units permitted in Bexar County in 2024 (2,506 in 5+ unit buildings).
- At $1,490/mo this rent would consume 55% of the median local household income ($32k/yr) (locally 2789% of renters already pay >50% of income on rent) — very limited rent-growth headroom before tenants either downsize or default.
Forward outlook
- In year one you build about $11k of equity ($691 loan paydown + $10k appreciation (10.0% local appreciation)).
- Bexar County population projected at +50% by 2050 — long-run rental-demand tailwind backs the buy-and-hold thesis.
- At projected returns (10.0% appreciation + 7.7% rent growth), your $28k cash investment doubles in ~3 years — after that, you're playing with house money.
- By year 4, paydown + projected appreciation supports a ~$38k cash-out refi (75% LTV) — recoverable capital for the next deal without selling this one.
Negotiation context
- It's been on market 66 days — a 6% lower offer ($94k) is reasonable based on typical stale-listing flexibility.
Risks & watch-outs
- Watch-outs: property tax is 3.0% of price; flood insurance adds $427/mo; built in 1952 — expect roof / HVAC / electrical / plumbing capex.
- Climate carrying-cost: in FEMA flood zone AE (mandatory federal flood insurance); major wind risk, 77% chance of damaging wind over 30y; extreme-heat days projected 7→22/yr by 2055 (HVAC capex compounding) — expect insurance premiums to compound above CPI over the hold.
Questions for the listing agent
- What do current leases actually rent for vs. the listed asking? Can we see a recent rent roll and the last 12 months of T-12 income?
- It's been on market 66 days. Have you received any prior offers? Is the seller open to a 12% concession, seller financing, or rate buy-down credit?
- Built in 1952 — when were the roof, HVAC, electrical panel, plumbing, and water heater last replaced?
- Property tax is high relative to price — has the assessment been appealed recently, and will the sale trigger a re-assessment?
- What's the actual annual flood-insurance premium (NFIP or private), and is the property in a SFHA with mandatory coverage?
- Why hasn't it sold? Are there any deal-killer items the seller is aware of (foundation, flood, title, zoning, code violations)?
- Is there a deadline driving the sale (1031 exchange, divorce, estate, relocation)? That informs how much negotiation room exists.
- Crime grade is F in this area — have there been break-ins, vandalism, or insurance claims at this property in the last 3 years? What carrier currently insures it and at what premium?
- What's the average days-on-market for RENTAL listings here right now (not sales)? A rising rental-DOM trend means longer vacancies and softer asking-rent achievability than the comps imply.
- What's the recent tenant-quality profile in this submarket — average credit score on applications, eviction rate, late-payment / NSF rate, and stable-employment percentage? A property-management company in the area should have these aggregated.
- How much new for-sale + rental construction is in the pipeline within 1–3 miles? Heavy new supply typically softens prices + rents 12–24 months out; constrained supply supports both.
Investment metrics
- 1% rule
- 1.49% ✓
- Cap rate
- 10.58%
- Cash-on-cash
- 15.30%
- DSCR
- 1.68
- GRM
- 5.6
CMA / ARV
- ARV (median comp)
- $151,411
- List price
- $100,000
- Delta
- -33.95%
- Verdict
- UNDERPRICED
- Comps
- 20 within 1.0 mi
Show comp detail 12 sales within ~0.75 mi
| Address | Dist | Beds/Ba | Sqft | Sold | Price | $/sf | Match |
|---|---|---|---|---|---|---|---|
| 3402 W Travis | 0.28mi | 3/2.0 | 1,309 (-4%) | 7mo | $149,999 | $115 | 74 |
| 3714 Martin | 0.31mi | 3/1.0 | 1,404 (+3%) | 8mo | $89,900 | $64 | 71 |
| 3718 W Martin St | 0.30mi | 3/2.0 | 1,236 (-10%) | 2mo | $90,000 | $73 | 68 |
| 2511 Ruiz | 0.53mi | 3/2.0 | 1,304 (-5%) | 12mo | $245,000 | $188 | 58 |
| 3023 W Travis | 0.62mi | 3/2.0 | 1,476 (+8%) | 3mo | $199,900 | $135 | 55 |
| 3523 W Martin | 0.47mi | 3/2.0 | 1,232 (-10%) | 8mo | $85,000 | $69 | 54 |
| 2115 Leal | 0.46mi | 3/1.0 | 1,472 (+8%) | 11mo | $100,000 | $68 | 53 |
| 3430 Commerce | 0.23mi | 2/1.0 (-1) | 1,164 (-15%) | 8mo | $49,500 | $43 | 49 |
| 3011 W Cesar E Chavez | 0.63mi | 4/3.0 (+1) | 1,262 (-8%) | 6mo | $149,900 | $119 | 44 |
| 923 N Hamilton | 0.72mi | 3/2.0 | 1,472 (+8%) | 13mo | $109,700 | $75 | 43 |
| 1806 Delgado St | 0.63mi | 3/1.0 | 1,224 (-10%) | 9mo | $115,000 | $94 | 42 |
| 2014 Montezuma | 0.75mi | 3/2.0 | 1,198 (-12%) | 4mo | $179,900 | $150 | 41 |
Match score weights: distance 35% · size 25% · config 20% · recency 20%. Top-matched comps best support the ARV.
Projected returns pro-forma
10.0% appreciation · 7.73% rent growth · sell at horizon
- IRR
- 25.1%
- Equity multiple
- 3.07×
- Total profit
- $57,834
- Equity at exit
- $90,088
- IRR
- 24.4%
- Equity multiple
- 7.88×
- Total profit
- $192,725
- Equity at exit
- $194,278
Cash invested: $28,000 (down + closing). Projections, not guarantees.
Landlord ↔ Tenant lean methodology
- Overall (STATE)
- 87 Strongly Landlord-Friendly
- State Texas
- 87 Strongly Landlord-Friendly · R+5
- County
- — inherits STATE
- City
- — inherits STATE
ZIP-level market 78207
- Home prices YoY
- 15.2%
- Rents YoY
- 7.7%
- Active inventory
- 154
- Price-to-rent
- 5.6×
Monthly cashflow live
- Estimated rent
- $1,490 high interval (Pro) →
- Mortgage (P&I)
- −$524
- Tax from tax record
- −$254 /mo · $3,048/yr
- Insurance
- −$42
- Flood insurance flood zone
- −$427 /mo · $5,118/yr
- HOA
- −$0
- Vacancy / Maint / Mgmt
- −$313
- Net cashflow
- $-69
Break-even live
UW: 25.0% down · 7.5% · 30yr · 1.5% tax · 5.0% vac · 8.0% maint · 8.0% mgmt
Financing live
Cash to close
- Down payment
- $25,000
- Closing costs
- $3,000
- Reserves months
- —
- Total cash needed
- —
Loan-product check · same deal, 3 products live
Conventional
25% down · 7.5% · 30yr
- Down + closing
- —
- Monthly P&I
- —
- Monthly cashflow
- —
- DSCR
- —
- Eligible?
- —
Personal DTI + credit; lowest rate.
DSCR
20% down · 8.5% · 30yr
- Down + closing
- —
- Monthly P&I
- —
- Monthly cashflow
- —
- DSCR
- —
- Eligible?
- —
No personal income docs; deal must DSCR.
Hard money
10% down · 12.0% · 12mo
- Down + closing
- —
- Monthly P&I
- —
- Monthly cashflow
- —
- DSCR
- —
- Eligible?
- —
Short-term bridge; refi at stabilization.
Rent comps 28 comps
| Address | Beds | Baths | Sqft | Rent | $/sqft | DOM | Units | Dist |
|---|---|---|---|---|---|---|---|---|
| 3918 W Martin St San Antonio, TX | 3.0 | 1.0 | 1200 | $1,300 | $1.08 | 24d | 1 | 0.21mi |
| 2811 Buena Vista St San Antonio, TX | 4.0 | 2.0 | 1750 | $2,350 | $1.34 | 24d | 1 | 0.58mi |
| 234 Gould St Unit 102 San Antonio, TX | 2.0 | 1.5 | 948 | $1,195 | $1.26 | 4d | 1 | 0.60mi |
| 3038 W Salinas Unit 101 San Antonio, TX | 3.0 | 2.5 | 1149 | $1,550 | $1.35 | 4d | 1 | 0.66mi |
| 122 Collins Ct San Antonio, TX | 2.0 | 1.0 | 927 | $1,150 | $1.24 | 22d | 1 | 0.75mi |
| 1906 Montezuma St San Antonio, TX | 2.0 | 1.5 | 1790 | $1,300 | $0.73 | 44d | 1 | 0.75mi |
| 214 Aztec St San Antonio, TX | 3.0 | 2.0 | 973 | $1,275 | $1.31 | 15d | 1 | 0.76mi |
| 1545 Ruiz St San Antonio, TX | 2.0 | 2.0 | 1020 | $935 | $0.92 | 44d | 1 | 0.82mi |
| 2425 Monterey St San Antonio, TX | 3.0 | 2.0 | 1416 | $2,000 | $1.41 | 44d | 1 | 0.84mi |
| 1230 Rivas St San Antonio, TX | 3.0 | 2.5 | 1287 | $1,999 | $1.55 | 24d | 1 | 0.89mi |
| 1231 Rivas St Unit 102 San Antonio, TX | 3.0 | 2.0 | 1120 | $1,299 | $1.16 | 44d | 1 | 0.91mi |
| 1823 San Carlos St San Antonio, TX | 3.0 | 2.0 | 1090 | $1,099 | $1.01 | 2d | 1 | 0.92mi |
| 206 Roberts St Unit 201 San Antonio, TX | 3.0 | 2.0 | 1100 | $1,350 | $1.23 | 24d | 1 | 0.96mi |
| 2120 Monterey St Unit 102 San Antonio, TX | 2.0 | 2.0 | 1220 | $1,450 | $1.19 | 11d | 1 | 1.06mi |
| 2120 Monterey St Unit 102 San Antonio, TX | 2.0 | 2.0 | 1220 | $1,490 | $1.22 | 44d | 1 | 1.06mi |
| 709 S Chupaderas St San Antonio, TX | 3.0 | 2.0 | 1518 | $1,345 | $0.89 | 24d | 1 | 1.07mi |
| 2246 W Houston St San Antonio, TX | 4.0 | 3.0 | 1654 | $2,100 | $1.27 | 11d | 1 | 1.16mi |
| 614 N Sabinas St San Antonio, TX | 3.0 | 2.0 | 930 | $1,249 | $1.34 | 4d | 1 | 1.22mi |
| 230 Micklejohn St San Antonio, TX | 3.0 | 2.0 | 1368 | $1,595 | $1.17 | 24d | 1 | 1.22mi |
| 230 Micklejohn St San Antonio, TX | 3.0 | 2.0 | 1368 | $1,695 | $1.24 | 44d | 1 | 1.22mi |
| 509 S Trinity St San Antonio, TX | 3.0 | 1.0 | 921 | $1,300 | $1.41 | 4d | 1 | 1.32mi |
| 1706 Texas Ave San Antonio, TX | 2.0 | 2.0 | 1204 | $1,500 | $1.25 | 44d | 1 | 1.35mi |
| 1706 Texas Ave San Antonio, TX | 2.0 | 2.0 | 1204 | $1,500 | $1.25 | 24d | 1 | 1.35mi |
| 811 Rivas St San Antonio, TX | 3.0 | 2.0 | 1276 | $1,580 | $1.24 | 24d | 1 | 1.35mi |
| 155 S Josephine Tobin Dr San Antonio, TX | 3.0 | 2.5 | 1782 | $1,900 | $1.07 | 22d | 1 | 1.44mi |
| 1820 W Houston St San Antonio, TX | 3.0 | 2.0 | 1132 | $2,300 | $2.03 | 44d | 1 | 1.44mi |
| 2148 Texas Ave San Antonio, TX | 3.0 | 1.0 | 1131 | $1,375 | $1.22 | 24d | 1 | 1.47mi |
| 1615 N Navidad St Unit 101 San Antonio, TX | 3.0 | 2.0 | 1804 | $999 | $0.55 | 4d | 1 | 1.48mi |
Listing history 14 events
-
2026-06-18days on market $100,000 Active 66 DOM
-
2026-06-17days on market $100,000 Active 65 DOM
-
2026-06-16days on market $100,000 Active 64 DOM
-
2026-06-15days on market $100,000 Active 63 DOM
-
2026-06-13days on market $100,000 Active 61 DOM
-
2026-06-09days on market $100,000 Active 57 DOM
-
2026-06-08days on market $100,000 Active 56 DOM
-
2026-06-07days on market $100,000 Active 55 DOM
-
2026-06-04days on market $100,000 Active 52 DOM
-
2026-06-03days on market $100,000 Active 51 DOM
-
2026-06-02days on market $100,000 Active 50 DOM
-
2026-06-01days on market $100,000 Active 49 DOM
-
2026-05-31statusdays on market $100,000 Active 48 DOM
-
2026-04-13$129,900 New 1016-char remark
Show marketing remark (1016 chars)
Located in the established Prospect Hill area of San Antonio, this 3-bedroom, 2-bath single-story home offers approximately 1,368 sq ft of living space on a generously sized lot. Built in 1952, the property presents a strong value-add opportunity for investors or buyers looking to customize and renovate. The home features a functional layout with solid bones and sits in a developing area with ongoing revitalization and comparable sales activity nearby. Conveniently positioned with quick access to major roads and just minutes from downtown, this property is ideal for a fix-and-flip, rental portfolio addition, or long-term hold. With nearby homes selling in the mid-range price points and a buyer's market trend in the area, this property offers upside potential for the right buyer willing to add improvements and vision. Value-add opportunity in growing west-side corridor. Needs updates but priced accordingly-ideal for rehab, rental, or resale. Strong ARV potential supported by nearby comps. Sold as-is.
ⓘ Source: listings_history table (triggers on properties + properties_extension) + one-shot
backfill from property_details.listing_events for pre-trigger history.
Tax reassessment forecast TX · Resets to sale price
- Current annual tax
- $3,048 · $254/mo
- Projected year-2 tax
- $3,048 · $254/mo
- Expected delta
- $0/yr ($0/mo · 0.0%)
ⓘ Screening estimate from a state-policy table — verify with the county assessor before closing.
Climate risk First Street
- Flood 6/10 Major FEMA zone AE · 73% chance over 30 yrs
- Wildfire 1/10 Low
- Heat 8/10 Severe 7 d/yr ≥109°F today · 22 d/yr by 30 yrs out
- Wind 6/10 Major 77% chance of damaging wind over 30 yrs
- Air quality 2/10 Low 1 unhealthy d/yr today · 2 by 30 yrs out
Nearby sold comps map
Loading sold comps map…
Walkable amenities ~0.75 mi
Loading nearby amenities…
Taxation est. · year 1
- Rental income
- $17,881
- − Mortgage interest
- −$5,602
- − Property taxes
- −$3,048
- − Insurance
- −$5,618
- − Repairs & maintenance
- −$1,430
- − Management
- −$1,430
- − Depreciation
- −$2,909
- Taxable loss
- −$2,157
- Est. tax savings @ 24.0%
- +$518
- After-tax cash flow
- $-316/yr
For passive investors: Depreciation is non-cash, so a rental often shows a tax loss while cash-flowing — sheltering income. Rental losses are passive: they offset passive income freely, and up to $25,000/yr can offset ordinary (W-2) income if you actively participate and your MAGI is under $100k (phasing out to $0 by $150k); unused losses carry forward. On sale, claimed depreciation is recaptured at up to 25%, and gains may owe capital-gains tax (a 1031 exchange can defer both). Figures are a year-1 estimate at your 24.0% rate — not tax advice; consult a CPA.
Schools (NCES district)
- District
- San Antonio ISD
- NCES district ID
- 4838730
- Math proficiency
- 12% ▼ -21.00%
- Reading proficiency
- 22% ▼ -7.00%
- Median HH income
- $30,952
- Composite
- 13.57/100
- National rank
- #9512
- State rank
- #805 of 826 in TX
Livability — San Antonio
- Score
- 80/100
- State rank
- #31
- US rank
- #1616
Category grades
Schools grade is shown separately in the Schools card above.
Census & demographics
- Census place
- San Antonio, TX
- County
- Bexar County · 1,990,555 people
- City population
- 1,806,925
- Metro
- San Antonio-New Braunfels, TX
- Population (ZIP)
- 55,474
- Household income
- $32,472
- Rent vs Own
- Severe rent burden
- 2789.0
Population outlook (Bexar County) Hauer SSP2
- Today (2025)
- 2,336,851 people
- By 2030
- 2,560,728 · +9.6%
- By 2040
- 3,020,569 · +29.3%
- By 2050
- 3,493,522 · +49.5%
- By 2075
- 4,668,459 · +99.8%
- By 2100
- 5,533,242 · +136.8%
Race, ethnicity, and origin ACS 2023
- Neighborhood character
- Predominantly Hispanic (88%)
- Race & ethnicity
- Hispanic / Latino 88% Two or more races 41% White 6% Black 5% Native American 2%
- Hispanic origin (detail)
- Mexican 79%
- Foreign-born
- 19% · Canada
- Languages at home
- 39% English-only · Spanish 60%
Political lean MEDSL · Bexar
- 2024 margin
- Lean D (+9.8) · D 54.3% · R 44.6% · Other 1.1%
- 2008→2024 swing
- +4.2pp toward D · 2008: 5.6pp · 2024: 9.8pp
- All cycles
- 2024: D+9.8 2020: D+18.2 2016: D+13.5 2012: D+4.6 2008: D+5.6
Not yet ingested
- Civics
- —
Market trends
- HPI YoY
- ▲ 34.92%
- Current HPI
- 264.7559
- Rent YoY
- ▲ 7.73%
- Metro
- San Antonio-New Braunfels, TX
- State GDP YoY
- ▲ 3.95%
- F500 in state
- 110
Industry mix (Fortune 500 HQ in TX)
| Industry | F500 HQs | Revenue |
|---|---|---|
| Energy | 16 | $1,198B |
|
||
| Technology | 5 | $198B |
|
||
| Engineering / Construction | 4 | $72B |
|
||
| Energy Services | 3 | $60B |
|
||
| Utilities | 3 | $41B |
|
||
| Healthcare | 2 | $330B |
|
||
Price history
1 event — show timeline
- 2026-04-13 Listed $129,900 LERA
Property tax history
+5.4%/yrLatest (2025): $3,048 · +10.0% YoY. Source: county tax records.
Cash-flow waterfall
monthlySold comps — $/sqft
last 12 mo · ≤1 miLoading sold comps…