7341 Eleanor #23 · Riverbank, CA
Flood risk 1/10 · Minimal
- FEMA flood zone
- X (unshaded)
- Chance of flooding over 30 yrs
- 0.0%
- Est. flood insurance / yr
- $507 – $1,088
Fire risk 7/10 · Major
- Est. fire insurance / yr
- $659 – $1,223
Heat risk 7/10 · Major
- Hot days now (above 102°F)
- 7 days/yr
- Hot days in 30 yrs
- 15 days/yr
Wind risk 1/10 · Minimal
- Chance of severe wind over 30 yrs
- —
Air-quality risk 10/10 · Severe
- Unhealthy air days now
- 36 days/yr
- Unhealthy air days in 30 yrs
- 39 days/yr
Risk factors via First Street. Map © Google.
Why this score? — see what drove the B- grade
The composite is a weighted blend of 9 inputs, each scored 0–100. Each bar is that input's sub-score; the figure is the points it added to the 100-point composite (weight × sub-score).
- Cash flow +30.0/30.0
- 1% rule +10.0/10.0
- DSCR +10.0/10.0
- ARV discount +7.5/15.0
- Livability +2.9/5.0
- Rent growth +2.5/5.0
- Condition / age +2.2/5.0
- Schools +2.1/10.0
- Appreciation +0.0/10.0
$72,500
🖨 Deal sheet 📄 Offer letter ✓ Due diligence
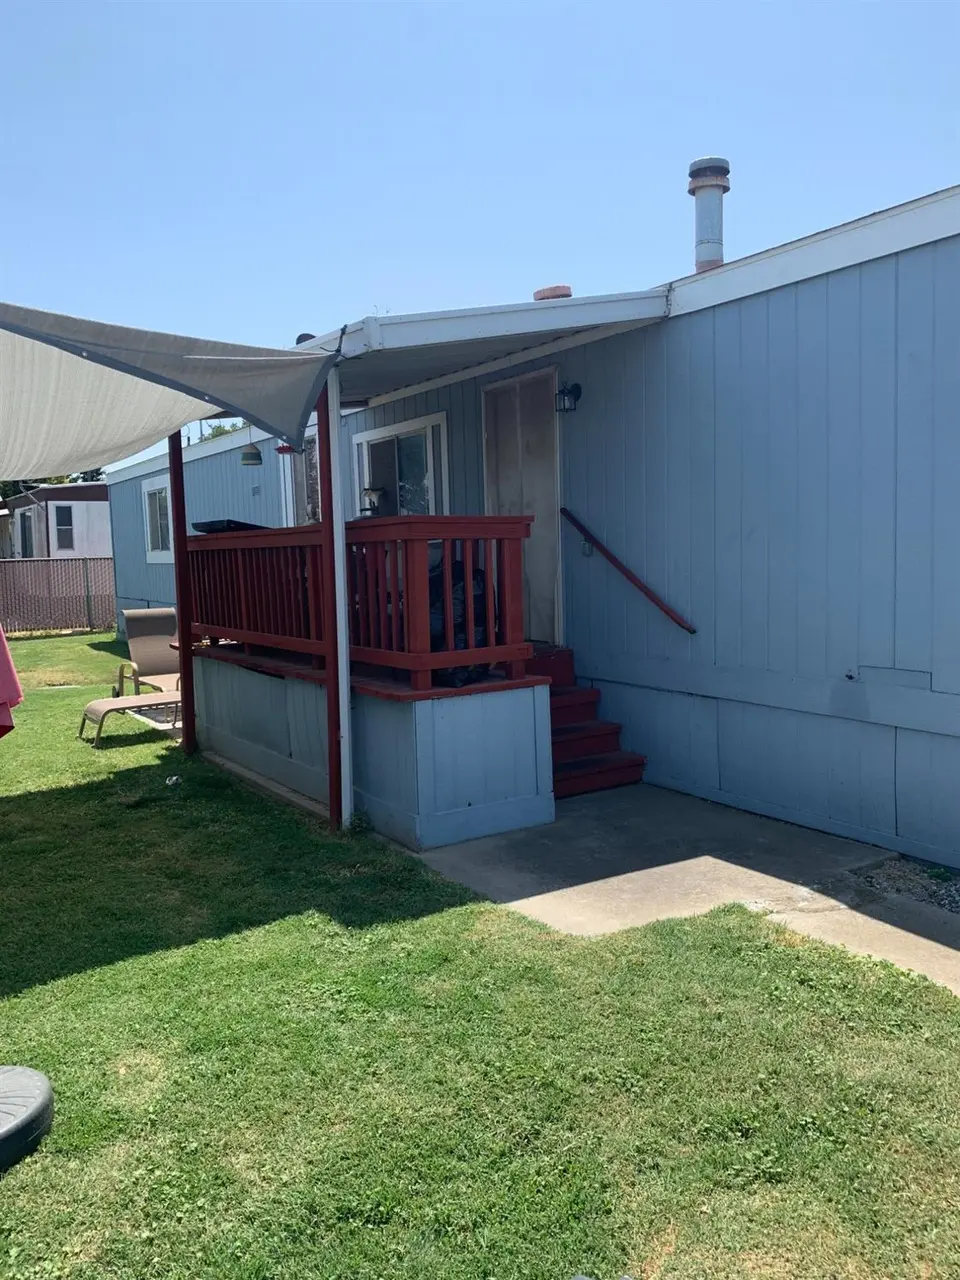
Listing remarks
Spacious 2-Bedroom, 2-Bath Mobile Home in All-Age Community This inviting end-unit offers a comfortable and versatile living space suitable for all ages. Featuring a large primary bedroom and an oversized primary suite, you'll enjoy plenty of room to relax. The full kitchen and great room provide an open-concept layout filled with abundant natural light, creating a warm and welcoming atmosphere. The home does need some cosmetic updates, including paint and minor updates, providing a great opportunity for you to personalize and enhance the space. Additional highlights include covered parking for convenience and privacy, and being an end unit means only one neighboring home, offering extra
Key facts
- Covered parking
- End unit
- Natural light
Tags
Neighborhood map
What this means for you Summary
Snapshot
- This is a 2-bed/2.0-bath manufactured listed at $72k. Condition is rated fair.
Deal economics
- At list price, monthly cash flow is $1k ($14k/yr) — positive.
- The deal already cash-flows at list — no discount required.
- Meets the 1% rule at list price ($2k rent vs $72k).
- Recommended offer: $70k (3.0% below list) — sets the bar for market timing.
- Cap rate 25.8% vs local median 3.0% in Riverbank — top-decile yield for the area; either an underpriced asset or a hidden risk that comps aren't pricing in. Stress-test before assuming the spread holds.
Location & tenants
- Location reads 57/100 on livability (#757 in CA) — a working-class tenant base; expect higher turnover. Strengths: housing A+, crime B+, employment B; Watch: schools F, amenities D-, commute F.
- Riverbank Unified (suburban): math 16% / reading 32% proficiency, ranked #424 of 517 in CA (top 82%) — low school quality limits family demand, transient renter base, plan for 1-2y turnover; 68% free/reduced lunch — lower-income household profile, screen leases tightly.
- Market conditions: 199 active listings in the ZIP; 2 comparable units currently listed for rent nearby; solid renter incomes; 923 units permitted in Stanislaus County in 2024 (63 in 5+ unit buildings).
Forward outlook
- Local home prices are declining (-3.0%/yr); year-one equity from $501 of loan paydown is wiped out by about $2k of value loss. Plan a longer hold.
- Stanislaus County population projected at +14% by 2050 — modest demand growth; plan on rents tracking national, not racing it.
- At projected returns (-3.0% appreciation + 3.0% rent growth), your $20k cash investment doubles in ~2 years — after that, you're playing with house money.
Negotiation context
- It's been on market 58 days — a 3% lower offer ($70k) is reasonable based on typical stale-listing flexibility.
Risks & watch-outs
- Climate carrying-cost: major wildfire risk; extreme-heat days projected 7→15/yr by 2055 (HVAC capex compounding) — expect insurance premiums to compound above CPI over the hold.
Questions for the listing agent
- It's been on market 58 days. Have you received any prior offers? Is the seller open to a 3% concession, seller financing, or rate buy-down credit?
- Have any recent inspections been done? Can we get a copy of the seller's disclosures and any deferred-maintenance estimates?
- Is there a deadline driving the sale (1031 exchange, divorce, estate, relocation)? That informs how much negotiation room exists.
- Schools are F-rated, which usually means shorter tenancies and higher turnover. Who's the typical renter profile here, and what's been the actual vacancy rate?
- What's the average days-on-market for RENTAL listings here right now (not sales)? A rising rental-DOM trend means longer vacancies and softer asking-rent achievability than the comps imply.
- What's the recent tenant-quality profile in this submarket — average credit score on applications, eviction rate, late-payment / NSF rate, and stable-employment percentage? A property-management company in the area should have these aggregated.
- How much new for-sale + rental construction is in the pipeline within 1–3 miles? Heavy new supply typically softens prices + rents 12–24 months out; constrained supply supports both.
Investment metrics
- 1% rule
- 2.94% ✓
- Cap rate
- 25.84%
- Cash-on-cash
- 69.81%
- DSCR
- 4.11
- GRM
- 2.8
CMA / ARV
No comps found within radius.
Projected returns pro-forma
-3.0% appreciation · 3.0% rent growth · sell at horizon
- IRR
- 69.3%
- Equity multiple
- 4.13×
- Total profit
- $63,496
- Equity at exit
- $10,810
- IRR
- 73.4%
- Equity multiple
- 8.50×
- Total profit
- $152,270
- Equity at exit
- $6,268
Cash invested: $20,300 (down + closing). Projections, not guarantees.
Landlord ↔ Tenant lean methodology
- Overall (STATE)
- 18 Strongly Tenant-Friendly
- State California
- 18 Strongly Tenant-Friendly · D+13
- County
- — inherits STATE
- City
- — inherits STATE
ZIP-level market 95361
- Active inventory
- 199
- Price-to-rent
- 2.8×
Monthly cashflow live
- Estimated rent
- $2,129 medium interval (Pro) →
- Mortgage (P&I)
- −$380
- Tax est. 1.5%
- −$91 /mo · $1,088/yr
- Insurance
- −$30
- HOA
- −$0
- Vacancy / Maint / Mgmt
- −$447
- Net cashflow
- $1,181
Break-even live
UW: 25.0% down · 7.5% · 30yr · 1.5% tax · 5.0% vac · 8.0% maint · 8.0% mgmt
Financing live
Cash to close
- Down payment
- $18,125
- Closing costs
- $2,175
- Reserves months
- —
- Total cash needed
- —
Loan-product check · same deal, 3 products live
Conventional
25% down · 7.5% · 30yr
- Down + closing
- —
- Monthly P&I
- —
- Monthly cashflow
- —
- DSCR
- —
- Eligible?
- —
Personal DTI + credit; lowest rate.
DSCR
20% down · 8.5% · 30yr
- Down + closing
- —
- Monthly P&I
- —
- Monthly cashflow
- —
- DSCR
- —
- Eligible?
- —
No personal income docs; deal must DSCR.
Hard money
10% down · 12.0% · 12mo
- Down + closing
- —
- Monthly P&I
- —
- Monthly cashflow
- —
- DSCR
- —
- Eligible?
- —
Short-term bridge; refi at stabilization.
Rent comps 2 comps
| Address | Beds | Baths | Sqft | Rent | $/sqft | DOM | Units | Dist |
|---|---|---|---|---|---|---|---|---|
| 4516 Santa Fe St Riverbank, CA | 3.0 | 2.0 | 1122 | $2,250 | $2.01 | 13d | 1 | 0.74mi |
| 4408 Santa Fe St Riverbank, CA | 3.0 | 2.0 | 1122 | $2,250 | $2.01 | 13d | 1 | 0.78mi |
Listing history 16 events
-
2026-06-18days on market $72,500 Active 58 DOM
-
2026-06-17days on market $72,500 Active 57 DOM
-
2026-06-16days on market $72,500 Active 56 DOM
-
2026-06-15days on market $72,500 Active 55 DOM
-
2026-06-14days on market $72,500 Active 53 DOM
-
2026-06-13days on market $72,500 Active 52 DOM
-
2026-06-10days on market $72,500 Active 50 DOM
-
2026-06-09days on market $72,500 Active 49 DOM
-
2026-06-08days on market $72,500 Active 48 DOM
-
2026-06-07days on market $72,500 Active 47 DOM
-
2026-06-05days on market $72,500 Active 44 DOM
-
2026-06-03days on market $72,500 Active 43 DOM
-
2026-06-02days on market $72,500 Active 42 DOM
-
2026-06-01days on market $72,500 Active 41 DOM
-
2026-05-31days on market $72,500 Active 40 DOM
-
2026-05-30days on market $72,500 Active 39 DOM
ⓘ Source: listings_history table (triggers on properties + properties_extension) + one-shot
backfill from property_details.listing_events for pre-trigger history.
Climate risk First Street
- Flood 1/10 Low FEMA zone X (unshaded) · 0% chance over 30 yrs
- Wildfire 7/10 Severe
- Heat 7/10 Severe 7 d/yr ≥102°F today · 15 d/yr by 30 yrs out
- Wind 1/10 Low
- Air quality 10/10 Extreme 36 unhealthy d/yr today · 39 by 30 yrs out
Nearby sold comps map
Loading sold comps map…
Walkable amenities ~0.75 mi
Loading nearby amenities…
Taxation est. · year 1
- Rental income
- $25,548
- − Mortgage interest
- −$4,061
- − Property taxes
- −$1,088
- − Insurance
- −$362
- − Repairs & maintenance
- −$2,044
- − Management
- −$2,044
- − Depreciation
- −$2,109
- Taxable income
- $13,840
- Est. tax owed @ 24.0%
- −$3,322
- After-tax cash flow
- $10,849/yr
For passive investors: Depreciation is non-cash, so a rental often shows a tax loss while cash-flowing — sheltering income. Rental losses are passive: they offset passive income freely, and up to $25,000/yr can offset ordinary (W-2) income if you actively participate and your MAGI is under $100k (phasing out to $0 by $150k); unused losses carry forward. On sale, claimed depreciation is recaptured at up to 25%, and gains may owe capital-gains tax (a 1031 exchange can defer both). Figures are a year-1 estimate at your 24.0% rate — not tax advice; consult a CPA.
Condition & rehab AI · 12 photos
This mobile home requires some cosmetic updates, including paint and minor updates, to improve its appearance and functionality.
Repairs flagged
- Minor Paint — Light blue siding and walls show some discoloration
- Minor Flooring — Carpeted floors in living areas show some wear
- Minor Kitchen — Standard kitchen appliances show some clutter
- Minor Bathrooms — Standard fixtures show some wear
Value-add opportunities
- Both Paint — Fresh paint can improve the home's curb appeal and interior aesthetics
- Both Flooring — New flooring can improve the home's appearance and functionality
- Both Kitchen — Upgraded kitchen appliances can increase the home's value and functionality
- Both Bathrooms — Updated bathrooms can increase the home's value and functionality
Renovation cost estimate screening
| Repair item | Severity | Est. cost |
|---|---|---|
| Paint · Light blue siding and walls show some discoloration | Minor | $500–3,000 |
| Flooring · Carpeted floors in living areas show some wear | Minor | $500–3,000 |
| Kitchen · Standard kitchen appliances show some clutter | Minor | $500–3,000 |
| Bathrooms · Standard fixtures show some wear | Minor | $500–3,000 |
| Total estimated repair cost · 4 items | $2,000–12,000 |
Value-add ROI direction
- Both Paint — Fresh paint can improve the home's curb appeal and interior aesthetics ↑
- Both Flooring — New flooring can improve the home's appearance and functionality ↑
- Both Kitchen — Upgraded kitchen appliances can increase the home's value and functionality ↑
- Both Bathrooms — Updated bathrooms can increase the home's value and functionality ↑
ⓘ Cost ranges are severity-bucket heuristics (US national rule-of-thumb). Get contractor quotes + a written scope before underwriting a rehab budget.
Schools (NCES district)
- District
- Riverbank Unified
- NCES district ID
- 0600061
- Math proficiency
- 16% ▼ -11.00%
- Reading proficiency
- 32% ▼ -7.00%
- Median HH income
- $46,066
- Composite
- 20.79/100
- National rank
- #8511
- State rank
- #424 of 517 in CA
Livability — Riverbank
- Score
- 57/100
- State rank
- #757
- US rank
- #22107
Category grades
Schools grade is shown separately in the Schools card above.
Census & demographics
- County
- Stanislaus County · 445,786 people
- City population
- 25,593
- Metro
- Modesto, CA
- Population (ZIP)
- 34,810
- Household income
- $92,963
- Rent vs Own
- Severe rent burden
- 1276.0
Population outlook (Stanislaus County) Hauer SSP2
- Today (2025)
- 579,493 people
- By 2030
- 598,000 · +3.2%
- By 2040
- 630,930 · +8.9%
- By 2050
- 658,300 · +13.6%
- By 2075
- 712,363 · +22.9%
- By 2100
- 719,805 · +24.2%
Race, ethnicity, and origin ACS 2023
- Neighborhood character
- Majority White (61%)
- Race & ethnicity
- White 61% Hispanic / Latino 30% Two or more races 18% Asian 2%
- Hispanic origin (detail)
- Mexican 25%
- Common ancestry
- Russian 5% Italian 4% Iranian 2%
- Foreign-born
- 11% · Canada, China
- Languages at home
- 80% English-only · Spanish 18% German/W. Germanic 1% Other Indo-European 1%
Political lean MEDSL · Stanislaus
- 2024 margin
- R (+11.0) · D 43.2% · R 54.2% · Other 2.6%
- 2008→2024 swing
- -12.7pp toward R · 2008: 1.7pp · 2024: -11.0pp
- All cycles
- 2024: R+11.0 2020: D+0.8 2016: D+0.6 2012: D+0.7 2008: D+1.7
Not yet ingested
- Civics
- —
Market trends
- HPI YoY
- ▼ -507.52%
- Current HPI
- 283.0924
- Rent YoY
- —
- Metro
- Modesto, CA
- State GDP YoY
- ▲ 3.21%
- F500 in state
- 116
Industry mix (Fortune 500 HQ in CA)
| Industry | F500 HQs | Revenue |
|---|---|---|
| Technology | 27 | $1,492B |
|
||
| Financial Services | 3 | $174B |
|
||
| Retail | 3 | $44B |
|
||
| Insurance | 3 | $26B |
|
||
| Media / Entertainment | 2 | $115B |
|
||
| Pharmaceuticals / Biotech | 2 | $62B |
|
||
Cash-flow waterfall
monthlySold comps — $/sqft
last 12 mo · ≤1 miLoading sold comps…