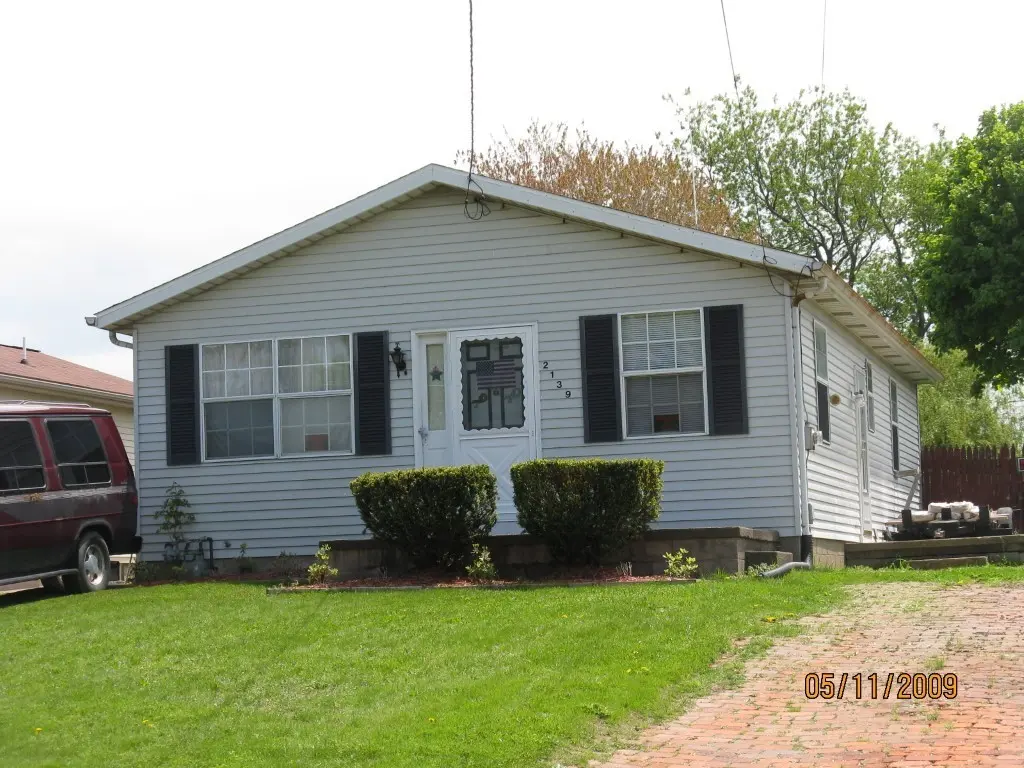
2139 W 22nd St · Erie, PA
Flood risk 1/10 · Minimal
- FEMA flood zone
- X (unshaded)
- Chance of flooding over 30 yrs
- 0.0%
- Est. flood insurance / yr
- $473 – $860
Fire risk 1/10 · Minimal
- Est. fire insurance / yr
- $511 – $949
Heat risk 3/10 · Minor
- Hot days now (above 90°F)
- 7 days/yr
- Hot days in 30 yrs
- 17 days/yr
Wind risk 1/10 · Minimal
- Chance of severe wind over 30 yrs
- —
Air-quality risk 2/10 · Minimal
- Unhealthy air days now
- 1 days/yr
- Unhealthy air days in 30 yrs
- 3 days/yr
Risk factors via First Street. Map © Google.
Why this score? — see what drove the D grade
The composite is a weighted blend of 9 inputs, each scored 0–100. Each bar is that input's sub-score; the figure is the points it added to the 100-point composite (weight × sub-score).
- Cash flow +15.3/30.0
- ARV discount +8.4/15.0
- DSCR +4.7/10.0
- 1% rule +4.6/10.0
- Livability +4.2/5.0
- Rent growth +3.2/5.0
- Condition / age +2.5/5.0
- Schools +1.3/10.0
- Appreciation +0.0/10.0
$159,900
🖨 Deal sheet (PDF) 📄 Offer letter ✓ Due diligence
Listing remarks MLS
Plenty of opportunity in this potential rental or fixer-upper. Conveniently located and priced right. Great fenced rear yard with shed and long paved driveway. Some finished space in the lower level. A bit of work will go a long way on this one.
Key facts
- 5,401 sq ft lot
- Built 1975
Neighborhood map
What this means for you Summary
Snapshot
- This is a 3-bed/1.0-bath single-family listed at $160k.
Deal economics
- At list price, monthly cash flow is $59 ($705/yr) — positive.
- The deal already cash-flows at list — no discount required.
- To meet the 1% rule (rent ≥ 1% of price), the offer needs to be $153k (4.1% below list).
- Recommended offer: $153k (4.1% below list) — sets the bar for 1% rule.
- Cap rate 6.7% vs local median 5.4% in Erie — meaningfully above typical; check what's discounted (condition, days-on-market, listing class) to confirm the premium yield is real.
Location & tenants
- Location reads 83/100 on livability (#109 in PA, #840 nationally) — a professional / high-income tenant draw. Strengths: amenities A+, commute A+, cost of living A+; Watch: crime D+, employment F.
- Erie City SD (urban): math 12% / reading 19% proficiency, ranked #510 of 539 in PA (top 95%) — low school quality limits family demand, transient renter base, plan for 1-2y turnover; 81% free/reduced lunch — lower-income household profile, screen leases tightly.
- Zoned schools: Grover Cleveland El Sch (math 18% / reading 30%, grade F, #1,211 of 1,518 statewide, top 80%, 554 students, 100% FRL); Northwest Pa Collegiate Academy (math 82%, 753 students, 100% FRL) — zoned schools average 100% FRL vs 81% district-wide (19 pts higher); higher-poverty schools than district average — tighter screening recommended.
- Market conditions: Rents rising (+3.0%/yr); 56 active listings in the ZIP; 3 comparable units currently listed for rent nearby; rentals lingering (median 46d on market — plan ~5-8 weeks vacancy on turnover, expect pricing pressure); 100% of comp listings sitting > 30 days — soft ceiling on asking rent; lower-income renter base — watch delinquency; 364 units permitted in Erie County in 2024 (188 in 5+ unit buildings).
- At $1,534/mo this rent would consume 48% of the median local household income ($39k/yr) (locally 1044% of renters already pay >50% of income on rent) — very limited rent-growth headroom before tenants either downsize or default.
Forward outlook
- Local home prices are declining (-3.0%/yr); year-one equity from $1k of loan paydown is wiped out by about $5k of value loss. Plan a longer hold.
- Erie County population projected at -14% by 2050 — secular population decline; favor cash flow + early exit over multi-decade hold.
Negotiation context
- Only 0 days on market — expect competitive offers; lowballing is unlikely to land.
- 2 sale attempts since 8y ago with the ask held roughly flat each time — persistent listings suggest the price (not the market) is what's stuck; bring a comps-based counter.
- Current owner paid $36k; list at $160k implies a 338% gain — meaningful room to come down on a strong offer.
Questions for the listing agent
- Built in 1975 — when were the roof, HVAC, electrical panel, plumbing, and water heater last replaced?
- Is there a deadline driving the sale (1031 exchange, divorce, estate, relocation)? That informs how much negotiation room exists.
- Crime grade is D in this area — have there been break-ins, vandalism, or insurance claims at this property in the last 3 years? What carrier currently insures it and at what premium?
- The area grade is low — what's the realistic commute time and amenity access for the typical tenant pool here? Any planned neighborhood developments (good or bad) we should know about?
- What's the average days-on-market for RENTAL listings here right now (not sales)? A rising rental-DOM trend means longer vacancies and softer asking-rent achievability than the comps imply.
- What's the recent tenant-quality profile in this submarket — average credit score on applications, eviction rate, late-payment / NSF rate, and stable-employment percentage? A property-management company in the area should have these aggregated.
- How much new for-sale + rental construction is in the pipeline within 1–3 miles? Heavy new supply typically softens prices + rents 12–24 months out; constrained supply supports both.
Investment metrics
- 1% rule
- 0.96% ✗
- Cap rate
- 6.73%
- Cash-on-cash
- 1.58%
- DSCR
- 1.07
- GRM
- 8.7
CMA / ARV
- ARV (on-the-fly)
- $163,200
- Comps found
- 12
Show comp detail 12 sales within ~0.75 mi
| Address | Dist | Beds/Ba | Sqft | Sold | Price | $/sf | Match |
|---|---|---|---|---|---|---|---|
| 2918 Hudson Rd | 0.55mi | 3/1.0 | 1,199 (-0%) | 2mo | $162,900 | $136 | 73 |
| 2109 S Manor Dr | 0.68mi | 3/1.0 | 1,222 (+2%) | 2mo | $190,000 | $155 | 64 |
| 3001 Highland Rd | 0.64mi | 3/1.0 | 1,139 (-5%) | 1mo | $240,000 | $211 | 61 |
| 3025 Berkley Rd | 0.71mi | 3/2.0 | 1,206 (+0%) | 5mo | $175,000 | $145 | 58 |
| 2653 W 25th St | 0.69mi | 3/1.0 | 1,253 (+4%) | 4mo | $170,000 | $136 | 57 |
| 2829 Feasler Ave | 0.48mi | 3/1.0 | 1,344 (+12%) | 2mo | $153,000 | $114 | 56 |
| 1652 W 23rd St | 0.66mi | 3/2.0 | 1,171 (-2%) | 8mo | $165,000 | $141 | 55 |
| 2920 Post Ave | 0.46mi | 3/1.0 | 1,370 (+14%) | 0mo | $80,000 | $58 | 55 |
| 3022 Hudson Rd | 0.62mi | 3/2.0 | 1,326 (+10%) | 6mo | $165,000 | $124 | 44 |
| 1630 W 21st St | 0.71mi | 4/1.5 (+1) | 1,350 (+12%) | 4mo | $138,500 | $103 | 36 |
| 2818 Evanston Ave | 0.70mi | 4/1.5 (+1) | 1,361 (+13%) | 8mo | $247,000 | $181 | 32 |
| 3109 Ellsworth Ave | 0.75mi | 4/2.0 (+1) | 1,352 (+13%) | 6mo | $152,000 | $112 | 30 |
Match score weights: distance 35% · size 25% · config 20% · recency 20%. Top-matched comps best support the ARV.
Projected returns pro-forma
-3.0% appreciation · 2.97% rent growth · sell at horizon
- IRR
- -13.8%
- Equity multiple
- 0.51×
- Total profit
- $-22,161
- Equity at exit
- $23,842
- IRR
- -4.9%
- Equity multiple
- 0.68×
- Total profit
- $-14,453
- Equity at exit
- $13,825
Cash invested: $44,772 (down + closing). Projections, not guarantees.
Landlord ↔ Tenant lean methodology
- Overall (STATE)
- 62 Landlord-Friendly
- State Pennsylvania
- 62 Landlord-Friendly · EVEN
- County
- — inherits STATE
- City
- — inherits STATE
ZIP-level market 16502
- Home prices YoY
- -30.5%
- Rents YoY
- 3.0%
- Active inventory
- 56
- Price-to-rent
- 8.7×
Monthly cashflow live
- Estimated rent
- $1,534 medium interval (Pro) →
- Mortgage (P&I)
- −$839
- Tax from tax record
- −$248 /mo · $2,975/yr
- Insurance
- −$67
- HOA
- −$0
- Vacancy / Maint / Mgmt
- −$322
- Net cashflow
- $59
Break-even live
Sensitivity live
| Price | -10% $149 | -5% $104 | +0% $59 | +5% $14 | +10% $-32 |
|---|---|---|---|---|---|
| Rent | -10% $-62 | -5% $-2 | +0% $59 | +5% $119 | +10% $180 |
| Rate | -1.0pp $139 | -0.5pp $99 | base $59 | +0.5pp $17 | +1.0pp $-25 |
UW: 25.0% down · 7.5% · 30yr · 1.5% tax · 5.0% vac · 8.0% maint · 8.0% mgmt
Financing live
Cash to close
- Down payment
- $39,975
- Closing costs
- $4,797
- Reserves months
- —
- Total cash needed
- —
Loan-product check · same deal, 3 products live
Conventional
25% down · 7.5% · 30yr
- Down + closing
- —
- Monthly P&I
- —
- Monthly cashflow
- —
- DSCR
- —
- Eligible?
- —
Personal DTI + credit; lowest rate.
DSCR
20% down · 8.5% · 30yr
- Down + closing
- —
- Monthly P&I
- —
- Monthly cashflow
- —
- DSCR
- —
- Eligible?
- —
No personal income docs; deal must DSCR.
Hard money
10% down · 12.0% · 12mo
- Down + closing
- —
- Monthly P&I
- —
- Monthly cashflow
- —
- DSCR
- —
- Eligible?
- —
Short-term bridge; refi at stabilization.
Rent comps 3 comps
| Address | Beds | Baths | Sqft | Rent | $/sqft | DOM | Units | Dist |
|---|---|---|---|---|---|---|---|---|
| 1837 W 9th St Erie, PA | 3.0 | 1.0 | 1450 | $1,600 | $1.10 | 45d | 1 | 0.99mi |
| 2540 W 8th St Erie, PA | 1.0–2.0 | 1.0–2.0 | 550 | $1,711 | $3.11 | 45d | 1 | 1.08mi |
| 2857 Willowood Dr Unit 2901 Erie, PA | 2.0 | 1.5 | 1300 | $1,750 | $1.35 | 45d | 1 | 1.24mi |
Listing history 6 events
-
2026-04-14historical
-
2026-04-11$159,900
-
2019-02-20soldstatus $36,500 245-char remark
Show marketing remark (245 chars)
Plenty of opportunity in this potential rental or fixer-upper. Conveniently located and priced right. Great fenced rear yard with shed and long paved driveway. Some finished space in the lower level. A bit of work will go a long way on this one.
-
2018-11-01$39,000 245-char remark
Show marketing remark (245 chars)
Plenty of opportunity in this potential rental or fixer-upper. Conveniently located and priced right. Great fenced rear yard with shed and long paved driveway. Some finished space in the lower level. A bit of work will go a long way on this one.
-
1984-05-30soldstatus $29,000
-
1976-10-01soldstatus $28,000
ⓘ Source: listings_history table (triggers on properties + properties_extension) + one-shot
backfill from property_details.listing_events for pre-trigger history.
Tax reassessment forecast PA · Partial reset (capped growth)
- Current annual tax
- $2,975 · $248/mo
- Projected year-2 tax
- $2,975 · $248/mo
- Expected delta
- $0/yr ($0/mo · -0.0%)
ⓘ Screening estimate from a state-policy table — verify with the county assessor before closing.
Climate risk First Street
- Flood 1/10 Low FEMA zone X (unshaded) · 0% chance over 30 yrs
- Wildfire 1/10 Low
- Heat 3/10 Moderate 7 d/yr ≥90°F today · 17 d/yr by 30 yrs out
- Wind 1/10 Low
- Air quality 2/10 Low 1 unhealthy d/yr today · 3 by 30 yrs out
Nearby sold comps map
Loading sold comps map…
Walkable amenities ~0.75 mi
Loading nearby amenities…
Taxation est. · year 1
- Rental income
- $18,408
- − Mortgage interest
- −$8,957
- − Property taxes
- −$2,975
- − Insurance
- −$800
- − Repairs & maintenance
- −$1,473
- − Management
- −$1,473
- − Depreciation
- −$4,652
- Taxable loss
- −$1,920
- Est. tax savings @ 24.0%
- +$461
- After-tax cash flow
- $1,166/yr
For passive investors: Depreciation is non-cash, so a rental often shows a tax loss while cash-flowing — sheltering income. Rental losses are passive: they offset passive income freely, and up to $25,000/yr can offset ordinary (W-2) income if you actively participate and your MAGI is under $100k (phasing out to $0 by $150k); unused losses carry forward. On sale, claimed depreciation is recaptured at up to 25%, and gains may owe capital-gains tax (a 1031 exchange can defer both). Figures are a year-1 estimate at your 24.0% rate — not tax advice; consult a CPA.
Schools (NCES district)
- District
- Erie City SD
- NCES district ID
- 4209300
- Math proficiency
- 12% ▼ -11.00%
- Reading proficiency
- 19% ▼ -16.00%
- Median HH income
- $33,625
- Composite
- 12.59/100
- National rank
- #9617
- State rank
- #510 of 539 in PA
Livability — Erie
- Score
- 83/100
- State rank
- #109
- US rank
- #840
Category grades
Schools grade is shown separately in the Schools card above.
Census & demographics
- Census place
- Erie, PA
- County
- Erie County · 92,215 people
- City population
- 92,215
- Metro
- Erie, PA
- Population (ZIP)
- 15,995
- Household income
- $38,566
- Rent vs Own
- Severe rent burden
- 1044.0
Population outlook (Erie County) Hauer SSP2
- Today (2025)
- 272,159 people
- By 2030
- 266,299 · -2.2%
- By 2040
- 250,987 · -7.8%
- By 2050
- 234,925 · -13.7%
- By 2075
- 199,164 · -26.8%
- By 2100
- 162,985 · -40.1%
Race, ethnicity, and origin ACS 2023
- Neighborhood character
- Predominantly White (66%)
- Race & ethnicity
- White 66% Two or more races 16% Hispanic / Latino 13% Black 11% Asian 2%
- Hispanic origin (detail)
- Mexican 5% Puerto Rican 5%
- Common ancestry
- Romanian 7% Serbian 2% Italian 1%
- Foreign-born
- 5% · Canada
- Languages at home
- 89% English-only · Spanish 8% Other Indo-European 1% Russian/Polish/Slavic 1%
Political lean MEDSL · Erie
- 2024 margin
- Toss-up / Even · D 49.0% · R 50.0%
- 2008→2024 swing
- -20.9pp toward R · 2008: 19.9pp · 2024: -1.0pp
- All cycles
- 2024: R+1.0 2020: D+1.0 2016: R+2.0 2012: D+16.9 2008: D+19.9
Not yet ingested
- Civics
- —
Market trends
- HPI YoY
- ▼ -92.73%
- Current HPI
- 211.4408
- Rent YoY
- ▲ 2.97%
- Metro
- Erie, PA
- State GDP YoY
- ▲ 1.68%
- F500 in state
- 34
Industry mix (Fortune 500 HQ in PA)
| Industry | F500 HQs | Revenue |
|---|---|---|
| Healthcare | 2 | $309B |
|
||
| Insurance | 2 | $27B |
|
||
| Telecommunications / Media | 1 | $124B |
|
||
| Industrial Distribution | 1 | $22B |
|
||
| Financial Services | 1 | $20B |
|
||
| Chemicals / Materials | 1 | $18B |
|
||
Price history
+471.1% since first listed6 events — show timeline
- 2026-04-14 Delisted — GEBOR
- 2026-04-11 Listed $159,900 GEBOR
- 2019-02-20 Sold (MLS) $36,500 GEBOR
- 2018-11-01 Listed $39,000 GEBOR
- 1984-05-30 Sold (Public Records) $29,000 Public Records
- 1976-10-01 Sold (Public Records) $28,000 Public Records
Property tax history
+1.9%/yrLatest (2026): $2,975 · +3.4% YoY. Source: county tax records.
Cash-flow waterfall
monthlySold comps — $/sqft
last 12 mo · ≤1 miLoading sold comps…