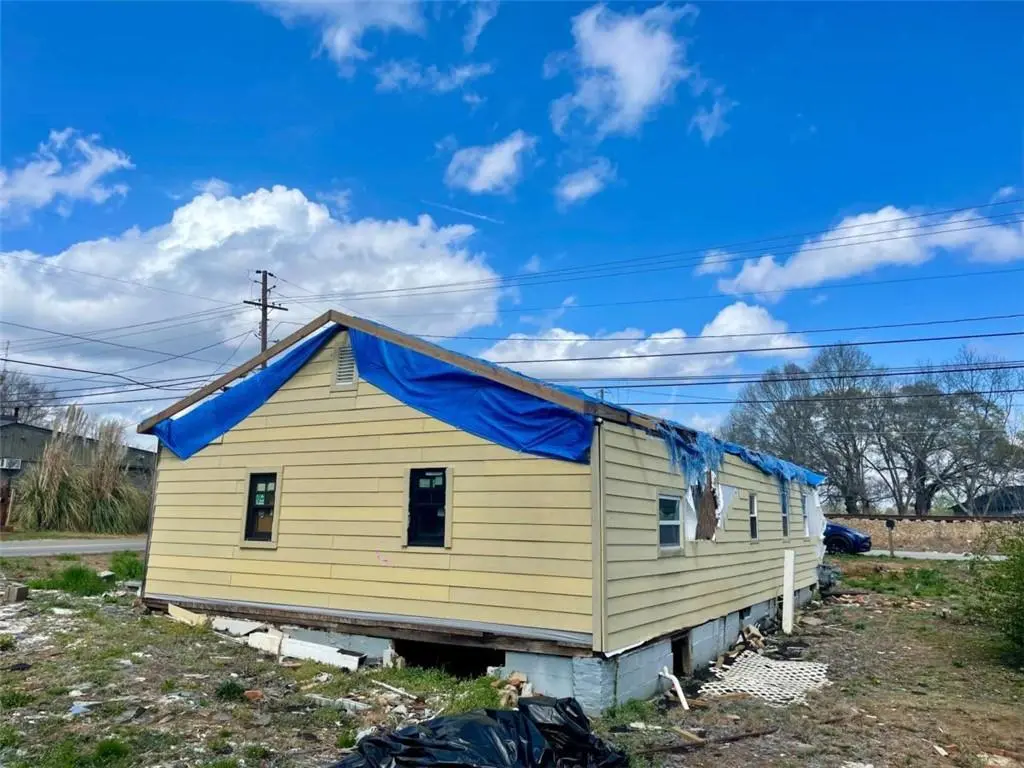
502 Searcy Ave · East Griffin, GA
Flood risk 1/10 · Minimal
- FEMA flood zone
- X (unshaded)
- Chance of flooding over 30 yrs
- 0.0%
- Est. flood insurance / yr
- $507 – $1,088
Fire risk 3/10 · Minor
- Est. fire insurance / yr
- $963 – $1,789
Heat risk 6/10 · Moderate
- Hot days now (above 105°F)
- 7 days/yr
- Hot days in 30 yrs
- 18 days/yr
Wind risk 6/10 · Moderate
- Chance of severe wind over 30 yrs
- 43.0%
Air-quality risk 3/10 · Minor
- Unhealthy air days now
- 4 days/yr
- Unhealthy air days in 30 yrs
- 4 days/yr
Risk factors via First Street. Map © Google.
Why this score? — see what drove the D grade
The composite is a weighted blend of 9 inputs, each scored 0–100. Each bar is that input's sub-score; the figure is the points it added to the 100-point composite (weight × sub-score).
- Cash flow +15.0/30.0
- ARV discount +7.5/15.0
- 1% rule +5.0/10.0
- DSCR +5.0/10.0
- Rent growth +3.3/5.0
- Livability +2.8/5.0
- Condition / age +2.5/5.0
- Schools +1.4/10.0
- Appreciation +0.0/10.0
$32,000
🖨 Deal sheet 📄 Offer letter ✓ Due diligence
Listing remarks
Investor special in Griffin! 4 bedroom, 1.5 bath home with approximately 1,104 square feet ready for renovation. Strong rental or flip potential with a four-bedroom layout. Property sits on a 0.10 acre lot and is conveniently located near downtown Griffin and local amenities. Sold as-is. Cash only. Bring your contractor and your vision.
Key facts
- Local amenities
- Conveniently located
- Four bedroom layout
Tags
Property features AI
Exterior
- Parking: Driveway parking; Open parking available
- Utilities: Public water; Public sewer; Other utilities
- Home design: One-level home; Fee simple ownership; Resale property; Tile roof
- Construction: Other construction materials
- Exterior features: Other exterior features; City street and other road frontage; Asphalt/paved road access; GPS-friendly directions
Interior
- Kitchen: No specific kitchen features listed
- Bedrooms: Four main-level bedrooms; Attic/other room
- Flooring: Other flooring
- Bathrooms: One full bathroom; One half bathroom; Main level has one full and one half bath; Master bathroom: None (no special features listed)
- Heating & cooling: Central air; Other heating
- Interior features: No shared/common walls; Other interior features
- Laundry & utility: Laundry features described as other
Neighborhood map
What this means for you Summary
Snapshot
- This is a 4-bed/1.0-bath single-family listed at $32k.
Deal economics
- At list price, monthly cash flow is $909 ($11k/yr) — positive.
- The deal already cash-flows at list — no discount required.
- Meets the 1% rule at list price ($1k rent vs $32k).
- Recommended offer: $31k (3.0% below list) — sets the bar for market timing.
Location & tenants
- Location reads 55/100 on livability (#511 in GA) — a working-class tenant base; expect higher turnover. Strengths: cost of living A+, crime A, housing B; Watch: schools F, amenities F, commute F.
- Griffin-Spalding County (suburban): math 13% / reading 19% proficiency, ranked #151 of 174 in GA (top 87%) — low school quality limits family demand, transient renter base, plan for 1-2y turnover; 68% free/reduced lunch — lower-income household profile, screen leases tightly.
- Market conditions: Rents rising (+3.3%/yr); 427 active listings in the ZIP; 9 comparable units currently listed for rent nearby; rentals at typical pace (median 24d on market — plan ~3-4 weeks tenant-placement turnaround); 44% of comp listings sitting > 30 days — soft ceiling on asking rent; 342 units permitted in Spalding County in 2024 (0 in 5+ unit buildings).
Forward outlook
- Local home prices are declining (-3.0%/yr); year-one equity from $221 of loan paydown is wiped out by about $960 of value loss. Plan a longer hold.
- Spalding County population projected at -15% by 2050 — secular population decline; favor cash flow + early exit over multi-decade hold.
- At projected returns (-3.0% appreciation + 3.3% rent growth), your $9k cash investment doubles in ~1 year — after that, you're playing with house money.
Negotiation context
- It's been on market 32 days — a 3% lower offer ($31k) is reasonable based on typical stale-listing flexibility.
- 7 sale attempts with the ask held roughly flat each time — persistent listings suggest the price (not the market) is what's stuck; bring a comps-based counter.
- Current owner paid $20k; list at $32k implies a 60% gain — meaningful room to come down on a strong offer.
Risks & watch-outs
- Climate carrying-cost: major wind risk, 43% chance of damaging wind over 30y; extreme-heat days projected 7→18/yr by 2055 (HVAC capex compounding) — expect insurance premiums to compound above CPI over the hold.
Questions for the listing agent
- It's been on market 32 days. Have you received any prior offers? Is the seller open to a 3% concession, seller financing, or rate buy-down credit?
- Built in 1960 — when were the roof, HVAC, electrical panel, plumbing, and water heater last replaced?
- Is there a deadline driving the sale (1031 exchange, divorce, estate, relocation)? That informs how much negotiation room exists.
- Schools are F-rated, which usually means shorter tenancies and higher turnover. Who's the typical renter profile here, and what's been the actual vacancy rate?
- The area grade is low — what's the realistic commute time and amenity access for the typical tenant pool here? Any planned neighborhood developments (good or bad) we should know about?
- What's the average days-on-market for RENTAL listings here right now (not sales)? A rising rental-DOM trend means longer vacancies and softer asking-rent achievability than the comps imply.
- What's the recent tenant-quality profile in this submarket — average credit score on applications, eviction rate, late-payment / NSF rate, and stable-employment percentage? A property-management company in the area should have these aggregated.
- How much new for-sale + rental construction is in the pipeline within 1–3 miles? Heavy new supply typically softens prices + rents 12–24 months out; constrained supply supports both.
Investment metrics
- 1% rule
- 4.48% ✓
- Cap rate
- 40.37%
- Cash-on-cash
- 121.70%
- DSCR
- 6.42
- GRM
- 1.9
CMA / ARV
- ARV (median comp)
- $156,217
- List price
- $32,000
- Delta
- -79.52%
- Verdict
- UNDERPRICED
- Comps
- 20 within 1.0 mi
Show comp detail 9 sales within ~0.75 mi
| Address | Dist | Beds/Ba | Sqft | Sold | Price | $/sf | Match |
|---|---|---|---|---|---|---|---|
| 1001 Green Hill Dr | 0.24mi | 3/1.0 (-1) | 1,059 (-4%) | 21mo | $160,000 | $151 | 60 |
| 251 Lang St | 0.54mi | 3/1.5 (-1) | 1,120 (+1%) | 7mo | $155,000 | $138 | 60 |
| 179 Grady St | 0.65mi | 3/1.5 (-1) | 1,131 (+2%) | 4mo | $194,990 | $172 | 55 |
| 410 Dora St | 0.74mi | 3/1.0 (-1) | 1,173 (+6%) | 3mo | $195,000 | $166 | 48 |
| 67 Fourth St | 0.30mi | 3/2.0 (-1) | 1,184 (+7%) | 22mo | $135,000 | $114 | 47 |
| 911 Clayton St | 0.63mi | 3/1.5 (-1) | 1,194 (+8%) | 4mo | $200,000 | $168 | 46 |
| 130 S Brawner St | 0.74mi | 3/2.0 (-1) | 1,086 (-2%) | 15mo | $179,900 | $166 | 41 |
| 1130 High Falls Rd | 0.62mi | 3/2.0 (-1) | 1,162 (+5%) | 19mo | $204,000 | $176 | 37 |
| 407 Dora St | 0.72mi | 3/1.0 (-1) | 1,066 (-3%) | 23mo | $180,000 | $169 | 36 |
Match score weights: distance 35% · size 25% · config 20% · recency 20%. Top-matched comps best support the ARV.
Projected returns pro-forma
-3.0% appreciation · 3.34% rent growth · sell at horizon
- IRR
- —
- Equity multiple
- 6.94×
- Total profit
- $53,208
- Equity at exit
- $4,771
- IRR
- —
- Equity multiple
- 14.73×
- Total profit
- $122,988
- Equity at exit
- $2,767
Cash invested: $8,960 (down + closing). Projections, not guarantees.
Landlord ↔ Tenant lean methodology
- Overall (STATE)
- 90 Strongly Landlord-Friendly
- State Georgia
- 90 Strongly Landlord-Friendly · R+3
- County
- — inherits STATE
- City
- — inherits STATE
ZIP-level market 30223
- Rents YoY
- 3.3%
- Active inventory
- 427
- Price-to-rent
- 1.9×
Monthly cashflow live
- Estimated rent
- $1,434 high interval (Pro) →
- Mortgage (P&I)
- −$168
- Tax from tax record
- −$43 /mo · $517/yr
- Insurance
- −$13
- HOA
- −$0
- Vacancy / Maint / Mgmt
- −$301
- Net cashflow
- $909
Break-even live
UW: 25.0% down · 7.5% · 30yr · 1.5% tax · 5.0% vac · 8.0% maint · 8.0% mgmt
Financing live
Cash to close
- Down payment
- $8,000
- Closing costs
- $960
- Reserves months
- —
- Total cash needed
- —
Loan-product check · same deal, 3 products live
Conventional
25% down · 7.5% · 30yr
- Down + closing
- —
- Monthly P&I
- —
- Monthly cashflow
- —
- DSCR
- —
- Eligible?
- —
Personal DTI + credit; lowest rate.
DSCR
20% down · 8.5% · 30yr
- Down + closing
- —
- Monthly P&I
- —
- Monthly cashflow
- —
- DSCR
- —
- Eligible?
- —
No personal income docs; deal must DSCR.
Hard money
10% down · 12.0% · 12mo
- Down + closing
- —
- Monthly P&I
- —
- Monthly cashflow
- —
- DSCR
- —
- Eligible?
- —
Short-term bridge; refi at stabilization.
Rent comps 9 comps
| Address | Beds | Baths | Sqft | Rent | $/sqft | DOM | Units | Dist |
|---|---|---|---|---|---|---|---|---|
| 953 E Solomon St Griffin, GA | 3.0 | 1.0 | 944 | $1,100 | $1.17 | 24d | 1 | 0.50mi |
| 102 Grady St Griffin, GA | 3.0 | 1.0 | 1008 | $950 | $0.94 | 44d | 1 | 0.54mi |
| 218 Irving Ave Griffin, GA | 3.0 | 1.0 | 1306 | $1,250 | $0.96 | 12d | 1 | 0.58mi |
| 218 Irving Ave Griffin, GA | 3.0 | 1.0 | 1306 | $1,290 | $0.99 | 43d | 1 | 0.58mi |
| 625 E Wall St Griffin, GA | 3.0 | 2.0 | 1128 | $1,200 | $1.06 | 20d | 1 | 0.88mi |
| 592 Elles Way Griffin, GA | 3.0 | 2.0 | 1260 | $1,350 | $1.07 | 43d | 1 | 1.23mi |
| 352 Adams St Griffin, GA | 3.0 | 1.5 | 1296 | $1,350 | $1.04 | 43d | 1 | 1.38mi |
| 324 Adams St Griffin, GA | 3.0 | 2.0 | 1363 | $1,595 | $1.17 | 24d | 1 | 1.39mi |
| 126 Sihane Rd Griffin, GA | 3.0 | 1.0 | 1156 | $1,700 | $1.47 | 24d | 1 | 1.44mi |
Listing history 25 events
-
2026-06-04days on market $32,000 Active 32 DOM
-
2026-06-03days on market $32,000 Active 31 DOM
-
2026-05-31days on market $32,000 Active 30 DOM
-
2026-05-01status Back On Market
-
2026-04-30$32,000 New 338-char remark
-
2026-04-30historical
-
2026-04-30$32,000 Active
-
2026-04-30historical
-
2026-04-23status Active
-
2026-04-23price $32,000
-
2026-04-18status Under Contract
-
2026-04-18status Back On Market
-
2026-04-17historical
-
2026-04-17historical
-
2026-04-13price $35,000
-
2026-04-13price $35,000
-
2026-04-11status Active
-
2026-03-31historical
-
2026-03-30price $40,000
-
2026-03-30price $40,000
-
2026-03-16price $48,000
-
2026-03-15$48,000 New
-
2026-03-15$65,000 Active
-
2021-08-05soldstatus $20,000
-
2021-01-26soldstatus $15,000
ⓘ Source: listings_history table (triggers on properties + properties_extension) + one-shot
backfill from property_details.listing_events for pre-trigger history.
Tax reassessment forecast GA · Resets to sale price
- Current annual tax
- $517 · $43/mo
- Projected year-2 tax
- $517 · $43/mo
- Expected delta
- $0/yr ($0/mo · 0.0%)
ⓘ Screening estimate from a state-policy table — verify with the county assessor before closing.
Climate risk First Street
- Flood 1/10 Low FEMA zone X (unshaded) · 0% chance over 30 yrs
- Wildfire 3/10 Moderate
- Heat 6/10 Major 7 d/yr ≥105°F today · 18 d/yr by 30 yrs out
- Wind 6/10 Major 43% chance of damaging wind over 30 yrs
- Air quality 3/10 Moderate 4 unhealthy d/yr today · 4 by 30 yrs out
Nearby sold comps map
Loading sold comps map…
Walkable amenities ~0.75 mi
Loading nearby amenities…
Taxation est. · year 1
- Rental income
- $17,209
- − Mortgage interest
- −$1,792
- − Property taxes
- −$517
- − Insurance
- −$160
- − Repairs & maintenance
- −$1,377
- − Management
- −$1,377
- − Depreciation
- −$931
- Taxable income
- $11,055
- Est. tax owed @ 24.0%
- −$2,653
- After-tax cash flow
- $8,251/yr
For passive investors: Depreciation is non-cash, so a rental often shows a tax loss while cash-flowing — sheltering income. Rental losses are passive: they offset passive income freely, and up to $25,000/yr can offset ordinary (W-2) income if you actively participate and your MAGI is under $100k (phasing out to $0 by $150k); unused losses carry forward. On sale, claimed depreciation is recaptured at up to 25%, and gains may owe capital-gains tax (a 1031 exchange can defer both). Figures are a year-1 estimate at your 24.0% rate — not tax advice; consult a CPA.
Schools (NCES district)
- District
- Griffin-Spalding County
- NCES district ID
- 1302520
- Math proficiency
- 13% ▼ -13.00%
- Reading proficiency
- 19% ▼ -12.00%
- Median HH income
- $40,895
- Composite
- 13.71/100
- National rank
- #9496
- State rank
- #151 of 174 in GA
Livability — East Griffin
- Score
- 55/100
- State rank
- #511
- US rank
- #23233
Category grades
Schools grade is shown separately in the Schools card above.
Census & demographics
- Census place
- East Griffin, GA
- County
- Spalding County · 66,676 people
- Metro
- Atlanta-Sandy Springs-Alpharetta, GA
- Population (ZIP)
- 38,262
- Household income
- $59,054
- Rent vs Own
- Severe rent burden
- 1297.0
Population outlook (Spalding County) Hauer SSP2
- Today (2025)
- 63,015 people
- By 2030
- 61,689 · -2.1%
- By 2040
- 57,932 · -8.1%
- By 2050
- 53,474 · -15.1%
- By 2075
- 43,228 · -31.4%
- By 2100
- 32,290 · -48.8%
Race, ethnicity, and origin ACS 2023
- Neighborhood character
- Diverse neighborhood (Simpson 0.59)
- Race & ethnicity
- White 50% Black 38% Hispanic / Latino 7% Two or more races 5% Asian 1%
- Hispanic origin (detail)
- Mexican 5%
- Common ancestry
- Slovak 1% Serbian 1%
- Foreign-born
- 4% · Canada, South Korea
- Languages at home
- 92% English-only · Spanish 6% Korean 1%
Political lean MEDSL · Spalding
- 2024 margin
- R (+16.7) · D 41.4% · R 58.1%
- 2008→2024 swing
- +2.1pp toward D · 2008: -18.8pp · 2024: -16.7pp
- All cycles
- 2024: R+16.7 2020: R+20.8 2016: R+24.2 2012: R+20.0 2008: R+18.8
Not yet ingested
- Civics
- —
Market trends
- HPI YoY
- ▼ -142.92%
- Current HPI
- 225.7933
- Rent YoY
- ▲ 3.34%
- Metro
- Atlanta-Sandy Springs-Alpharetta, GA
- State GDP YoY
- ▲ 2.66%
- F500 in state
- 28
Industry mix (Fortune 500 HQ in GA)
| Industry | F500 HQs | Revenue |
|---|---|---|
| Paper / Packaging | 2 | $29B |
|
||
| Retail | 1 | $160B |
|
||
| Transportation / Logistics | 1 | $91B |
|
||
| Airlines | 1 | $62B |
|
||
| Consumer Goods | 1 | $47B |
|
||
| Utilities | 1 | $25B |
|
||
Price history
+113.3% since first listed22 events — show timeline
- 2026-05-31 Listing Removed — GAMLS
- 2026-05-01 Relisted — GAMLS
- 2026-04-30 Listing Removed — FMLS
- 2026-04-30 Listing Removed — GAMLS
- 2026-04-30 Listed $32,000 GAMLS
- 2026-04-23 Relisted — FMLS
- 2026-04-23 Price Changed $32,000 FMLS
- 2026-04-18 Pending — GAMLS
- 2026-04-18 Relisted — GAMLS
- 2026-04-17 Listing Removed — FMLS
- 2026-04-17 Listing Removed — GAMLS
- 2026-04-13 Price Changed $35,000 GAMLS
- 2026-04-13 Price Changed $35,000 FMLS
- 2026-04-11 Relisted — FMLS
- 2026-03-31 Listing Removed — FMLS
- 2026-03-30 Price Changed $40,000 GAMLS
- 2026-03-30 Price Changed $40,000 FMLS
- 2026-03-16 Price Changed $48,000 FMLS
- 2026-03-15 Listed $65,000 FMLS
- 2026-03-15 Listed $48,000 GAMLS
- 2021-08-05 Sold (Public Records) $20,000 Public Records
- 2021-01-26 Sold (Public Records) $15,000 Public Records
Property tax history
+3.0%/yrLatest (2025): $517 · -1.0% YoY. Source: county tax records.
Cash-flow waterfall
monthlySold comps — $/sqft
last 12 mo · ≤1 miLoading sold comps…