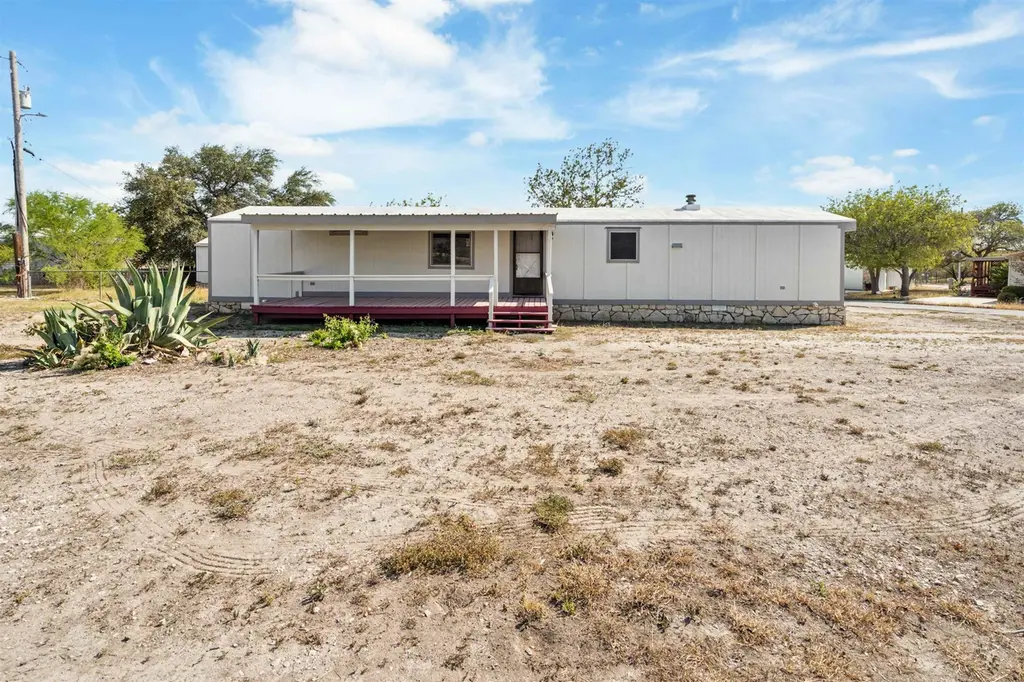
11372 W Hwy 90 Lot 12 · Lake View, TX
Flood risk 1/10 · Minimal
- FEMA flood zone
- X (unshaded)
- Chance of flooding over 30 yrs
- 0.0%
- Est. flood insurance / yr
- $507 – $1,088
Fire risk 7/10 · Major
- Est. fire insurance / yr
- $1,222 – $2,270
Heat risk 8/10 · Major
- Hot days now (above 108°F)
- 6 days/yr
- Hot days in 30 yrs
- 20 days/yr
Wind risk 3/10 · Minor
- Chance of severe wind over 30 yrs
- 8.0%
Air-quality risk 1/10 · Minimal
- Unhealthy air days now
- 0 days/yr
- Unhealthy air days in 30 yrs
- 0 days/yr
Risk factors via First Street. Map © Google.
Why this score? — see what drove the B- grade
The composite is a weighted blend of 9 inputs, each scored 0–100. Each bar is that input's sub-score; the figure is the points it added to the 100-point composite (weight × sub-score).
- Cash flow +30.0/30.0
- 1% rule +10.0/10.0
- DSCR +10.0/10.0
- ARV discount +7.5/15.0
- Condition / age +4.0/5.0
- Rent growth +2.9/5.0
- Schools +2.4/10.0
- Livability +2.1/5.0
- Appreciation +0.0/10.0
$76,000
🖨 Deal sheet 📄 Offer letter ✓ Due diligence
Listing remarks MLS
This updated 2 bedroom, 1.5 bath home features modern upgrades, a spacious open concept living area, kitchen with appliances included, and the convenience of indoor laundry. Large, covered patio great for unwinding and entertaining. Located just minutes from Lake Amistad, Diablo East Boat Ramp, Spur 545, and numerous boat storage sites. Whether you’re looking for a weekend getaway, investment property, or permanent home, this property checks all the boxes.
Key facts
- Large covered patio
- Indoor laundry
- 6,534 sq ft lot
Tags
Neighborhood map
What this means for you Summary
Snapshot
- This is a 2-bed/1.0-bath manufactured listed at $76k. Condition is rated good.
Deal economics
- At list price, monthly cash flow is $309 ($4k/yr) — positive.
- The deal already cash-flows at list — no discount required.
- Meets the 1% rule at list price ($1k rent vs $76k).
- Recommended offer: $69k (9.0% below list) — sets the bar for market timing.
Location & tenants
- Location reads 41/100 on livability (#1,586 in TX) — a working-class tenant base; expect higher turnover. Strengths: cost of living A+, crime A; Watch: health & safety C-, schools F, amenities F.
- San Felipe-Del Rio CISD (town): math 25% / reading 32% proficiency, ranked #667 of 826 in TX (top 81%) — low school quality limits family demand, transient renter base, plan for 1-2y turnover; 70% free/reduced lunch — lower-income household profile, screen leases tightly.
- Market conditions: Rents rising (+1.6%/yr); 549 active listings in the ZIP; 3 comparable units currently listed for rent nearby; rentals lingering (median 44d on market — plan ~5-8 weeks vacancy on turnover, expect pricing pressure); 100% of comp listings sitting > 30 days — soft ceiling on asking rent; 85 units permitted in Val Verde County in 2024 (0 in 5+ unit buildings).
Forward outlook
- Local home prices are declining (-3.0%/yr); year-one equity from $525 of loan paydown is wiped out by about $2k of value loss. Plan a longer hold.
- Val Verde County population projected to shrink 9% by 2050 — rents likely to lag national; underwrite the cash flow, not the appreciation.
- At projected returns (-3.0% appreciation + 1.6% rent growth), your $21k cash investment doubles in ~8 years — after that, you're playing with house money.
Negotiation context
- It's been on market 91 days — a 9% lower offer ($69k) is reasonable based on typical stale-listing flexibility.
- 4 sale attempts since 11y ago with the ask held roughly flat each time — persistent listings suggest the price (not the market) is what's stuck; bring a comps-based counter.
Risks & watch-outs
- Climate carrying-cost: major wildfire risk; extreme-heat days projected 6→20/yr by 2055 (HVAC capex compounding) — expect insurance premiums to compound above CPI over the hold.
Questions for the listing agent
- It's been on market 91 days. Have you received any prior offers? Is the seller open to a 9% concession, seller financing, or rate buy-down credit?
- What does the HOA fee cover, when was the last increase, and are there any pending special assessments or reserve-fund shortfalls?
- Why hasn't it sold? Are there any deal-killer items the seller is aware of (foundation, flood, title, zoning, code violations)?
- Is there a deadline driving the sale (1031 exchange, divorce, estate, relocation)? That informs how much negotiation room exists.
- Schools are F-rated, which usually means shorter tenancies and higher turnover. Who's the typical renter profile here, and what's been the actual vacancy rate?
- What's the average days-on-market for RENTAL listings here right now (not sales)? A rising rental-DOM trend means longer vacancies and softer asking-rent achievability than the comps imply.
- What's the recent tenant-quality profile in this submarket — average credit score on applications, eviction rate, late-payment / NSF rate, and stable-employment percentage? A property-management company in the area should have these aggregated.
- How much new for-sale + rental construction is in the pipeline within 1–3 miles? Heavy new supply typically softens prices + rents 12–24 months out; constrained supply supports both.
Investment metrics
- 1% rule
- 1.59% ✓
- Cap rate
- 11.17%
- Cash-on-cash
- 17.41%
- DSCR
- 1.77
- GRM
- 5.2
CMA / ARV
No comps found within radius.
Projected returns pro-forma
-3.0% appreciation · 1.55% rent growth · sell at horizon
- IRR
- 7.0%
- Equity multiple
- 1.27×
- Total profit
- $5,708
- Equity at exit
- $11,332
- IRR
- 14.9%
- Equity multiple
- 2.12×
- Total profit
- $23,747
- Equity at exit
- $6,571
Cash invested: $21,280 (down + closing). Projections, not guarantees.
Landlord ↔ Tenant lean methodology
- Overall (STATE)
- 87 Strongly Landlord-Friendly
- State Texas
- 87 Strongly Landlord-Friendly · R+5
- County
- — inherits STATE
- City
- — inherits STATE
ZIP-level market 78840
- Home prices YoY
- -33.6%
- Rents YoY
- 1.6%
- Active inventory
- 549
- Price-to-rent
- 5.2×
Monthly cashflow live
- Estimated rent
- $1,208 medium interval (Pro) →
- Mortgage (P&I)
- −$399
- Tax est. 1.5%
- −$95 /mo · $1,140/yr
- Insurance
- −$32
- HOA
- −$120
- Vacancy / Maint / Mgmt
- −$254
- Net cashflow
- $309
Break-even live
UW: 25.0% down · 7.5% · 30yr · 1.5% tax · 5.0% vac · 8.0% maint · 8.0% mgmt
Financing live
Cash to close
- Down payment
- $19,000
- Closing costs
- $2,280
- Reserves months
- —
- Total cash needed
- —
Loan-product check · same deal, 3 products live
Conventional
25% down · 7.5% · 30yr
- Down + closing
- —
- Monthly P&I
- —
- Monthly cashflow
- —
- DSCR
- —
- Eligible?
- —
Personal DTI + credit; lowest rate.
DSCR
20% down · 8.5% · 30yr
- Down + closing
- —
- Monthly P&I
- —
- Monthly cashflow
- —
- DSCR
- —
- Eligible?
- —
No personal income docs; deal must DSCR.
Hard money
10% down · 12.0% · 12mo
- Down + closing
- —
- Monthly P&I
- —
- Monthly cashflow
- —
- DSCR
- —
- Eligible?
- —
Short-term bridge; refi at stabilization.
Rent comps 3 comps
| Address | Beds | Baths | Sqft | Rent | $/sqft | DOM | Units | Dist |
|---|---|---|---|---|---|---|---|---|
| 11372 W US Highway 90 #86 Del Rio, TX | 2.0 | 2.0 | 897 | $1,100 | $1.23 | 44d | 1 | 0.08mi |
| 86 Mulberry St Del Rio, TX | 2.0 | 2.0 | 986 | $1,100 | $1.12 | 44d | 1 | 0.12mi |
| 163 Striper Rd Del Rio, TX | 3.0 | 2.0 | 988 | $1,000 | $1.01 | 44d | 1 | 0.70mi |
HOA detail
- Monthly dues
- $120 · $1,440/yr
Listing history 23 events
-
2026-06-19days on market $76,000 Active 91 DOM
-
2026-06-18days on market $76,000 Active 90 DOM
-
2026-06-17days on market $76,000 Active 89 DOM
-
2026-06-16days on market $76,000 Active 88 DOM
-
2026-06-15days on market $76,000 Active 87 DOM
-
2026-06-14days on market $76,000 Active 85 DOM
-
2026-06-12days on market $76,000 Active 84 DOM
-
2026-06-09days on market $76,000 Active 81 DOM
-
2026-06-08days on market $76,000 Active 80 DOM
-
2026-06-07days on market $76,000 Active 79 DOM
-
2026-06-05days on market $76,000 Active 76 DOM
-
2026-06-03days on market $76,000 Active 75 DOM
-
2026-06-02days on market $76,000 Active 74 DOM
-
2026-06-01days on market $76,000 Active 73 DOM
-
2026-05-31days on market $76,000 Active 72 DOM
-
2026-05-30days on market $76,000 Active 71 DOM
-
2026-03-20$76,000 Active 466-char remark
Show marketing remark (466 chars)
This updated 2 bedroom, 1.5 bath home features modern upgrades, a spacious open concept living area, kitchen with appliances included, and the convenience of indoor laundry. Large, covered patio great for unwinding and entertaining. Located just minutes from Lake Amistad, Diablo East Boat Ramp, Spur 545, and numerous boat storage sites. Whether you’re looking for a weekend getaway, investment property, or permanent home, this property checks all the boxes.
-
2025-12-08soldstatus Closed
-
2025-10-01status Pending
-
2025-09-08$95,000 Active
-
2025-08-16$90,000 Active
-
2015-12-31historical
-
2015-05-27$17,000
ⓘ Source: listings_history table (triggers on properties + properties_extension) + one-shot
backfill from property_details.listing_events for pre-trigger history.
Climate risk First Street
- Flood 1/10 Low FEMA zone X (unshaded) · 0% chance over 30 yrs
- Wildfire 7/10 Severe
- Heat 8/10 Severe 6 d/yr ≥108°F today · 20 d/yr by 30 yrs out
- Wind 3/10 Moderate 8% chance of damaging wind over 30 yrs
- Air quality 1/10 Low 0 unhealthy d/yr today · 0 by 30 yrs out
Nearby sold comps map
Loading sold comps map…
Walkable amenities ~0.75 mi
Loading nearby amenities…
Taxation est. · year 1
- Rental income
- $14,491
- − Mortgage interest
- −$4,257
- − Property taxes
- −$1,140
- − Insurance
- −$380
- − Repairs & maintenance
- −$1,159
- − Management
- −$1,159
- − HOA
- −$1,440
- − Depreciation
- −$2,211
- Taxable income
- $2,745
- Est. tax owed @ 24.0%
- −$659
- After-tax cash flow
- $3,047/yr
For passive investors: Depreciation is non-cash, so a rental often shows a tax loss while cash-flowing — sheltering income. Rental losses are passive: they offset passive income freely, and up to $25,000/yr can offset ordinary (W-2) income if you actively participate and your MAGI is under $100k (phasing out to $0 by $150k); unused losses carry forward. On sale, claimed depreciation is recaptured at up to 25%, and gains may owe capital-gains tax (a 1031 exchange can defer both). Figures are a year-1 estimate at your 24.0% rate — not tax advice; consult a CPA.
Condition & rehab AI · 13 photos
This updated 2-bedroom, 1.5-bath home features modern upgrades and is located in a desirable location near Lake Amistad and boat storage sites. The property is move-in ready with good condition and minimal repairs needed.
Value-add opportunities
- Both Landscaping — Enhances curb appeal and property value
- Both Painting exterior — Improves curb appeal and property value
- Both Landscaping and exterior maintenance — Enhances curb appeal and property value
Renovation cost estimate screening
Value-add ROI direction
- Both Landscaping — Enhances curb appeal and property value ↑
- Both Painting exterior — Improves curb appeal and property value ↑
- Both Landscaping and exterior maintenance — Enhances curb appeal and property value ↑
ⓘ Cost ranges are severity-bucket heuristics (US national rule-of-thumb). Get contractor quotes + a written scope before underwriting a rehab budget.
Schools (NCES district)
- District
- San Felipe-Del Rio CISD
- NCES district ID
- 4838900
- Math proficiency
- 25% ▼ -18.00%
- Reading proficiency
- 32% ▼ -5.00%
- Median HH income
- $40,582
- Composite
- 24.04/100
- National rank
- #7766
- State rank
- #667 of 826 in TX
Livability — Lake View
- Score
- 41/100
- State rank
- #1586
- US rank
- #27132
Category grades
Schools grade is shown separately in the Schools card above.
Census & demographics
- County
- Val Verde County · 47,256 people
- City population
- 47,256
- Metro
- Del Rio, TX
- Population (ZIP)
- 47,256
- Household income
- $66,084
- Rent vs Own
- Severe rent burden
- 1111.0
Population outlook (Val Verde County) Hauer SSP2
- Today (2025)
- 48,073 people
- By 2030
- 47,468 · -1.3%
- By 2040
- 45,930 · -4.5%
- By 2050
- 43,904 · -8.7%
- By 2075
- 38,126 · -20.7%
- By 2100
- 26,217 · -45.5%
Race, ethnicity, and origin ACS 2023
- Neighborhood character
- Predominantly Hispanic (82%)
- Race & ethnicity
- Hispanic / Latino 82% Two or more races 24% White 15% Black 1%
- Hispanic origin (detail)
- Mexican 75%
- Common ancestry
- Italian 1% Lithuanian 1% Slovak 1%
- Foreign-born
- 19% · Canada
- Languages at home
- 36% English-only · Spanish 63%
Political lean MEDSL · Val Verde
- 2024 margin
- Strong R (+26.6) · D 36.2% · R 62.9%
- 2008→2024 swing
- -36.2pp toward R · 2008: 9.6pp · 2024: -26.6pp
- All cycles
- 2024: R+26.6 2020: R+9.9 2016: D+7.9 2012: D+5.4 2008: D+9.6
Not yet ingested
- Civics
- —
Market trends
- HPI YoY
- ▼ -81.95%
- Current HPI
- 161.762
- Rent YoY
- ▲ 1.55%
- Metro
- Del Rio, TX
- State GDP YoY
- ▲ 3.95%
- F500 in state
- 110
Industry mix (Fortune 500 HQ in TX)
| Industry | F500 HQs | Revenue |
|---|---|---|
| Energy | 16 | $1,198B |
|
||
| Technology | 5 | $198B |
|
||
| Engineering / Construction | 4 | $72B |
|
||
| Energy Services | 3 | $60B |
|
||
| Utilities | 3 | $41B |
|
||
| Healthcare | 2 | $330B |
|
||
Price history
+347.1% since first listed7 events — show timeline
- 2026-03-20 Listed $76,000 DRBORMLS
- 2025-12-08 Sold (MLS) — DRBORMLS
- 2025-10-01 Pending — DRBORMLS
- 2025-09-08 Listed $95,000 DRBORMLS
- 2025-08-16 Listed $90,000 DRBORMLS
- 2015-12-31 Listing Removed — LERA
- 2015-05-27 Listed $17,000 LERA
Cash-flow waterfall
monthlySold comps — $/sqft
last 12 mo · ≤1 miLoading sold comps…