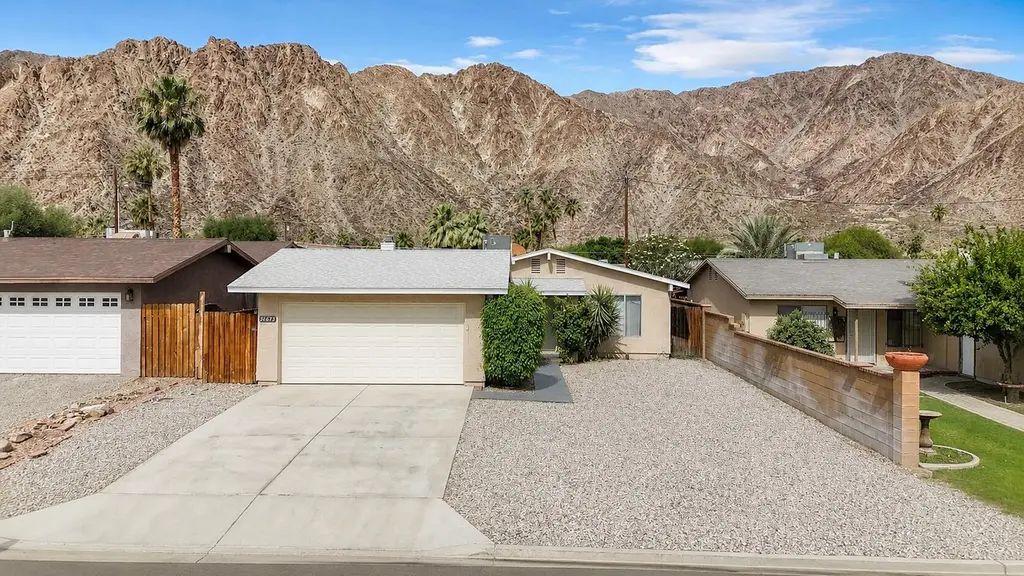
51675 Avenida Rubio · La Quinta, CA
Flood risk 1/10 · Minimal
- FEMA flood zone
- X
- Chance of flooding over 30 yrs
- 0.0%
- Est. flood insurance / yr
- $507 – $1,088
Fire risk 6/10 · Moderate
- Est. fire insurance / yr
- $659 – $1,223
Heat risk 9/10 · Severe
- Hot days now (above 113°F)
- 8 days/yr
- Hot days in 30 yrs
- 22 days/yr
Wind risk 1/10 · Minimal
- Chance of severe wind over 30 yrs
- —
Air-quality risk 4/10 · Minor
- Unhealthy air days now
- 4 days/yr
- Unhealthy air days in 30 yrs
- 5 days/yr
Risk factors via First Street. Map © Google.
Why this score? — see what drove the D grade
The composite is a weighted blend of 9 inputs, each scored 0–100. Each bar is that input's sub-score; the figure is the points it added to the 100-point composite (weight × sub-score).
- ARV discount +15.0/15.0
- Cash flow +9.0/30.0
- Rent growth +4.1/5.0
- Schools +3.8/10.0
- Livability +2.9/5.0
- 1% rule +2.5/10.0
- DSCR +2.5/10.0
- Condition / age +2.5/5.0
- Appreciation +0.0/10.0
$435,000
🖨 Deal sheet (PDF) 📄 Offer letter ✓ Due diligence
Listing remarks MLS
Low priced home in La quinta cove , property offers 3 bedrooms 2 bath. You don't want to miss it, set your appointment today. Property is on Septic.
Key facts
- 5,227 sq ft lot
- 2 garage spots
- Built 1979
Property features AI
Finance
- Other: Property sold as-is; Directions: Use GPS; cross street Calle Sinaloa; Listing terms: Conventional, FHA, Cash; seller will accept offers and submissions; possession at close of escrow; Short-term rentals not allowed; will not consider lease
- HOA & community: No monthly association fee; Not in a gated community
Exterior
- Parking: Total of 8 parking spaces; 2 covered spaces; 2-car attached garage; 2 carport spaces; 2 additional uncovered/assigned spaces; Driveway
- Security: No security features
- Utilities: Water provided by a water district (cvwd); Septic tank
- Home design: Single family residence, detached; One-story, ground level; Composition shingle roof; Built (year per assessor)
- Construction: Composition shingle roof; Built (year per assessor)
- Exterior features: Block and wood fencing; Mountain views
Interior
- Kitchen: Gas cooktop
- Flooring: Laminate floors
- Bathrooms: 2 full bathrooms
- Heating & cooling: Central heating; Central air conditioning
- Interior features: Unfurnished; Living Room; No fireplace
Neighborhood map
What this means for you Summary
Snapshot
- This is a 3-bed/2.0-bath single-family listed at $435k.
Deal economics
- At list price, monthly cash flow is $-342 ($-4k/yr) — negative.
- To cash-flow at today's rent, offer at most $375k (13.9% below list).
- To meet the 1% rule (rent ≥ 1% of price), the offer needs to be $326k (25.0% below list).
- Recommended offer: $326k (25.0% below list) — sets the bar for 1% rule.
- Cap rate 5.3% vs local median 3.3% in La Quinta — top-decile yield for the area; either an underpriced asset or a hidden risk that comps aren't pricing in. Stress-test before assuming the spread holds.
Location & tenants
- Location reads 58/100 on livability (#694 in CA) — a working-class tenant base; expect higher turnover. Strengths: commute A-, employment B+, housing B+; Watch: amenities F, cost of living F, health & safety F.
- Desert Sands Unified (suburban): math 31% / reading 56% proficiency, ranked #199 of 517 in CA (top 38%) — families likely to look elsewhere, expect single-tenant / working-renter base with shorter leases.
- Zoned schools: Benjamin Franklin Elementary (619 students, 78% FRL); La Quinta Middle (math 24% / reading 24%, grade F, #277 of 498 statewide, top 73%, 754 students, 83% FRL); La Quinta High (math 31% / reading 65%, grade D, #380 of 1,170 statewide, top 33%, 2,500 students, 74% FRL) — zoned schools average 78% FRL vs 56% district-wide (22 pts higher); higher-poverty schools than district average — tighter screening recommended.
- Market conditions: Rents rising fast (+6.5%/yr); 660 active listings in the ZIP; 36 comparable units currently listed for rent nearby; rentals at typical pace (median 27d on market — plan ~3-4 weeks tenant-placement turnaround); 42% of comp listings sitting > 30 days — soft ceiling on asking rent; solid renter incomes; 9,195 units permitted in Riverside County in 2024 (1,512 in 5+ unit buildings).
- This rent runs 39% of the median local income ($99k/yr) — at the standard rent-burdened threshold; future hikes will face affordability resistance.
Forward outlook
- Local home prices are declining (-3.0%/yr); year-one equity from $3k of loan paydown is wiped out by about $13k of value loss. Plan a longer hold.
- Riverside County population projected at +22% by 2050 — long-run rental-demand tailwind backs the buy-and-hold thesis.
Negotiation context
- It's been on market 45 days — a 3% lower offer ($422k) is reasonable based on typical stale-listing flexibility.
- 3 sale attempts since 2y ago with the ask held roughly flat each time — persistent listings suggest the price (not the market) is what's stuck; bring a comps-based counter.
Risks & watch-outs
- Climate carrying-cost: major wildfire risk; extreme-heat days projected 8→22/yr by 2055 (HVAC capex compounding) — expect insurance premiums to compound above CPI over the hold.
Questions for the listing agent
- What do current leases actually rent for vs. the listed asking? Can we see a recent rent roll and the last 12 months of T-12 income?
- It's been on market 45 days. Have you received any prior offers? Is the seller open to a 25% concession, seller financing, or rate buy-down credit?
- Built in 1979 — when were the roof, HVAC, electrical panel, plumbing, and water heater last replaced?
- Is there a deadline driving the sale (1031 exchange, divorce, estate, relocation)? That informs how much negotiation room exists.
- Schools are D-rated, which usually means shorter tenancies and higher turnover. Who's the typical renter profile here, and what's been the actual vacancy rate?
- The area grade is low — what's the realistic commute time and amenity access for the typical tenant pool here? Any planned neighborhood developments (good or bad) we should know about?
- What's the average days-on-market for RENTAL listings here right now (not sales)? A rising rental-DOM trend means longer vacancies and softer asking-rent achievability than the comps imply.
- What's the recent tenant-quality profile in this submarket — average credit score on applications, eviction rate, late-payment / NSF rate, and stable-employment percentage? A property-management company in the area should have these aggregated.
- How much new for-sale + rental construction is in the pipeline within 1–3 miles? Heavy new supply typically softens prices + rents 12–24 months out; constrained supply supports both.
Investment metrics
- 1% rule
- 0.75% ✗
- Cap rate
- 5.35%
- Cash-on-cash
- -3.37%
- DSCR
- 0.85
- GRM
- 11.1
CMA / ARV
- ARV (median comp)
- $536,933
- List price
- $435,000
- Delta
- -18.98%
- Verdict
- UNDERPRICED
- Comps
- 20 within 1.0 mi
Show comp detail 12 sales within ~0.75 mi
| Address | Dist | Beds/Ba | Sqft | Sold | Price | $/sf | Match |
|---|---|---|---|---|---|---|---|
| 51715 Avenida Obregon | 0.10mi | 3/2.0 | 1,232 (+0%) | 2mo | $605,000 | $491 | 94 |
| 52105 Avenida Cortez | 0.30mi | 3/2.0 | 1,208 (-2%) | 2mo | $407,000 | $337 | 81 |
| 52057 Avenida Rubio | 0.19mi | 3/2.0 | 1,308 (+6%) | 3mo | $930,000 | $711 | 78 |
| 51905 Avenida Velasco | 0.37mi | 3/2.0 | 1,303 (+6%) | 3mo | $467,500 | $359 | 70 |
| 52140 Avenida Herrera | 0.40mi | 4/2.0 (+1) | 1,286 (+5%) | 2mo | $525,000 | $408 | 67 |
| 52745 Avenida Obregon | 0.56mi | 2/2.0 (-1) | 1,276 (+4%) | 0mo | $475,000 | $372 | 62 |
| 52200 Eisenhower | 0.51mi | 3/2.0 | 1,314 (+7%) | 3mo | $385,000 | $293 | 62 |
| 52810 Avenida Herrera | 0.66mi | 2/2.0 (-1) | 1,200 (-2%) | 2mo | $499,999 | $417 | 59 |
| 52295 Avenida Herrera | 0.44mi | 2/2.0 (-1) | 1,091 (-11%) | 2mo | $340,000 | $312 | 54 |
| 52200 Avenida Velasco | 0.47mi | 3/2.0 | 1,405 (+14%) | 3mo | $587,000 | $418 | 52 |
| 52145 Avenida Bermudas | 0.69mi | 3/2.0 | 1,360 (+11%) | 1mo | $415,000 | $305 | 49 |
| 52860 Avenida Ramirez | 0.64mi | 3/2.0 | 1,380 (+12%) | 2mo | $479,000 | $347 | 48 |
Match score weights: distance 35% · size 25% · config 20% · recency 20%. Top-matched comps best support the ARV.
Projected returns pro-forma
-3.0% appreciation · 6.45% rent growth · sell at horizon
- IRR
- -18.3%
- Equity multiple
- 0.34×
- Total profit
- $-80,585
- Equity at exit
- $64,860
- IRR
- -5.1%
- Equity multiple
- 0.62×
- Total profit
- $-46,676
- Equity at exit
- $37,611
Cash invested: $121,800 (down + closing). Projections, not guarantees.
Landlord ↔ Tenant lean methodology
- Overall (STATE)
- 18 Strongly Tenant-Friendly
- State California
- 18 Strongly Tenant-Friendly · D+13
- County
- — inherits STATE
- City
- — inherits STATE
ZIP-level market 92253
- Rents YoY
- 6.5%
- Active inventory
- 660
- Price-to-rent
- 11.1×
Monthly cashflow live
- Estimated rent
- $3,261 high interval (Pro) →
- Mortgage (P&I)
- −$2,281
- Tax from tax record
- −$456 /mo · $5,470/yr
- Insurance
- −$181
- HOA
- −$0
- Vacancy / Maint / Mgmt
- −$685
- Net cashflow
- $-342
Break-even live
Sensitivity live
| Price | -10% $-96 | -5% $-219 | +0% $-342 | +5% $-465 | +10% $-589 |
|---|---|---|---|---|---|
| Rent | -10% $-600 | -5% $-471 | +0% $-342 | +5% $-214 | +10% $-85 |
| Rate | -1.0pp $-123 | -0.5pp $-232 | base $-342 | +0.5pp $-455 | +1.0pp $-570 |
UW: 25.0% down · 7.5% · 30yr · 1.5% tax · 5.0% vac · 8.0% maint · 8.0% mgmt
Financing live
Cash to close
- Down payment
- $108,750
- Closing costs
- $13,050
- Reserves months
- —
- Total cash needed
- —
Loan-product check · same deal, 3 products live
Conventional
25% down · 7.5% · 30yr
- Down + closing
- —
- Monthly P&I
- —
- Monthly cashflow
- —
- DSCR
- —
- Eligible?
- —
Personal DTI + credit; lowest rate.
DSCR
20% down · 8.5% · 30yr
- Down + closing
- —
- Monthly P&I
- —
- Monthly cashflow
- —
- DSCR
- —
- Eligible?
- —
No personal income docs; deal must DSCR.
Hard money
10% down · 12.0% · 12mo
- Down + closing
- —
- Monthly P&I
- —
- Monthly cashflow
- —
- DSCR
- —
- Eligible?
- —
Short-term bridge; refi at stabilization.
Rent comps 36 comps
| Address | Beds | Baths | Sqft | Rent | $/sqft | DOM | Units | Dist |
|---|---|---|---|---|---|---|---|---|
| 51980 Avenida Cortez La Quinta, CA | 3.0 | 2.0 | 1374 | $3,495 | $2.54 | 45d | 1 | 0.23mi |
| 51850 Avenida Vallejo La Quinta, CA | 3.0 | 2.0 | 1233 | $2,895 | $2.35 | 21d | 1 | 0.28mi |
| 52228 Avenida Obregon La Quinta, CA | 2.0 | 2.0 | 1350 | $3,350 | $2.48 | 45d | 1 | 0.28mi |
| 51685 Avenida Herrera La Quinta, CA | 3.0 | 2.0 | 1320 | $2,875 | $2.18 | 26d | 1 | 0.28mi |
| 51225 Avenida Ramirez La Quinta, CA | 3.0 | 2.0 | 1476 | $6,000 | $4.07 | 45d | 1 | 0.30mi |
| 52395 Avenida Carranza La Quinta, CA | 3.0 | 2.0 | 1272 | $2,500 | $1.97 | 45d | 1 | 0.37mi |
| 51345 Avenida Velasco La Quinta, CA | 3.0 | 2.0 | 1233 | $3,000 | $2.43 | 45d | 1 | 0.37mi |
| 52420 Avenida Juarez La Quinta, CA | 3.0 | 2.0 | 1424 | $3,700 | $2.60 | 26d | 1 | 0.38mi |
| 51700 Avenida Martinez La Quinta, CA | 3.0 | 2.0 | 1200 | $2,900 | $2.42 | 45d | 1 | 0.47mi |
| 51099 Eisenhower Dr Unit 9 La Quinta, CA | 2.0 | 1.5 | 1000 | $1,995 | $2.00 | 24d | 1 | 0.49mi |
| 51099 Eisenhower Dr Unit 7 La Quinta, CA | 2.0 | 1.5 | 1000 | $1,995 | $2.00 | 4d | 1 | 0.49mi |
| 51099 Eisenhower Dr Unit 7 La Quinta, CA | 2.0 | 1.5 | 1000 | $1,995 | $2.00 | 45d | 1 | 0.49mi |
| 51049 Eisenhower Dr Unit J La Quinta, CA | 2.0 | 1.5 | 1000 | $1,995 | $2.00 | 24d | 1 | 0.49mi |
| 51049 Eisenhower Dr Unit G La Quinta, CA | 2.0 | 1.5 | 1000 | $1,995 | $2.00 | 45d | 1 | 0.49mi |
| 51049 Eisenhower Dr Unit 9 La Quinta, CA | 2.0 | 1.5 | 1000 | $1,995 | $2.00 | 4d | 1 | 0.49mi |
| 52680 Avenida Juarez La Quinta, CA | 3.0 | 2.0 | 1440 | $3,500 | $2.43 | 45d | 1 | 0.50mi |
| 51020 Eisenhower Dr Unit 7 La Quinta, CA | 2.0 | 1.0 | 1000 | $1,995 | $2.00 | 24d | 1 | 0.52mi |
| 51020 Eisenhower Dr Unit 6 La Quinta, CA | 2.0 | 1.0 | 1000 | $1,995 | $2.00 | 5d | 1 | 0.52mi |
| 51080 Eisenhower Dr Unit 27 La Quinta, CA | 2.0 | 1.5 | 1000 | $2,195 | $2.19 | 24d | 1 | 0.53mi |
| 51080 Eisenhower Dr Unit A La Quinta, CA | 2.0 | 1.5 | 1000 | $2,195 | $2.19 | 45d | 1 | 0.53mi |
| 51080 Eisenhower Dr Unit 30 La Quinta, CA | 2.0 | 1.5 | 1000 | $2,195 | $2.19 | 4d | 1 | 0.53mi |
| 51025 Avenue Martinez Unit 2 La Quinta, CA | 2.0 | 2.5 | 1000 | $2,195 | $2.19 | 5d | 1 | 0.54mi |
| 51025 Avenue Martinez Unit 9 La Quinta, CA | 2.0 | 2.5 | 1000 | $2,195 | $2.19 | 24d | 1 | 0.54mi |
| 77835 Calle Tampico Unit 3 La Quinta, CA | 2.0 | 1.0 | 805 | $1,825 | $2.27 | 5d | 1 | 0.61mi |
| 50660 Eisenhower Dr La Quinta, CA | 1.0–3.0 | 1.0–2.0 | 960 | $2,910 | $3.03 | 45d | 1 | 0.71mi |
| 52637 Avenida Villa La Quinta, CA | 4.0 | 2.0 | 1410 | $6,000 | $4.26 | 45d | 1 | 0.72mi |
| 53655 Avenida Ramirez La Quinta, CA | 3.0 | 2.0 | 1378 | $3,500 | $2.54 | 45d | 1 | 1.00mi |
| 53720 Avenida Obregon La Quinta, CA | 2.0 | 2.0 | 1222 | $2,300 | $1.88 | 26d | 1 | 1.02mi |
| 53665 Avenida Vallejo La Quinta, CA | 3.0 | 2.0 | 1248 | $2,600 | $2.08 | 26d | 1 | 1.02mi |
| 53755 Avenida Diaz La Quinta, CA | 3.0 | 2.0 | 1325 | $3,085 | $2.33 | 26d | 1 | 1.05mi |
| 78225 Desert Fall Way La Quinta, CA | 3.0 | 2.0 | 1286 | $4,500 | $3.50 | 4d | 1 | 1.06mi |
| 53805 Avenida Martinez La Quinta, CA | 3.0 | 2.0 | 1412 | $2,495 | $1.77 | 24d | 1 | 1.15mi |
| 53805 Avenida Martinez La Quinta, CA | 3.0 | 2.0 | 1412 | $2,495 | $1.77 | 7d | 1 | 1.15mi |
| 53980 Avenida Mendoza La Quinta, CA | 3.0 | 2.0 | 1404 | $3,500 | $2.49 | 1d | 1 | 1.26mi |
| 54270 Avenida Alvarado La Quinta, CA | 2.0 | 2.0 | 1454 | $5,000 | $3.44 | 45d | 1 | 1.30mi |
| 54665 Avenida Rubio La Quinta, CA | 3.0 | 2.0 | 1426 | $2,750 | $1.93 | 45d | 1 | 1.49mi |
Listing history 24 events
-
2026-06-21days on market $435,000 Active 45 DOM
-
2026-06-18days on market $435,000 Active 42 DOM
-
2026-06-17pricedays on market $435,000 Active 41 DOM
-
2026-06-16days on market $445,000 Active 40 DOM
-
2026-06-15days on market $445,000 Active 39 DOM
-
2026-06-13days on market $445,000 Active 37 DOM
-
2026-06-09days on market $445,000 Active 33 DOM
-
2026-06-08days on market $445,000 Active 32 DOM
-
2026-06-07pricedays on market $445,000 Active 31 DOM
-
2026-06-04days on market $455,000 Active 28 DOM
-
2026-06-03days on market $455,000 Active 27 DOM
-
2026-06-02days on market $455,000 Active 26 DOM
-
2026-06-01days on market $455,000 Active 25 DOM
-
2026-05-31days on market $455,000 Active 24 DOM
-
2026-05-07$455,000 Active 1334-char remark
-
2026-05-06historical $455,000 1334-char remark
-
2024-08-13historical 148-char remark
Show marketing remark (148 chars)
Low priced home in La quinta cove , property offers 3 bedrooms 2 bath. You don't want to miss it, set your appointment today. Property is on Septic.
-
2024-08-12soldstatus $405,000 Closed 148-char remark
Show marketing remark (148 chars)
Low priced home in La quinta cove , property offers 3 bedrooms 2 bath. You don't want to miss it, set your appointment today. Property is on Septic.
-
2024-07-17status Pending 148-char remark
Show marketing remark (148 chars)
Low priced home in La quinta cove , property offers 3 bedrooms 2 bath. You don't want to miss it, set your appointment today. Property is on Septic.
-
2024-07-08price $415,000 148-char remark
Show marketing remark (148 chars)
Low priced home in La quinta cove , property offers 3 bedrooms 2 bath. You don't want to miss it, set your appointment today. Property is on Septic.
-
2024-06-21status Active 148-char remark
Show marketing remark (148 chars)
Low priced home in La quinta cove , property offers 3 bedrooms 2 bath. You don't want to miss it, set your appointment today. Property is on Septic.
-
2024-06-12status Pending 148-char remark
Show marketing remark (148 chars)
Low priced home in La quinta cove , property offers 3 bedrooms 2 bath. You don't want to miss it, set your appointment today. Property is on Septic.
-
2024-06-04$425,000 Active 148-char remark
Show marketing remark (148 chars)
Low priced home in La quinta cove , property offers 3 bedrooms 2 bath. You don't want to miss it, set your appointment today. Property is on Septic.
-
1989-06-27soldstatus $75,000
ⓘ Source: listings_history table (triggers on properties + properties_extension) + one-shot
backfill from property_details.listing_events for pre-trigger history.
Tax reassessment forecast CA · Resets to sale price
- Current annual tax
- $5,470 · $456/mo
- Projected year-2 tax
- $5,470 · $456/mo
- Expected delta
- $0/yr ($0/mo · 0.0%)
ⓘ Screening estimate from a state-policy table — verify with the county assessor before closing.
Climate risk First Street
- Flood 1/10 Low FEMA zone X · 0% chance over 30 yrs
- Wildfire 6/10 Major
- Heat 9/10 Extreme 8 d/yr ≥113°F today · 22 d/yr by 30 yrs out
- Wind 1/10 Low
- Air quality 4/10 Moderate 4 unhealthy d/yr today · 5 by 30 yrs out
Nearby sold comps map
Loading sold comps map…
Walkable amenities ~0.75 mi
Loading nearby amenities…
Taxation est. · year 1
- Rental income
- $39,129
- − Mortgage interest
- −$24,367
- − Property taxes
- −$5,470
- − Insurance
- −$2,175
- − Repairs & maintenance
- −$3,130
- − Management
- −$3,130
- − Depreciation
- −$12,655
- Taxable loss
- −$11,798
- Est. tax savings @ 24.0%
- +$2,832
- After-tax cash flow
- $-1,276/yr
For passive investors: Depreciation is non-cash, so a rental often shows a tax loss while cash-flowing — sheltering income. Rental losses are passive: they offset passive income freely, and up to $25,000/yr can offset ordinary (W-2) income if you actively participate and your MAGI is under $100k (phasing out to $0 by $150k); unused losses carry forward. On sale, claimed depreciation is recaptured at up to 25%, and gains may owe capital-gains tax (a 1031 exchange can defer both). Figures are a year-1 estimate at your 24.0% rate — not tax advice; consult a CPA.
Schools (NCES district)
- District
- Desert Sands Unified
- NCES district ID
- 0611110
- Math proficiency
- 31% ▼ -4.00%
- Reading proficiency
- 56% ▲ 7.00%
- Median HH income
- $54,957
- Composite
- 37.77/100
- National rank
- #4346
- State rank
- #199 of 517 in CA
Livability — La Quinta
- Score
- 58/100
- State rank
- #694
- US rank
- #21080
Category grades
Schools grade is shown separately in the Schools card above.
Census & demographics
- Census place
- La Quinta, CA
- County
- Riverside County · 2,287,001 people
- City population
- 38,666
- Metro
- Riverside-San Bernardino-Ontario, CA
- Population (ZIP)
- 38,666
- Household income
- $99,277
- Rent vs Own
- Severe rent burden
- 1078.0
Population outlook (Riverside County) Hauer SSP2
- Today (2025)
- 2,664,475 people
- By 2030
- 2,802,692 · +5.2%
- By 2040
- 3,050,904 · +14.5%
- By 2050
- 3,256,783 · +22.2%
- By 2075
- 3,655,058 · +37.2%
- By 2100
- 3,766,594 · +41.4%
Race, ethnicity, and origin ACS 2023
- Neighborhood character
- Diverse neighborhood (Simpson 0.57)
- Race & ethnicity
- White 54% Hispanic / Latino 37% Two or more races 19% Asian 4% Native American 1% Black 1%
- Hispanic origin (detail)
- Mexican 34%
- Common ancestry
- Romanian 2% Lithuanian 2% Slovak 1%
- Foreign-born
- 15% · Canada, China, Vietnam
- Languages at home
- 71% English-only · Spanish 24% Tagalog/Filipino 1% Chinese 1%
Political lean MEDSL · Riverside
- 2024 margin
- Toss-up / Even · D 48.0% · R 49.3% · Other 2.6%
- 2008→2024 swing
- -3.6pp toward R · 2008: 2.3pp · 2024: -1.3pp
- All cycles
- 2024: R+1.3 2020: D+8.0 2016: D+4.3 2012: R+0.4 2008: D+2.3
Not yet ingested
- Civics
- —
Market trends
- HPI YoY
- ▼ -263.65%
- Current HPI
- 281.8665
- Rent YoY
- ▲ 6.45%
- Metro
- Riverside-San Bernardino-Ontario, CA
- State GDP YoY
- ▲ 3.21%
- F500 in state
- 116
Industry mix (Fortune 500 HQ in CA)
| Industry | F500 HQs | Revenue |
|---|---|---|
| Technology | 27 | $1,492B |
|
||
| Financial Services | 3 | $174B |
|
||
| Retail | 3 | $44B |
|
||
| Insurance | 3 | $26B |
|
||
| Media / Entertainment | 2 | $115B |
|
||
| Pharmaceuticals / Biotech | 2 | $62B |
|
||
Price history
+480.0% since first listed12 events — show timeline
- 2026-06-16 Price Changed $435,000 GPSMLS
- 2026-06-04 Price Changed $445,000 GPSMLS
- 2026-05-07 Listed $455,000 GPSMLS
- 2026-05-06 Coming Soon $455,000 GPSMLS
- 2024-08-13 Listing Removed — GPSMLS
- 2024-08-12 Sold (MLS) $405,000 GPSMLS
- 2024-07-17 Pending — GPSMLS
- 2024-07-08 Price Changed $415,000 GPSMLS
- 2024-06-21 Relisted — GPSMLS
- 2024-06-12 Pending — GPSMLS
- 2024-06-04 Listed $425,000 GPSMLS
- 1989-06-27 Sold (Public Records) $75,000 Public Records
Property tax history
+8.2%/yrLatest (2025): $5,470 · +138.4% YoY. Source: county tax records.
Cash-flow waterfall
monthlySold comps — $/sqft
last 12 mo · ≤1 miLoading sold comps…